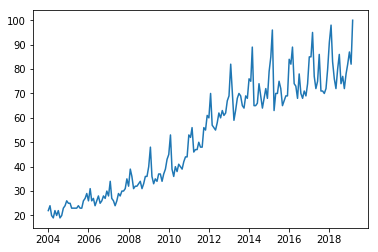
The trend of time series is the general direction in which the values change. In this post, we will focus on how to use rolling windows to isolate it. Let’s download the interest in the search term Pancakes from Google Trends and see what we can do with it:

import pandas as pd
import matplotlib.pyplot as plt
url = './data/pancakes.csv' # downloaded from https://trends.google.com
data = pd.read_csv(url, skiprows=2, parse_dates=['Month'], index_col=['Month'])
plt.plot(data)

Pandas Tutorial

Looking at the data we notice that there’s some seasonality (Pancakes Day! Yay!) and an increasing trend. What if we want to visualize just the trend of this curve? We only need to slide a rolling window through the data and compute the average at each step. This can be done in just one line if we use the rolling method:

Source de l’article sur DZONE


Content

  • Step 1: Know Yourself

  • Step 2: Build a Complete Data Environment
    • 1. Set Standards
    • 2. Build Platforms
    • 3. Control Key Links
  • Step 3: Perform Business Analysis
    • 1. Set Clear KPIs
    • 2. Build a Complete Indicator System
    • 3. Set a Reporting System
    • 4. Create Basic Inquiry Reports
    • 5. Create Business Reports
    • 6. Create Strategy Reports
    • 7. Build Analysis System
  • Conclusion

In the Internet era, every company in the world has a bunch of data, but not all companies can manage this data and then make intelligent decisions. How can we make the most of this data for our business and drive our business forward? What exactly can we do to harness the power of our data?

Source de l’article sur DZONE

Did you know that we launched our newest podcast last month? So far, we’ve covered big concerns with big data, what you need to know about microservicesDevOps fails, and more. Our latest episode, out today, examines how devs and ops can go wrong with containers.

The Tom’s Tech Notes podcast features conversations that our research analyst Tom Smith has had with software industry experts from around the world as part of his work on our research guides. We put out new episodes every Sunday at 11 AM EST.

Source de l’article sur DZONE

Photo credit by US Air Force/Steve Pivnick

As software becomes increasingly ubiquitous in all of our lives, the consequences of their inevitable failures grow as well. To the point: When the United States rushed to digitize medical patient records back in 2009, blinded by the glow of a $36 billion government carrot, it inadvertently set off a chain of events that has now, and in some cases forever, impaired countless lives.

Source de l’article sur DZONE

Residuals are essentially gaps that are left when a given model, in this case, linear regression, does not fit the given observations completely.

A close analogy for residual analysis is found in medical pathology. What remains post-metabolism usually becomes an indicator of what was processed and absorbed versus what was not so.

Source de l’article sur DZONE


What is Open Data?

Open data is readable data that anyone can access, use/reuse, and share.

Let’s talk about the keywords from the above definition:

Source de l’article sur DZONE

Prometheus is an open-source infrastructure and services monitoring system popular for Kubernetes and cloud-native services and apps. It can help make metric collection easier, correlate events and alerts, provide security, and do troubleshooting and tracing at scale. This Refcard will teach you how to pave the path for Prometheus adoption, what observability looks like beyond Prometheus, and how Prometheus helps provide scalability, high availability, and long-term storage.
Source de l’article sur DZONE

Instead of writing about what exactly ELK is, let me state the need and use cases for it.

Log Aggregation and Efficient Searching

In a very naive scenario, you have one server and lots of log messages generated by your application and system which are crucial to look at once something goes wrong. Now there are basically two problems with it:

Source de l’article sur DZONE

For most developers, staying abreast of the latest tech skills is just another day at the office. As HackerRank’s 2019 Developer Skills Report put it, “Developers are voracious learners by nature and necessity.” Indeed, given the extremely rapid pace of technological innovation these days, devs certainly won’t fare well clinging to outdated concepts.  

But if you peruse the numerous articles out there offering guidance on how developers can fast track their careers, there is one piece of advice that invariably appears, suggesting this thirst for knowledge may not actually be as insatiable as it needs to be. “Anyone can do the technical stuff,” explains a recent piece in SD Times, “but the soft skills are the ones that some architects may struggle with.” Another article in CIO echoes this sentiment: “Technology is constantly changing, and while technical skills are valuable, soft skills are much more noteworthy to businesses in the long run.”

Source de l’article sur DZONE

The Istio traffic management model basically allows for the decoupling of traffic from infrastructure scaling, allowing operations personnel to specify the rules to apply to traffic using Pilot instead of specifying which pods/VMS should receive traffic. Decoupling traffic from infrastructure scaling allows Istio to provide a variety of traffic management functions independent of application code. The Envoy sidecar proxy implements these functions.

In a typical mesh, you often have one or more finalizing external TLS connections at the end to guide traffic into the mesh’s load balancer (known as a gateway); the traffic then flows through internal services after the sidecar gateway. The following figure illustrates the use of gateways in a mesh:

Source de l’article sur DZONE