Articles

Nuages de mots : représentation visuelle du langage

Les nuages de mots sont une représentation visuelle intéressante du langage, qui permet de visualiser les mots les plus utilisés dans un texte.

Dans le domaine de la visualisation des données, les nuages de mots sont devenus une manière populaire et captivante de représenter des informations textuelles. Également connus sous le nom de nuages de tags ou de wordle, les nuages de mots offrent une représentation visuellement attrayante de la fréquence des mots dans un texte ou un jeu de données donné. Leur conception simple mais puissante permet aux spectateurs de comprendre rapidement les mots ou les thèmes les plus prévalents d’une manière visuellement attrayante.

Dans le domaine de la visualisation des données, les nuages de mots sont devenus une manière populaire et captivante de représenter des informations textuelles. Également connus sous le nom de nuages de tags ou de Wordle, les nuages de mots offrent une représentation visuellement attrayante de la fréquence des mots dans un texte ou un jeu de données donné. Leur conception simple et puissante permet aux spectateurs de comprendre rapidement les mots ou les thèmes les plus fréquents d’une manière visuellement attrayante.

Dans cet article, nous explorerons le concept, le processus de création et les applications des nuages de mots, ainsi que leur importance pour comprendre la langue et l’analyse des données. Les nuages de mots sont une forme d’architecture visuelle qui permet aux utilisateurs de comprendre rapidement et facilement des informations complexes. Ils sont souvent utilisés pour représenter des données textuelles, telles que des mots clés, des thèmes ou des sentiments. Les nuages de mots peuvent être créés à partir de n’importe quel type de texte, qu’il s’agisse d’un document, d’un blog ou d’un corpus de données. Les mots sont représentés par des formes et des tailles différentes, ce qui permet aux utilisateurs de voir rapidement les mots les plus fréquents.

Les nuages de mots peuvent être utilisés pour diverses applications, notamment pour comprendre le contenu d’un texte, identifier des tendances ou des thèmes, et analyser les sentiments associés à un sujet. Ils peuvent également être utilisés pour comparer des corpus de données ou pour trouver des relations entre des mots. Les nuages de mots peuvent également être utilisés pour créer une architecture visuelle unique et attrayante pour présenter des informations complexes. Ils peuvent être utilisés pour créer des affiches, des présentations ou des sites Web attrayants qui mettent en valeur les informations textuelles.

En conclusion, les nuages de mots sont une forme puissante et attrayante d’architecture visuelle qui permet aux utilisateurs de comprendre rapidement et facilement des informations complexes. Ils peuvent être utilisés pour représenter des données textuelles, identifier des tendances ou analyser les sentiments associés à un sujet. Les nuages de mots peuvent également être utilisés pour créer une architecture visuelle unique et attrayante pour présenter des informations complexes. Enfin, ils peuvent être utilisés pour créer des affiches, des présentations ou des sites Web attrayants qui mettent en valeur les informations textuelles.

Source de l’article sur DZONE

This article will demonstrate the heterogeneous systems integration and building of the BI system and mainly talk about the DELTA load issues and how to overcome them. How can we compare the source table and target table when we cannot find a proper way to identify the changes in the source table using the SSIS ETL Tool?

Systems Used

  • SAP S/4HANA is an Enterprise Resource Planning (ERP) software package meant to cover all day-to-day processes of an enterprise, e.g., order-to-cash, procure-to-pay, finance & controlling request-to-service, and core capabilities. SAP HANA is a column-oriented, in-memory relational database that combines OLAP and OLTP operations into a single system.
  • SAP Landscape Transformation (SLT) Replication is a trigger-based data replication method in the HANA system. It is a perfect solution for replicating real-time data or schedule-based replication from SAP and non-SAP sources.
  • Azure SQL Database is a fully managed platform as a service (PaaS) database engine that handles most of the management functions offered by the database, including backups, patching, upgrading, and monitoring, with minimal user involvement.
  • SQL Server Integration Services (SSIS) is a platform for building enterprise-level data integration and transformation solutions. SSIS is used to integrate and establish the pipeline for ETL and solve complex business problems by copying or downloading files, loading data warehouses, cleansing, and mining data.
  • Power BI is an interactive data visualization software developed by Microsoft with a primary focus on business intelligence.

Business Requirement

Let us first talk about the business requirements. We have more than 20 different Point-of-Sale (POS) data from other online retailers like Target, Walmart, Amazon, Macy’s, Kohl’s, JC Penney, etc. Apart from this, the primary business transactions will happen in SAP S/4HANA, and business users will require the BI reports for analysis purposes.

Source de l’article sur DZONE

A lot, if not all, of data science projects, require some data visualization front-end to display the results for humans to analyze. Python seems to boast the most potent libraries, but do not lose hope if you’re a Java developer (or if you’re proficient in another language as well). In this post, I will describe how you can benefit from such a data visualization front-end without writing a single line of code.

The Use Case: Changes From Wikipedia

I infer that you are already familiar with Wikipedia. If you are not, Wikipedia is an online encyclopedia curated by the community. In their own words:

Source de l’article sur DZONE

We can’t quit you, baseball! The season might be over, but we want more. So, we’re dipping into the baseball data to see what else we can learn. Read on for one more run around the bases!


Put Me In, Coach

This season, all anyone talked about was home runs. There were 6,770 homers hit during the regular season this year. That’s 665 MORE than the previous record! And exactly half of the teams in the league set franchise home run records. Holy homer! 

Source de l’article sur DZONE

In the last decade, advances in processing power and speed have allowed us to move from tedious and time-consuming manual practices to fast and easy automated data analysis. The more complex the data sets collected, the greater the potential to uncover relevant information. Retailers, banks, manufacturers, healthcare companies, etc., are using data mining to uncover the relationships between everything from price optimization, promotions, and demographics to how economics, risk, competition, and online presence affect their business models, revenues, operations, and customer relationships. Today, data scientists have become indispensable to organizations around the world as companies seek to achieve bigger goals than ever before with data science. In this article, you will learn about the main use cases of data mining and how it has opened up a world of possibilities for businesses.

Today, organizations have access to more data than ever before. However, making sense of the huge volumes of structured and unstructured data to implement improvements across the organization can be extremely difficult due to the sheer volume of information.

Source de l’article sur DZONE

Oracle Transactional Business Intelligence (OTBI) is built on the power of Oracle’s industry-leading business intelligence tool Oracle Business Intelligence Enterprise Edition (OBIEE). This allows users to build powerful data visualization with real-time data that highlights data patterns and encourages data exploration instead of delivering static flat reports. OTBI provides users a wide variety of data visualization options from standard graphs to advanced visuals such as trellis, treemaps, performance tiles, KPIs, and others.

Introducing a CI/CD Solution for OTBI

FlexDeploy has an innovative CI/CD solution for managing the build and deployment of OTBI WebCatalog objects across the pipeline. Using FlexDeploy’s partial deployment model, developers can assemble related catalog objects into packages, build them from source control or a development environment, and deploy them into the target environments.

Source de l’article sur DZONE

One of the few bright spots in 2020 has been the creativity companies and individuals alike have exhibited in dealing with what, at times, seemed to be overwhelming problems.

The world of web design was no different. Designers and agencies had to adapt and implement new color schemes or design new shopping experiences, which made some of the previous design trends not fit for the current design problems.

We’ll take a look at these newest design trends and the rationale behind them. As we do so, we’ll also take a look at some of BeTheme’s 600+ pre-built sites that have already put them to good use.

1. Comforting Color Palettes Lighten the Load

In years past, bolder color schemes were one of the hallmarks of web design trends. Their purpose was to quickly engage a visitor and prompt him or her to respond emotionally.

Given all the drama and turmoil we were subjected to through most of 2020, we’ve come to welcome the use of toned-down colors in marketing instead of the bolder, brasher, and more “in-your-face” color schemes. 

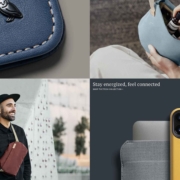
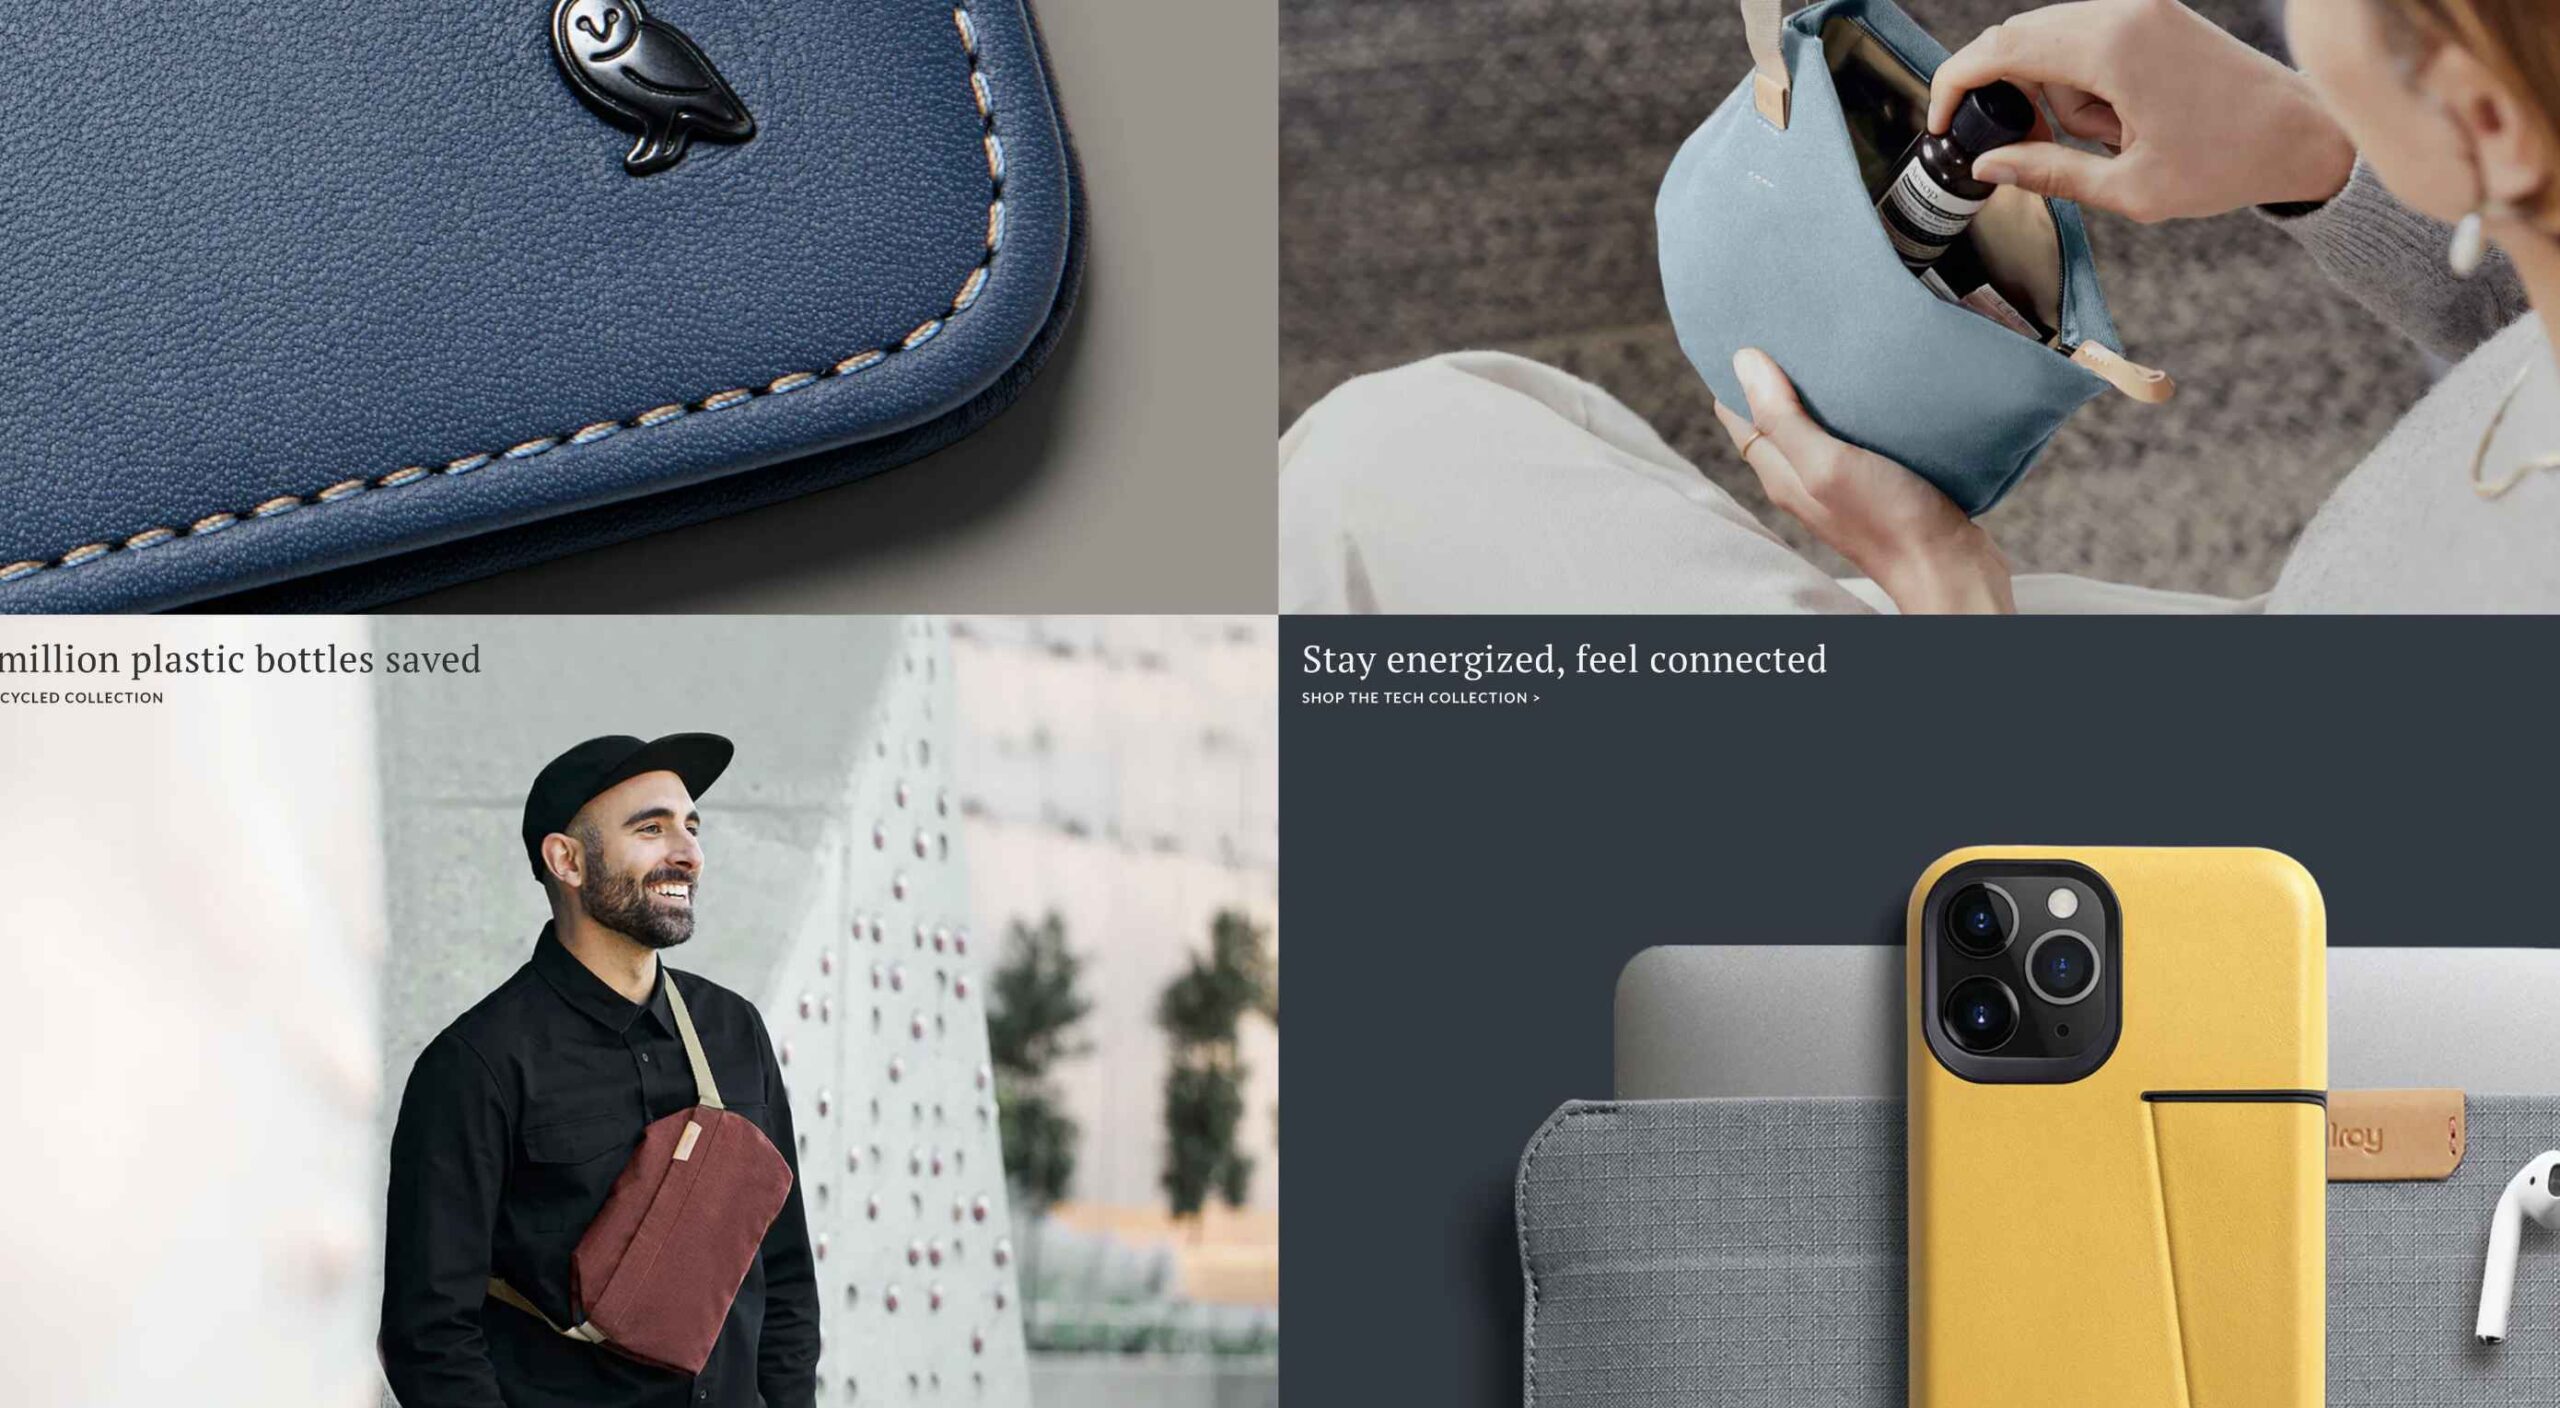
Bellroy’s website puts toned-down colors to good use. This company’s product line of wallets, bags, and the like, are designed to keep people’s belongings organized, safe, and secure. A wild color scheme simply wouldn’t be fitting.

How, then, are brightly-colored products dealt with? Thanks to judicious uses of white space and background photos, this website still emphasizes a toned-down color palette.

The BeSpa pre-built website is another example of a color scheme that almost immediately puts the mind at ease.

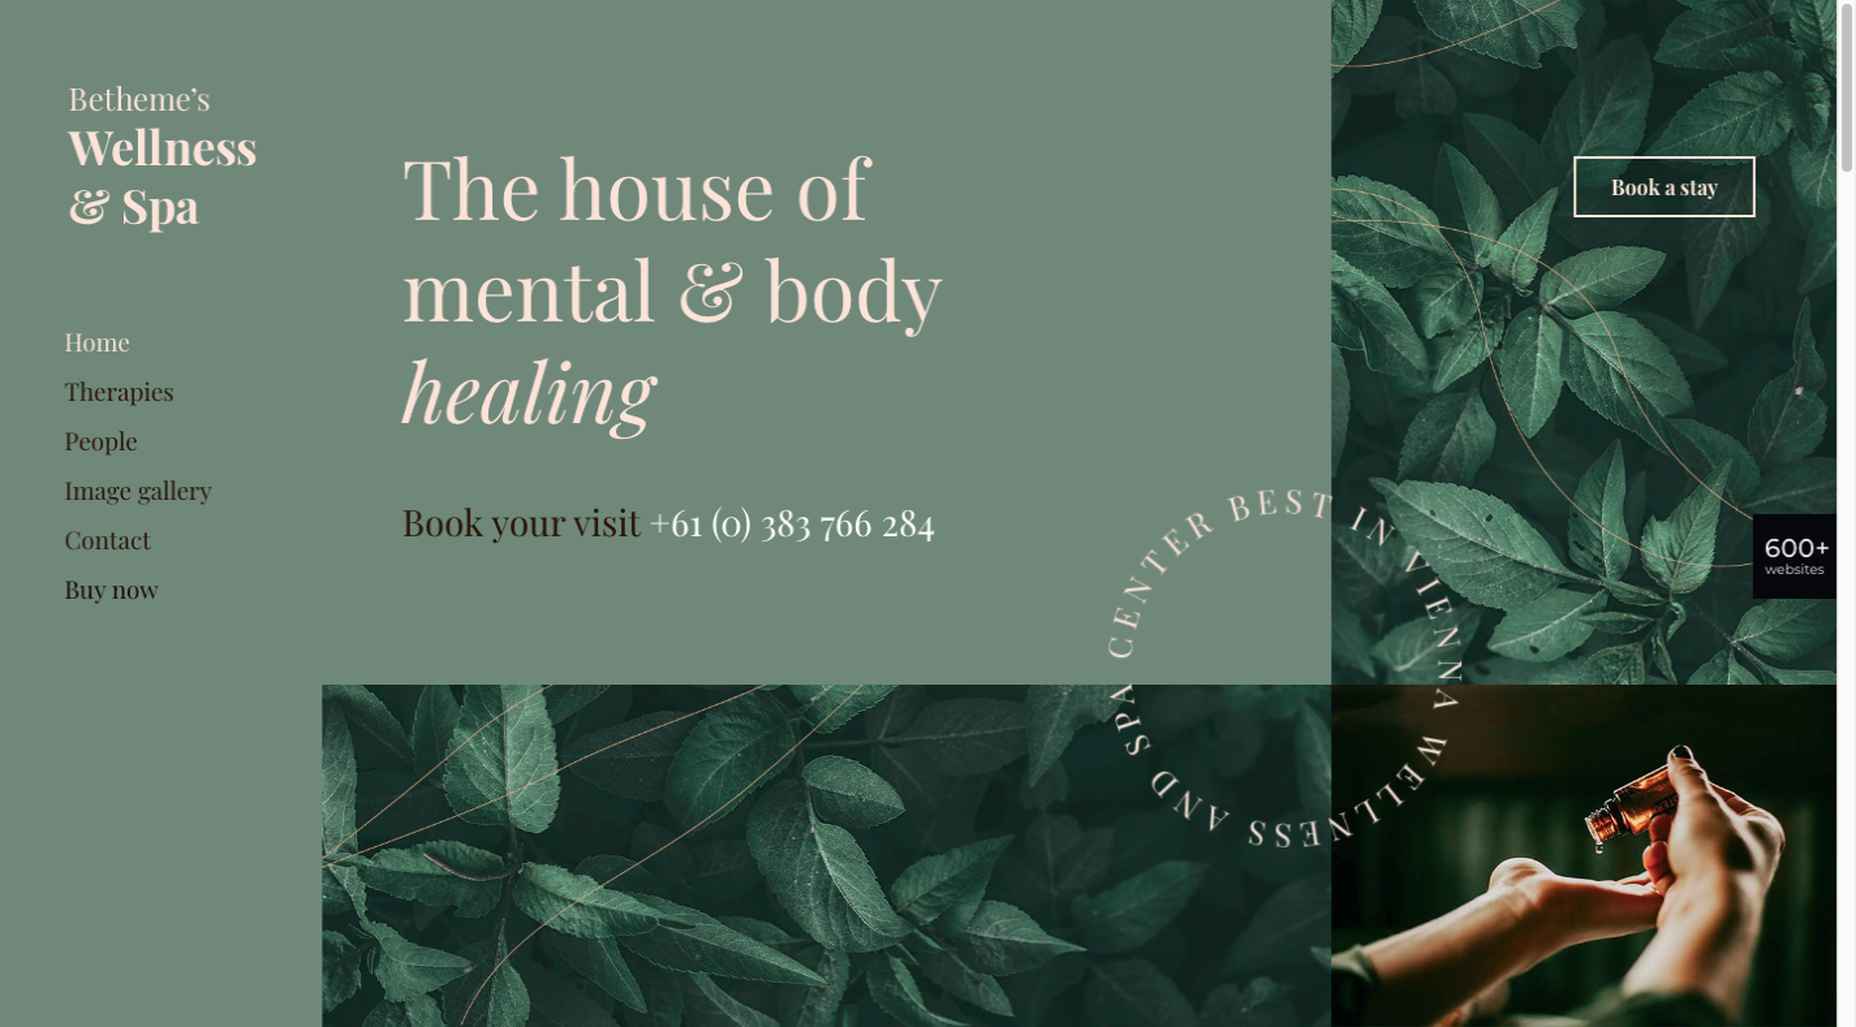
Calm and soothing? Yes.

Boring? Definitely not.

Comfort and security are the emotional drivers in this example.

2. Seamlessly Intermingle and Balance Physical and Digital Imagery

People confined to their homes because of Covid-based restrictions spent many more hours looking at their screens in 2020. Online programming began to take on the appearance of a reality show that blurred the boundaries between the real and the digital.

Whereas web designers tended in the past to rely on either photos or illustrations in their designs, these same designers have started to integrate these blurring effects into their designs, with results that range from amusing and quirky to highly informative.

Check out this example from fashion designer Constance Burke

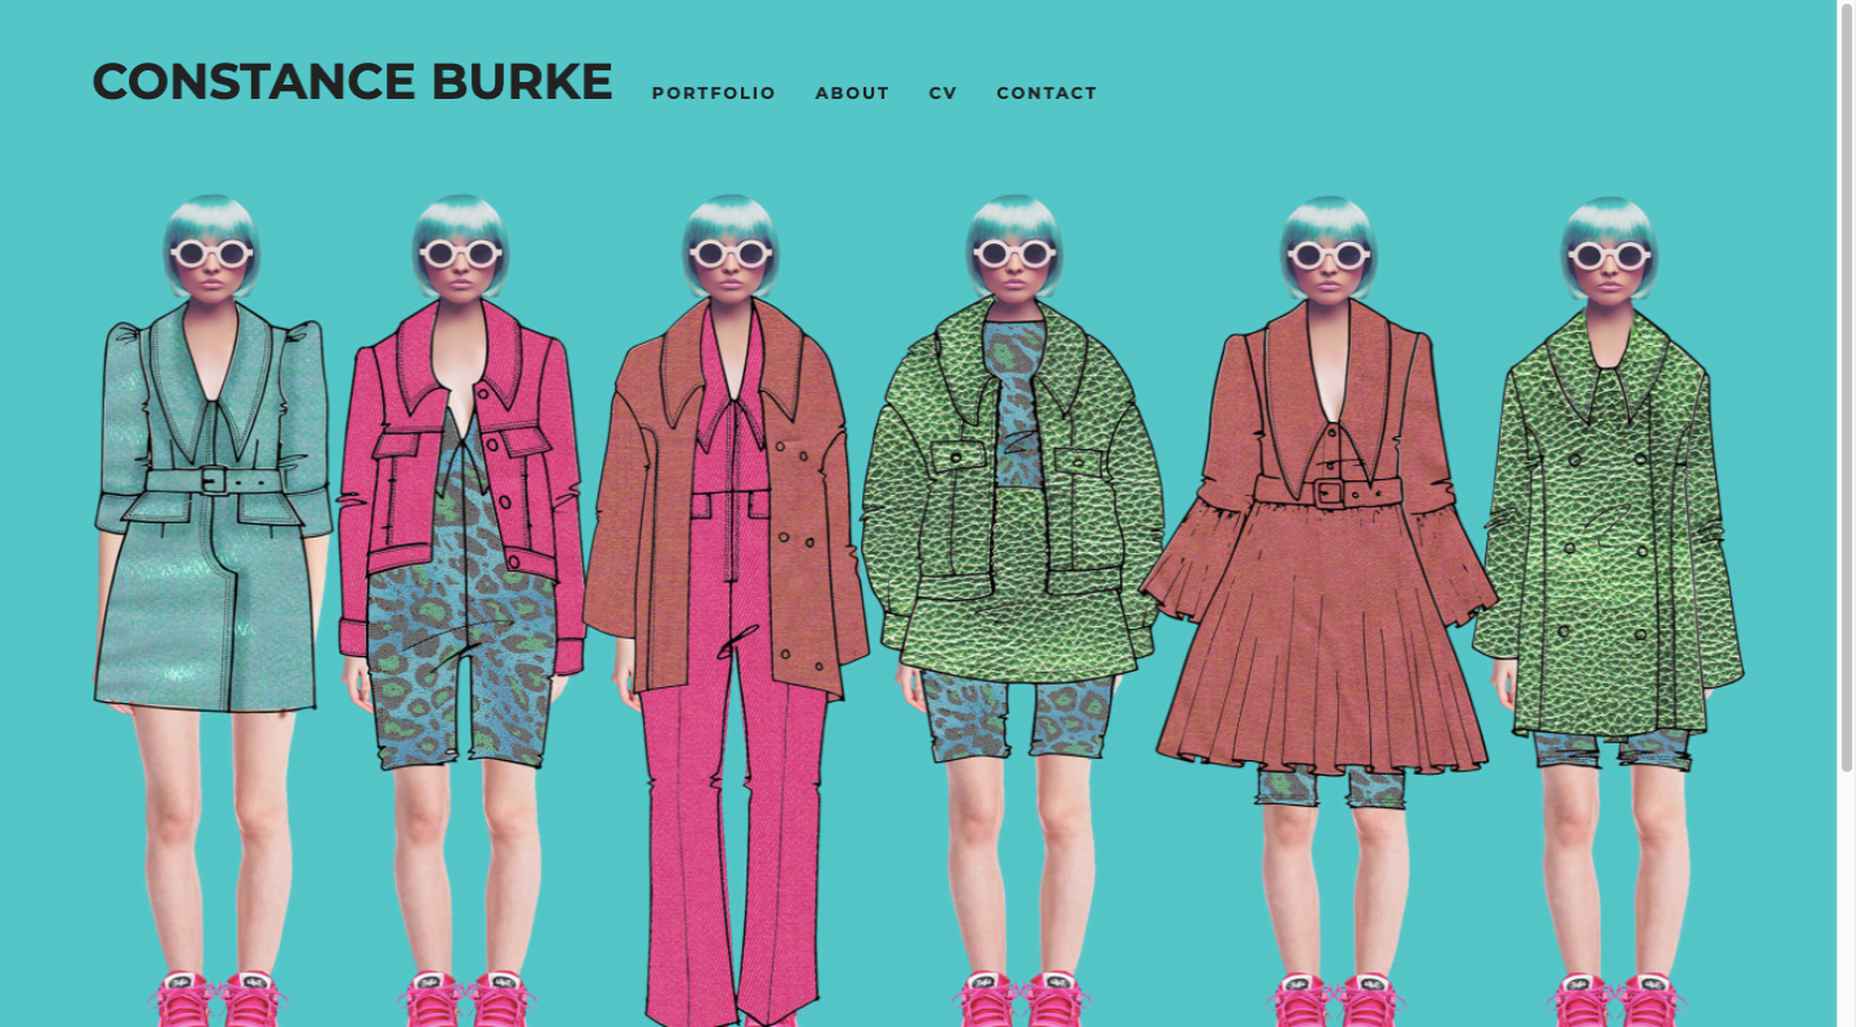
It’s not every day you see real models wearing hand-drawn fashion sketches. But it’s just one example of how the physical can be blended with the digital.

The BeSki pre-built site does the same blending of the two, but in a totally different way:

The sections’ designs switch from predominantly physical to largely digital and back again, an excellent approach that provides a maximum amount of useful information.

It’s also worth noting how snowbanks are effectively used to seamlessly transition from one section to the next.

3. Create Well-Organized and Helpful Shopping Experiences

More people spending more time at home has created a surge in online shopping. As a result, many online store owners are now feeling the effects of increased competition.

Consumers look for brands they believe they can trust. At the same time, they want their online shopping experiences to be as quick and painless as possible. They look for (and expect) quick and effective product search capabilities, helpful and effective product displays, one-page product descriptions, and the like.

Walgreen’s product page design is especially well-suited for 2021 ecommerce shoppers: 

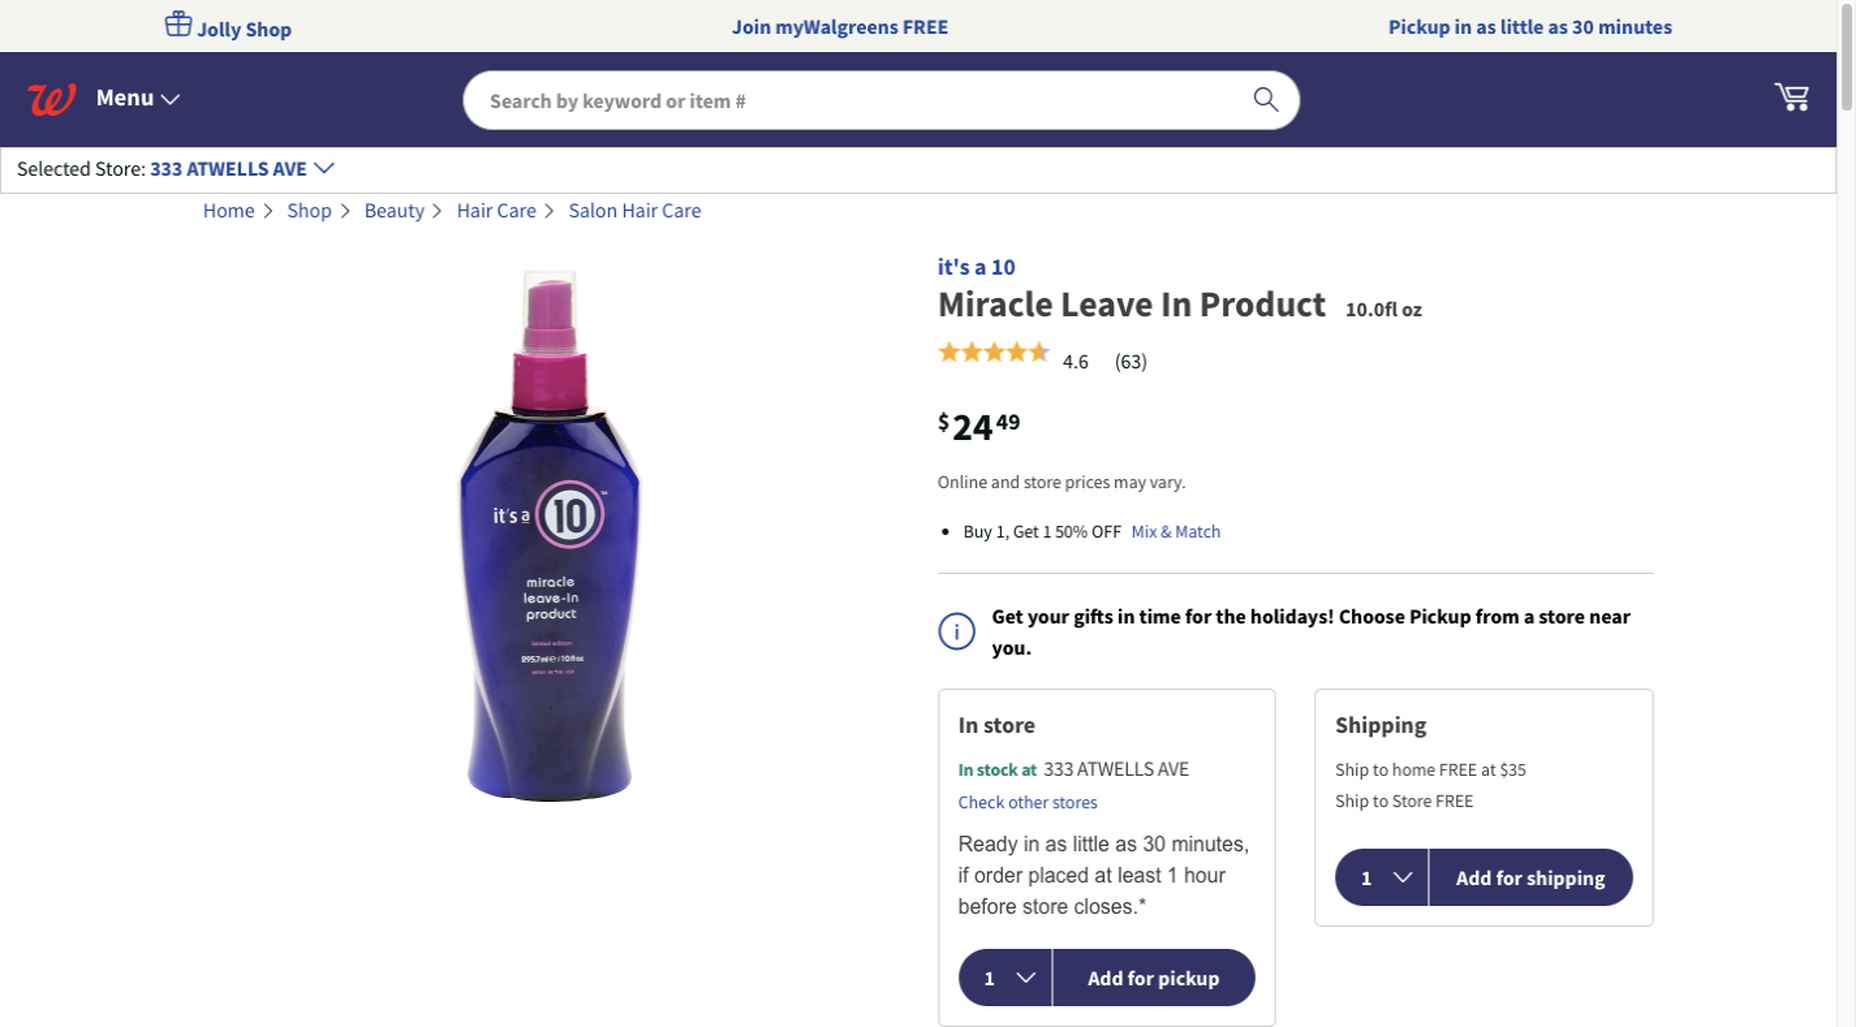
Everything shoppers usually need to know is presented above-the-fold. They can easily proceed to the next step or scroll down for reviews or additional product specifications. 

BePestControl’s pre-built website uses a similar product design approach: 

In this example, the main selling points are up-front and are kept short and sweet. The shopper can either hit the ‘Add to Cart’ button or look below the button for additional information.

In both examples, a visitor doesn’t have to mull over what step to take next since one of the design objectives is to make the shopping experience as easy and as satisfying as possible.

4. Take Advantage of the Benefits of User-Controlled Video Content

Once upon a time, video content was “the thing” to incorporate in a website. Hero background videos proved to be particularly engaging, and “how-to” videos presented much more useful information than illustrations or blocks of text could.

On the other hand, Auto-play videos, those that started on their own, all too often had a tendency to irritate rather than inform, especially when their content didn’t address a visitor’s immediate concern.

Thanks to Zoom and similar video platforms that came into widespread use in 2020 and to website designs that include video “Play” buttons, users have become much more comfortable with the medium. As an example, Shoppers have been given total control over if or when they want to view a given video. 

This is the design approach Payoneer has taken: 

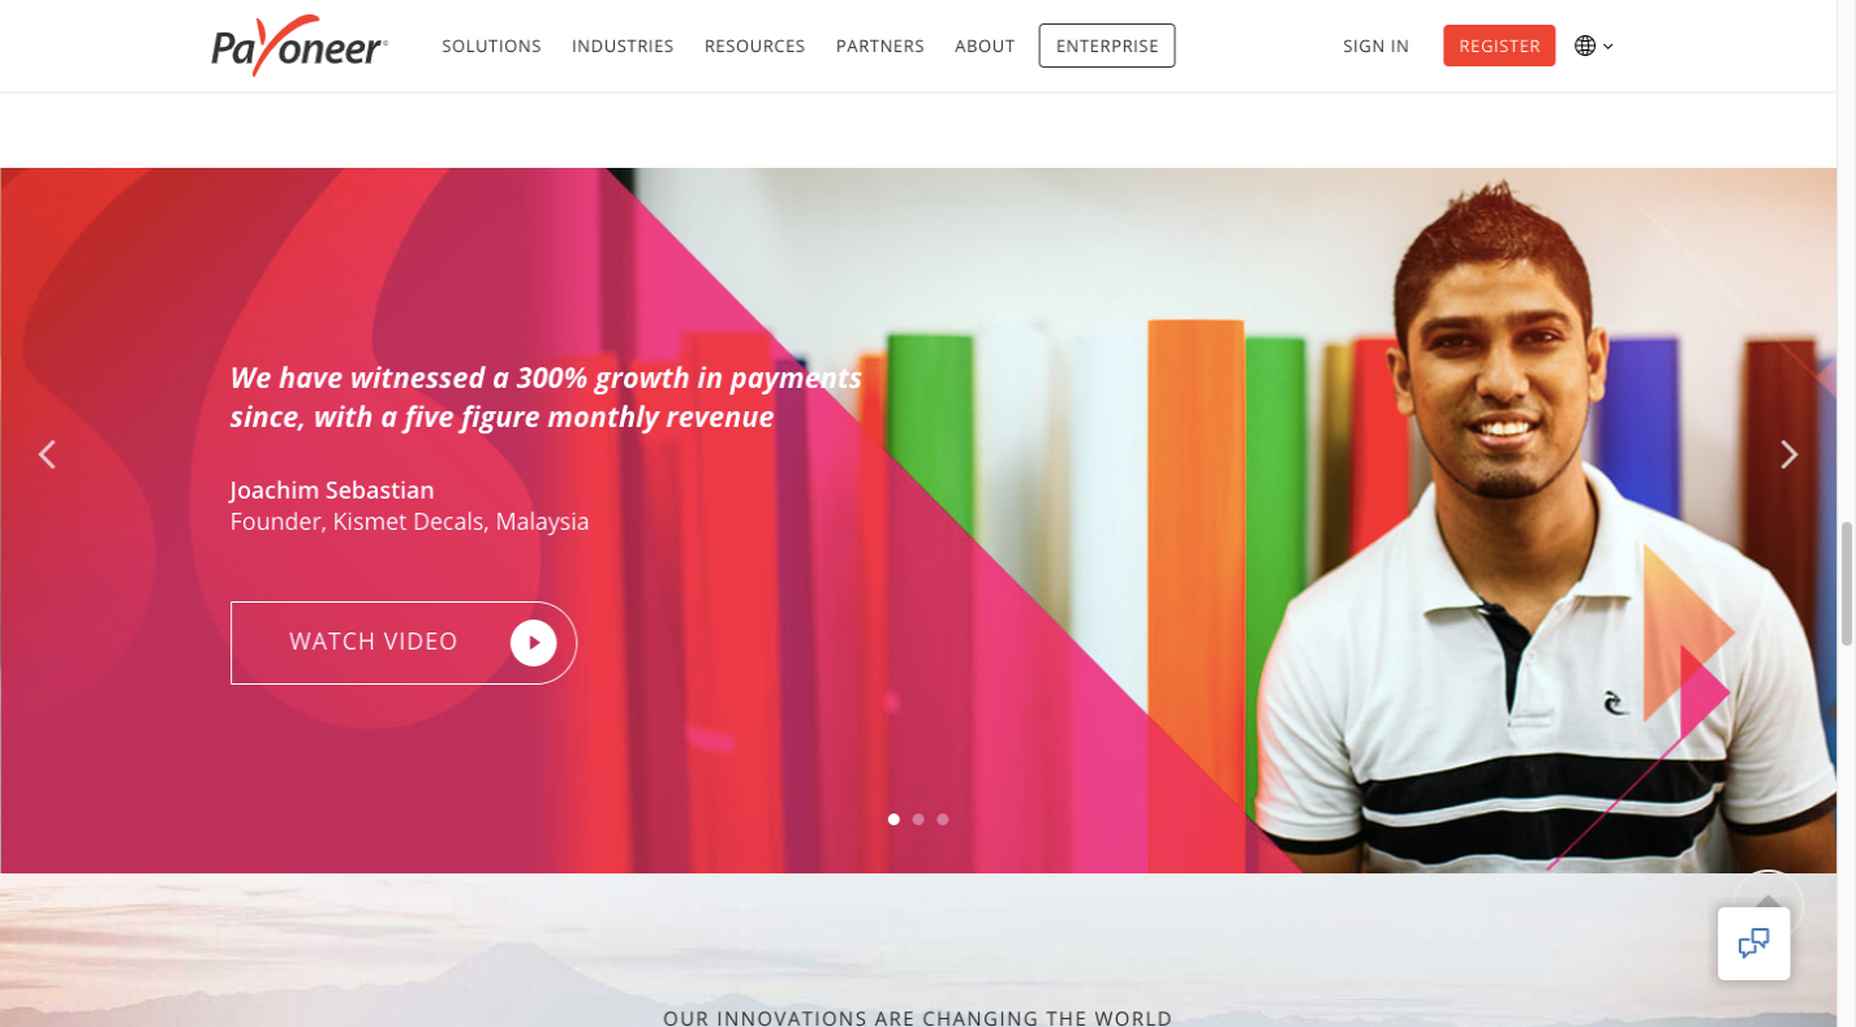
The white “Pay” button is impossible to miss, and while it is designed to encourage a visitor to watch a testimonial, doing so is completely optional.

The BeOptics pre-built website cleverly slips in a video play option as well: 

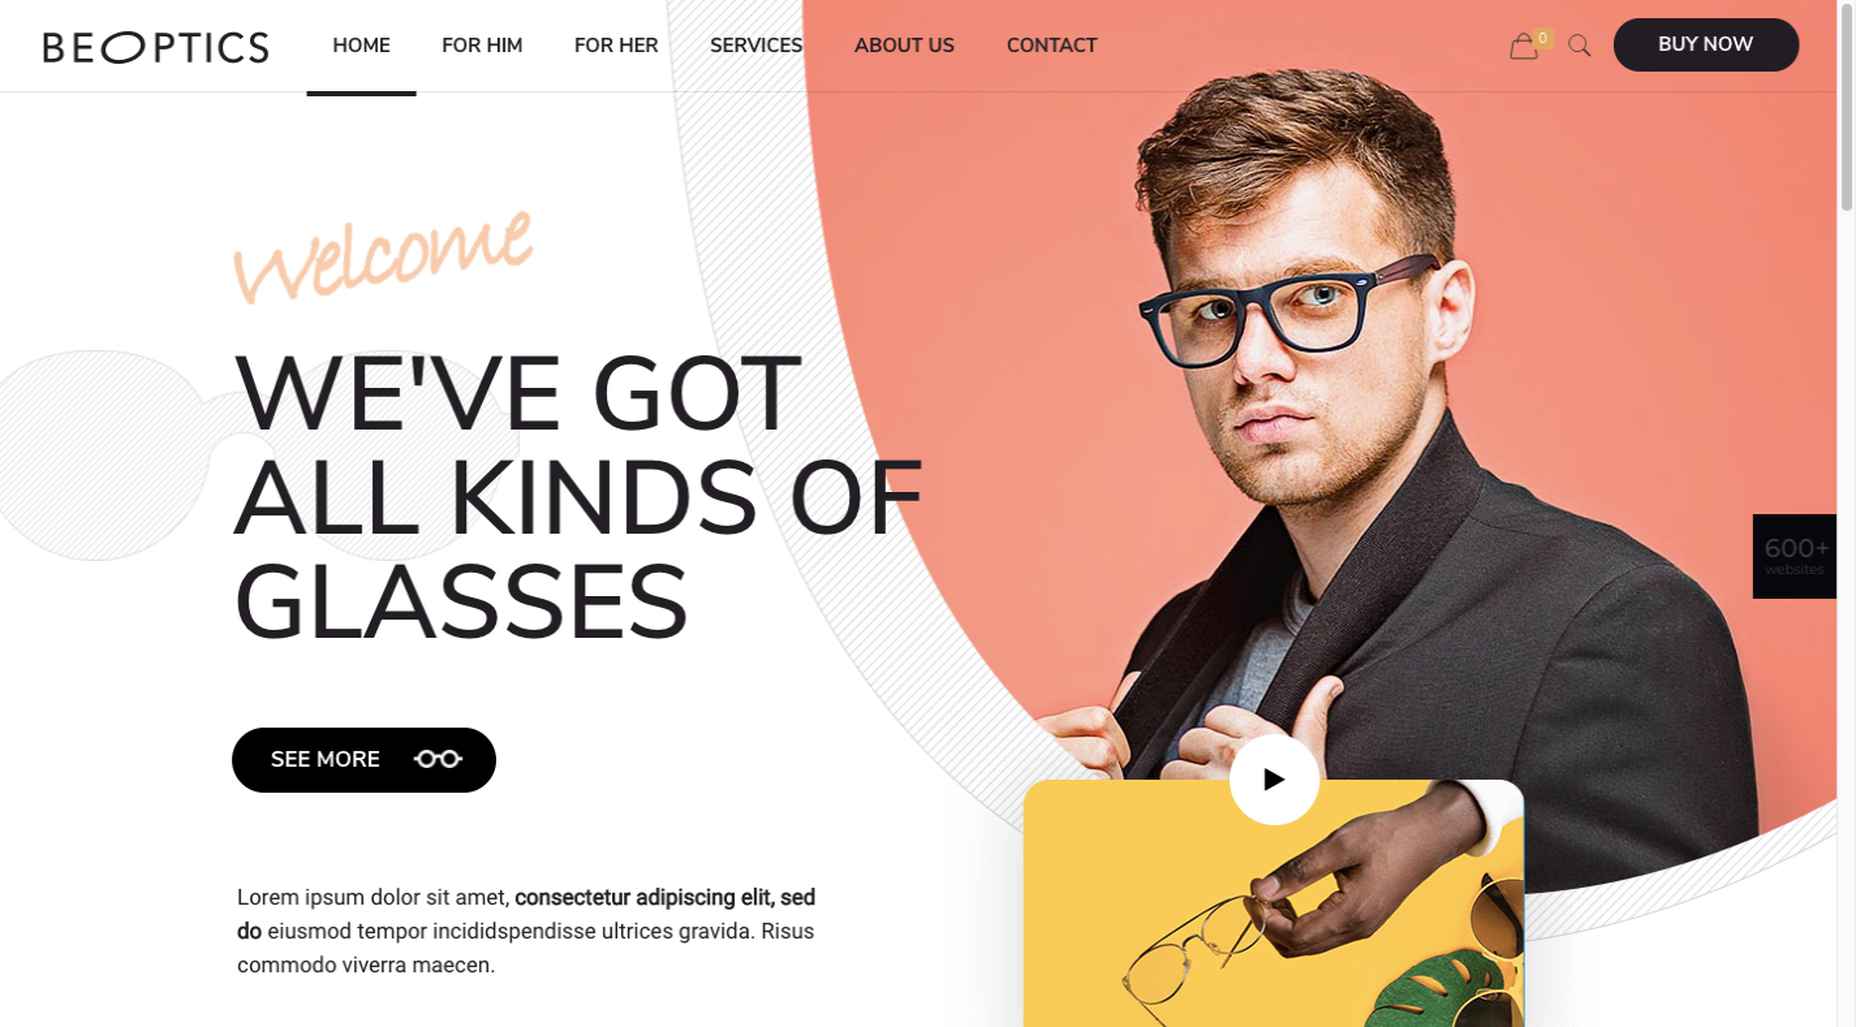
In this example, when visitors hover over the “See More” button, it lets them know that they have the option to watch the video if they want to learn more.

5. Trust Builders Should be Non-Negotiable Web Design Elements

There are various ways in which products are organized or showcased in brick and mortar businesses to instill trust. Helpful and friendly staff also contribute to instilling trust.

Some of these trust-builders are easily incorporated into eCommerce designs. Others, though more difficult to fit in, can usually be satisfactorily addressed.

Digital trust builders can include.

  • Logos (familiar, whimsical, innovative, engaging)
  • Portfolios and/or product pages
  • Customer reviews, product ratings, and client testimonials
  • Case studies and product or price comparisons
  • Safety and security seals, e.g., Better Business Bureau, PayPal checkout
  • Charts, graphs, counters, and other data visualization techniques
  • Proof of social, charitable, or community-related actions and contributions

Put, trust-building content will beat hard-sell techniques every time, especially if you would like your customer base to include referred and repeat customers.

Omaze, for example, gives people entries for prizes based on their donations while at the same time highlighting the good things it and its donors have brought about.

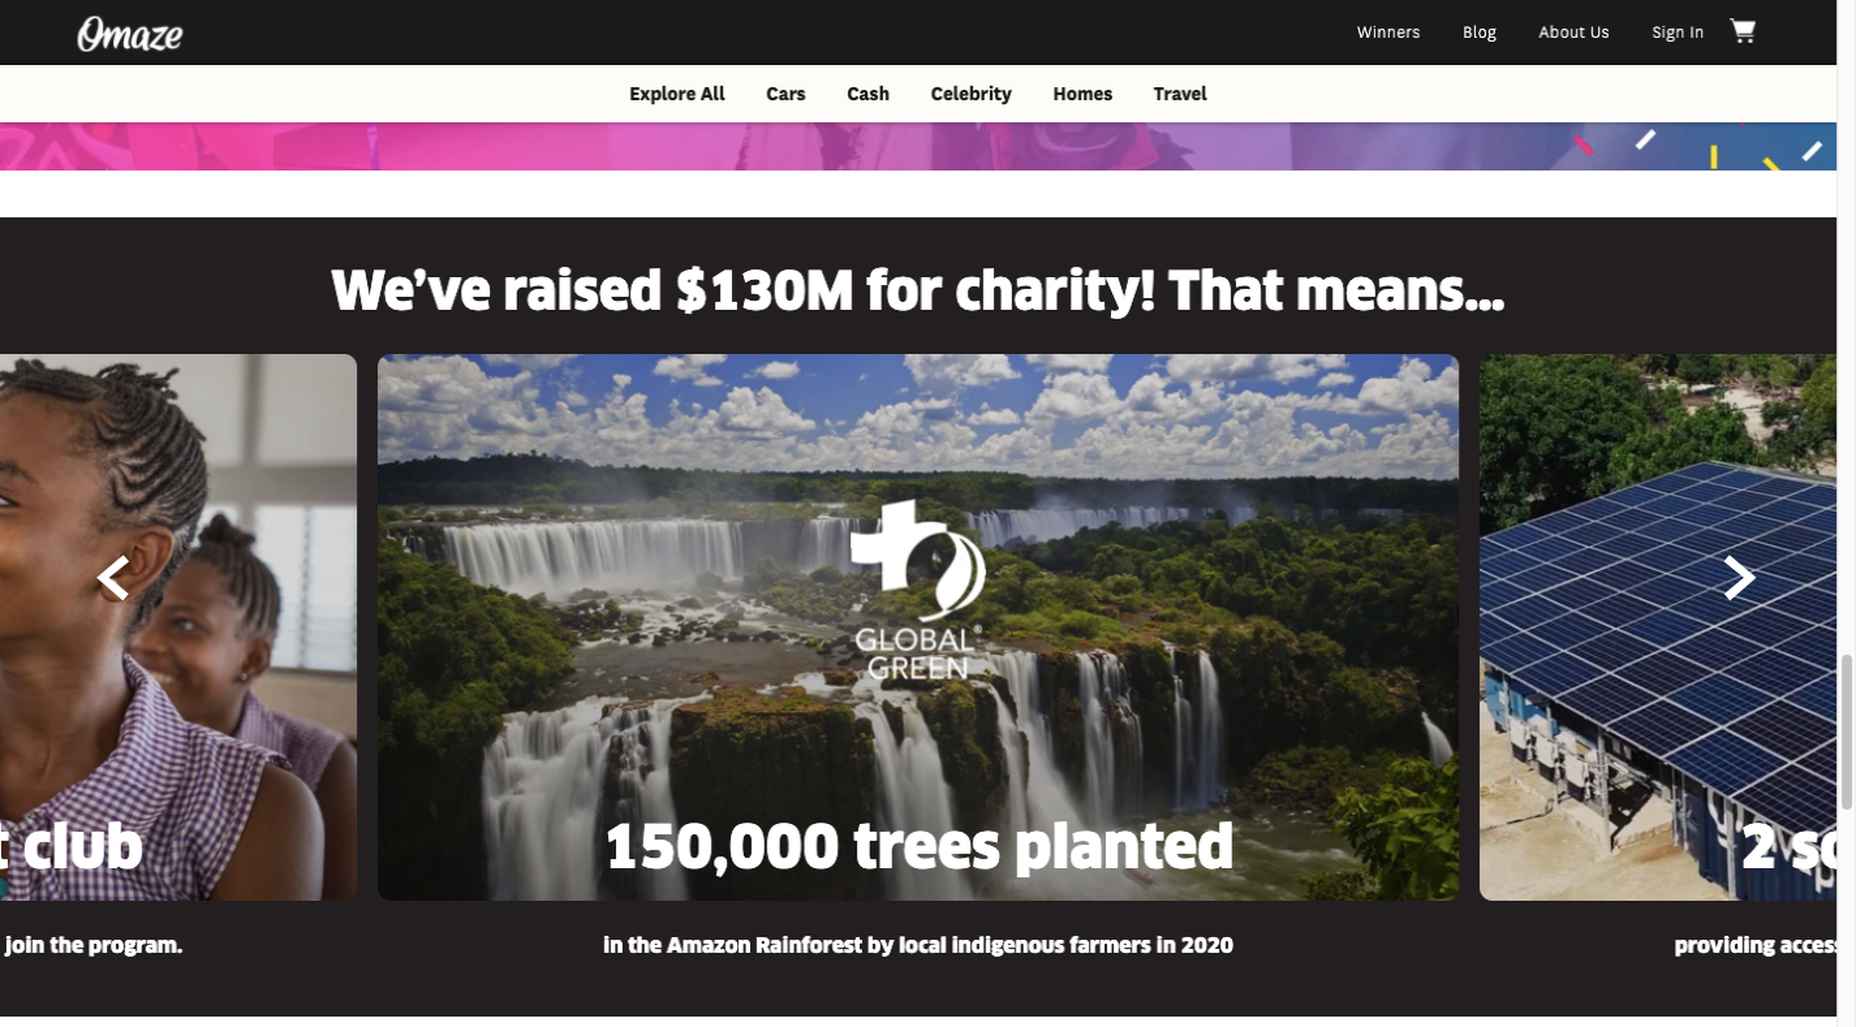
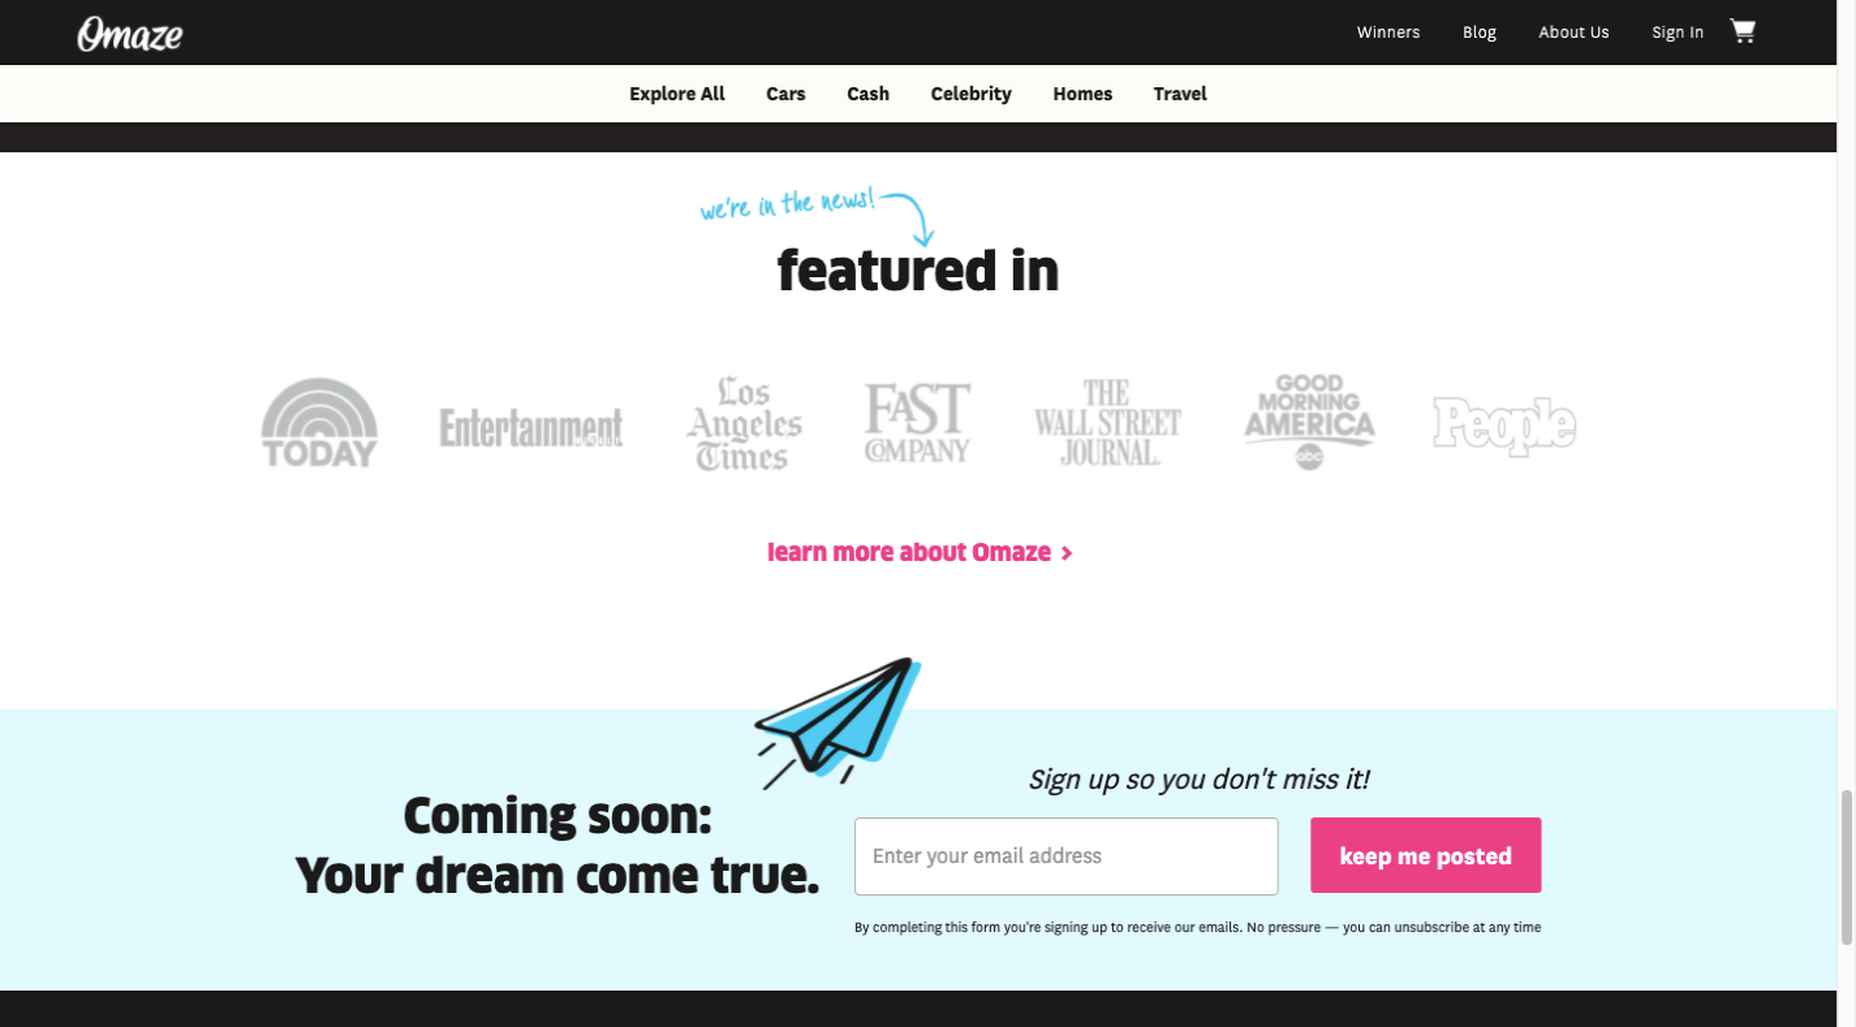
To help build trust, the site devotes space to highlighting publications that have featured Omaze and the work it has done and is doing.

Plus, it puts data visualization and non-profit testimonials into play to give visitors an added insight into what is going on behind the scenes: 

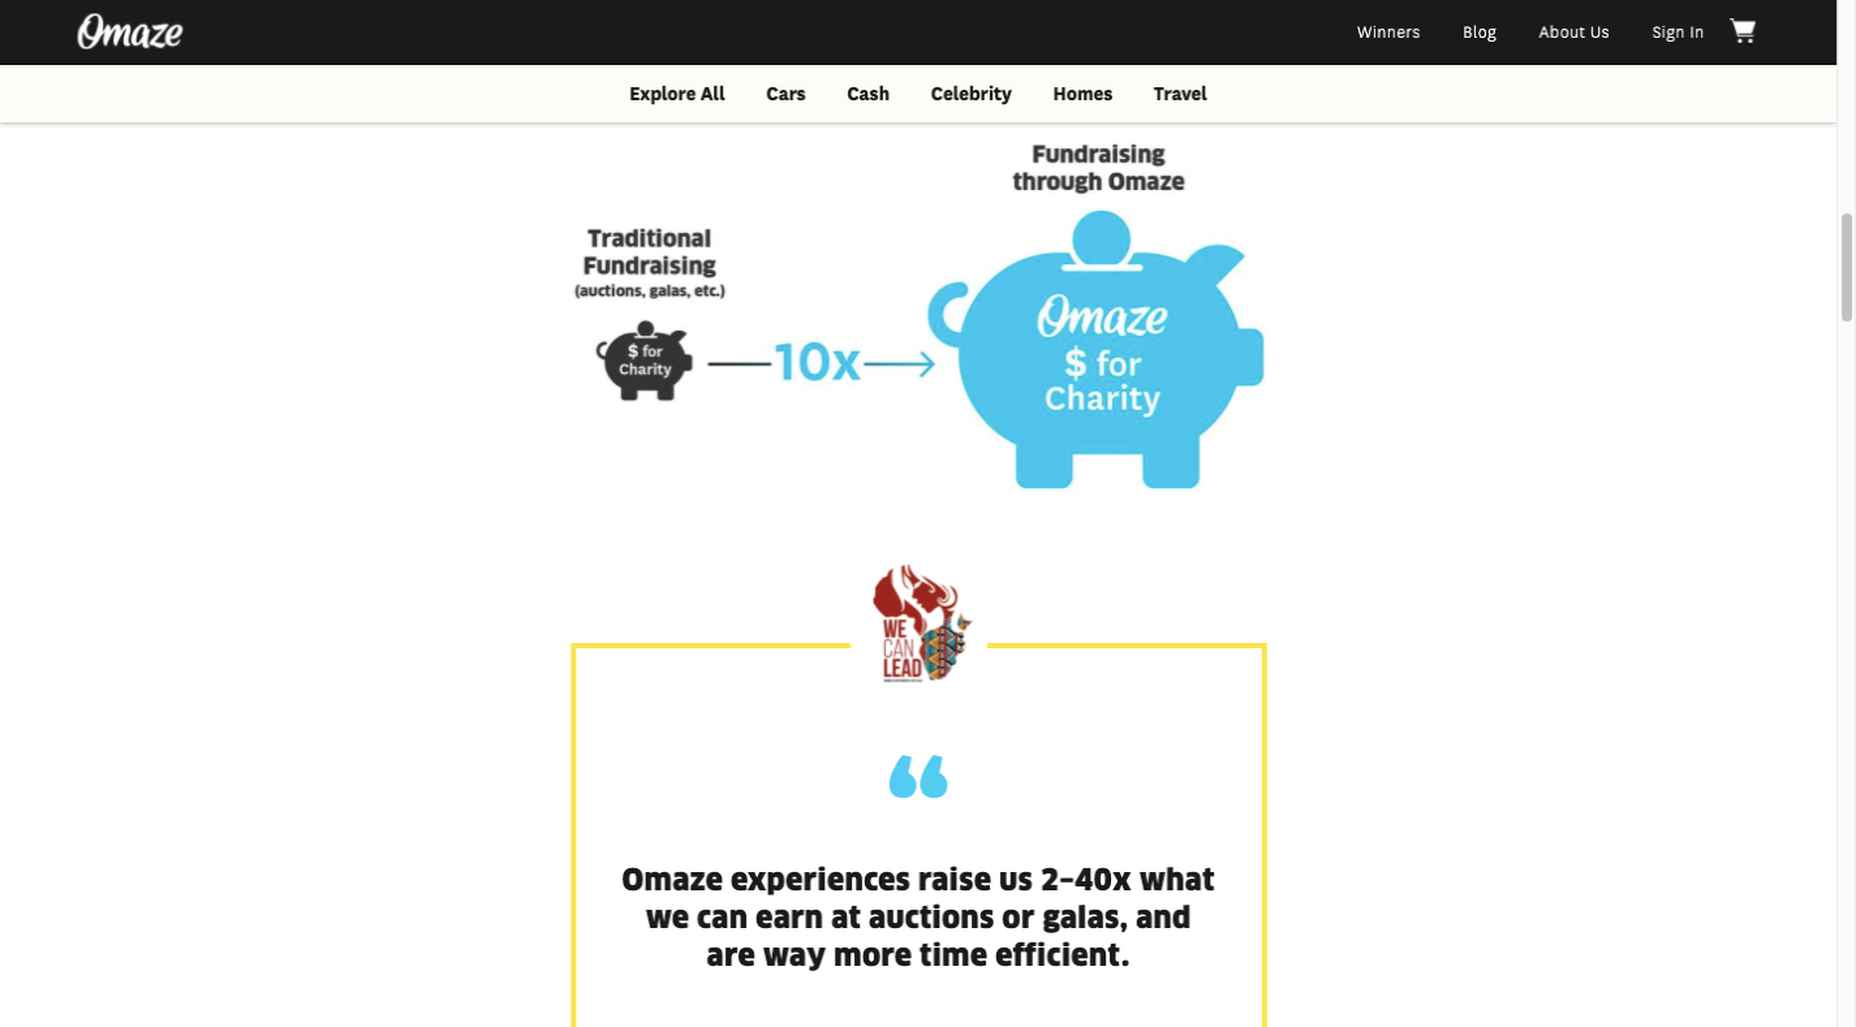
As you can see, it doesn’t have to be difficult to incorporate genuine trust-building content into your website designs.

BePortfolio is a great example of how you might go about doing this for a portfolio site, whether it’s your own or a site for a client:

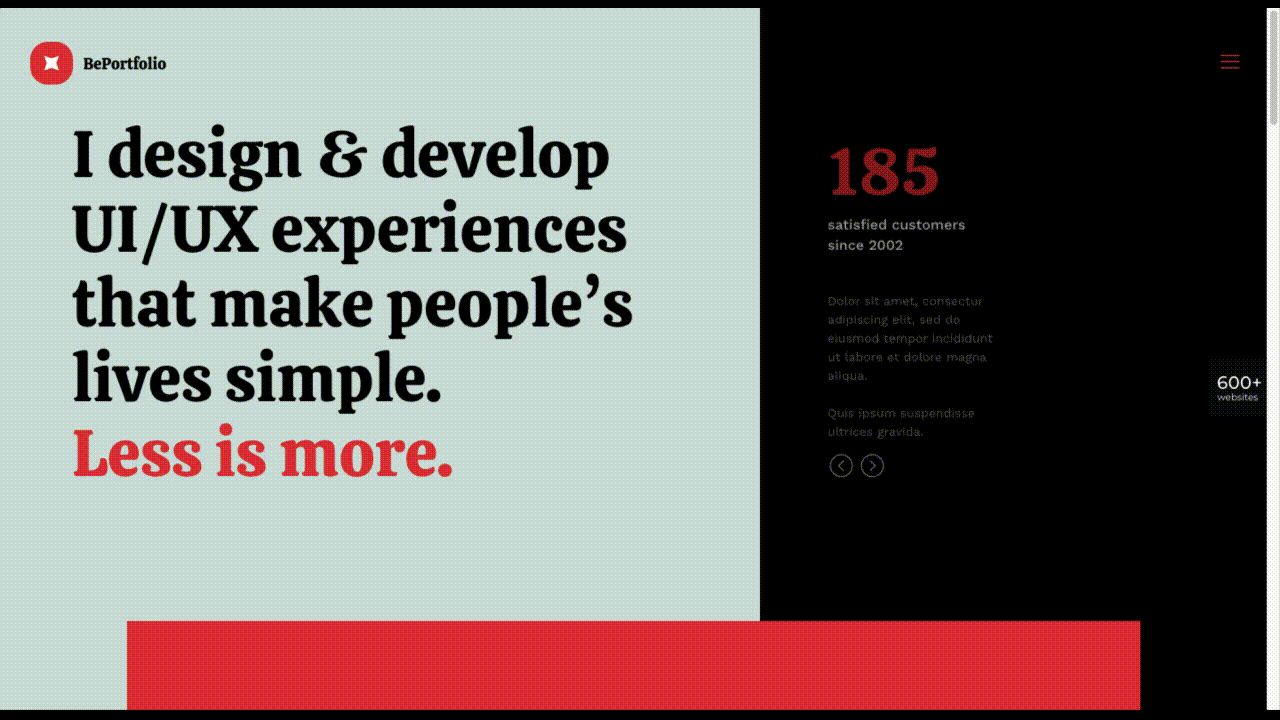
The home page alone has plenty of space for including trust-building content:

  • A satisfied customer counter
  • Product usage case studies and testimonial
  • Portfolio highlights
  • Client and partnership logos

And it can only get better as a visitor moves through the site, but only if you’ve chosen to make that happen.

Have You Started to Take These New Web Design Trends to Heart?

We’re not suggesting that you throw the baby out with the bathwater, but some trends will need to be discarded to enable you to adjust to a new normal. Other 2020 design trends, like minimalism and headline topography, are likely to remain popular for years to come.

New trends that incorporate calming color palettes, image blending, more efficient eCommerce UX designs, user-controlled video, and trust-building elements should give your customers the feeling of comfort and security they will be seeking in 2021.

If you want to implement some or all of these new trends in your 2021 website designs, BeTheme’s 600+ pre-built sites make doing so an easy task.


[– This is a sponsored post on behalf of BeTheme –]

Source

The post 5 Web Design Trends and Ideas for 2021 first appeared on Webdesigner Depot.


Source de l’article sur Webdesignerdepot

A data scientist extracts manipulate and generate insights from humongous data. To leverage the power of data science, data scientists apply statistics, programming languages, data visualization, databases, etc.

So, when we observe the required skills for a data scientist in any job description, we understand that data science is mainly associated with Python, SQL, and R. The common skills and knowledge expected from a data scientist in the data science industry includes – Probability, Statistics, Calculus, Algebra, Programming, data visualization, machine learning, deep learning, and cloud computing. Also, they expect non-technical skills like business acumen, communication, and intellectual curiosity.

Source de l’article sur DZONE


Data visualization with Angular

Data visualization is a visual representation of quantitative information in the form of charts, graphs, plots, and so on. There are so many libraries and frameworks available to visualize data, but the one that we are going to talk about in this article is ngx-charts.

Ngx-charts is a charting framework for Angular which wraps the D3 JavaScript library and uses Angular to render and animate SVG elements. It is one of the most popular frameworks for Angular application development because it makes it so much easier to render charts and provides other possibilities that the Angular platform offers such as AoT, Universal, etc.

Source de l’article sur DZONE

In another post, we discussed the use of ROC curves to describe the goodness of a classifier. I did say that I would post a brief paragraph on the interpretation of the diagonal. If you look around, some say that it describes the "strategy of randomly guessing a class", that it is obtained with "a diagnostic test that is no better than chance level," even obtained by "making a prediction by tossing of an unbiased coin."

Let us get back to ROC curves to illustrate those points. Consider a very simple dataset with 10 observations (that is not linearly separable):

Source de l’article sur DZONE