Articles

Ask any seasoned web app developer about their choice of programming language, and they are sure to mention PHP. PHP is a widely-used general-purpose scripting language that is especially suited for Web development and can be embedded into HTML. As per Builtwith, 3,090,319 live websites are still using PHP. However, when it comes to developing massive projects without lag or stability issues, developers tend to use frameworks, and PHP has two remarkable frameworks: 1) Laravel and 2) Yii. Both frameworks have a lot of followers in terms of full-grown communities globally, and there may be questions arising about which to choose.

What Are Laravel and Yii?

Laravel is a simple PHP framework frequently used for web-based or web application development initially created as a better alternative to Codeigniter. It is known for MVC Support, articulated ORM systems, reliability, modularity, and uncomplicated coding rules. Some of the key features of Laravel Framework are:

Source de l’article sur DZONE

Given CockroachDB scales with vCPU, there’s a hard limit to how many active connections we can support per vCPU before a serious problem arises. PGBouncer stretches the limits a bit making it a cost-effective option. In serverless architectures, there is no client-side connection pooling, and using middleware like PGBouncer can alleviate the problem of connection storms. Please see my previous articles on the topic for more details.


Previous Articles

  1. Using PGBouncer with CockroachDB
  2. Using PGBouncer with Cockroach Cloud Free Tier
  3. Exploring PGBouncer auth_type(s) with CockroachDB

Motivation

We’ve covered how to deploy PGBouncer with a self-hosted CockroachDB cluster. Today, I’m going to demonstrate how to run PGBouncer along with the Cockroach Cloud free-forever tier database. The overall concepts are identical, but we will highlight some of the major differences in deploying PGBouncer with a cloud product.

Source de l’article sur DZONE

User Experience (UX) design and User Interface (UI) design are two terms people sometimes mistakenly use interchangeably. While aspects of each are interconnected, there are distinct differences between UI/UX design.

According to Internet Live Stats, there are over 1.9 billion websites, but not all are active at the same time. No matter how you slice it, there’s a lot of competition to grab and keep user attention. Good UX is just part of the equation. For a genuinely stellar site, you must also offer an excellent interface.

Learning the ins and outs of good UI and UX requires a bit of knowledge of how the two differ and what works. Although they weave in and out of the same design, they are different.

What Is the Biggest Difference Between Good UX and UI?

UI is the functionality of the design and what users see. How do they interact with various elements? UX is more the way things come together — both visual and interactive features — to create a feel for the user. You can certainly see why people confuse the two as they both apply to interacting with a website or app.

Top design firms often have team members specializing in each discipline. However, UX designers are also aware of UI, and UI designers are also mindful of UX. How can you ensure you’re offering excellent UI/UX design while covering the full spectrum of requirements for each?

Ensuring Effective UX Design

Good UX design increases conversion rates by 400% or more. The site visitor walks away feeling understood and not frustrated. What are some of the most important aspects of good UX design?

1. Create a Good Structure

What is the hierarchy of your site? What is the first thing the user sees when they pull it up? How do they navigate from one page to the next? A well-designed website classifies different aspects of the page, and new content naturally falls into the appropriate category as it grows.

When creating a structure for your site, think about how it might expand in the next five years. You want the hierarchy to work from day one, but you also want to think through significant shifts in the content you might see down the road.

Even your navigational hierarchy should accommodate new areas easily. Plan for the unexpected, so you know how to work it into the overall design when you must.

2. Choose Beautiful Aesthetics

You have a few seconds to make an excellent impression on your site visitors. Take the time to make sure your design functions and is visually appealing. Your color palette should work, images should be crisp and relevant, and typography should be readable and engaging.

Step back from your computer and look at your design from a distance. Does anything stand out that isn’t pleasing to the eye? Get feedback from visitors about what they like and dislike. Since the focus is on user experience, your best source of constructive criticism is from your target audience. Listen to their concerns and ideas.

3. Communicate With Site Visitors

Most experts agree that users want an element of interactivity on sites and apps. People want to know you hear them and get a response. Some ideas include adding a live chat option to your site or engaging in SMS customer support.

Put yourself in their shoes. A customer may visit your site for the first time, having never heard of your brand. They have no reason to trust you or that you’ll follow through on your promises. Potential leads may have a few questions before parting with their hard-earned dollars.

Adding various ways to communicate shows them you’ll be there should they have a problem. It’s much easier to trust a company when you know you can phone, engage in live chat or shoot off an email and get an almost immediate response.

4. Add Clear Direction

Excellent UX is intuitive. You should add calls to action (CTAs) and images pointing the user where they should go next. You can use graphics of arrows, people looking or pointing toward the next step, words, or CTA buttons.

Get feedback on how clear the directions are and tweak them as needed. The user should never have to stop and ponder what to do next. Everything on the page should guide them toward the ultimate goal.

5. Break Down Complex Data

Every industry has complicated data that is difficult for non-experts to understand. Part of good UX is breaking down complex information and sharing it in a simplified way.

One example might be the registration process. Instead of just showing text, a good UX designer would number the steps. Visualizations help add to understanding.

Embracing Effective UI Design

User Interface impacts UX and involves how the design works. The UI designer thinks through visitor expectations and then creates an interface that isn’t frustrating. UI works within the framework of a website to develop functional features. User experience isn’t the complete focus of UI, but it does tie into the planning phases. What are some elements of good UI design?

1. Set Standards

For a design to have good UI, it must perform as expected. Have you ever clicked on a button, and nothing happened? Determine how you want things to work and the minimum acceptable standards for your site.

For example, what happens when someone clicks on a link or button? How does the user know their action created the expected result? Consistency is crucial to how a site performs.

2. Choose the Right Colors

While UX designers look at the emotional impact of various colors, UI designers look at whether the shades match branding and how well the different ones contrast for readability and usability. UI/UX design often bridges a single designer’s work, so the employee ensures everything works as intended, both emotionally and functionally.

You may work with another designer to make the site aesthetically pleasing while also tapping into the emotions driving users. For example, some people love blue, so a blue button can have positive results.

UX and UI designers utilize split testing to see which users respond best to. Then, make adjustments as indicated by how site visitors respond.

3. Focus on Cognitive Matters

According to the Interaction Design Foundation, people can only retain around five things in their short-term memory. Designers should work with recognition instead, as users tend to rely on cues to find what they need.

UI designers may develop an intuitive navigation system and then use the same cues on every page, such as placement, color, and language. Users can then recognize the system without having to memorize it.

4. Prevent Errors

Your job is to ensure errors are kept to a minimum when designing a website or app. One of the most significant parts of a designer’s job is testing and retesting.

Think about all the potential problems a user might run into, such as broken links, images not showing, or incomplete actions. How can you keep those problems from occurring in the first place?

Error prevention is particularly vital when designing software as a service (SaaS) or apps. Users grow frustrated quickly and will find another solution rather than troubleshooting an issue. You’re much better off avoiding the error in the first place.

How Do UX and UI Work Together?

You’ve likely already figured out how closely UX and UI entwine to create a usable experience. The UX designer pays attention to function and interactivity, and the UI designer thinks through how the interface looks.

UX pays attention to the flow of the website and where users start, go next and end up. On the other end, UI figures out how the elements look to the viewer and where everything is placed.

The UX team may decide to add an extra button to the page. The UI team must determine where to place it, if any sizing needs must occur, and how it impacts usability on desktop and mobile devices.

Although each has a different function, user experience and user interface must work together to create a usable site the target audience responds to. You can’t have excellent UX without excellent UI, and vice versa. The best designers consider both and implement them to their fullest potential.


Featured image via Pexels.

Source

The post What’s the Difference Between Good UI and Good UX? first appeared on Webdesigner Depot.

Source de l’article sur Webdesignerdepot

Maps are a fascinating method for delivering content. At their best, they can create an intuitive way of presenting information and interacting with it. This is the advantage that digital maps, through mobile apps and websites, have over print maps and images where no interactivity is possible.

But it’s important to understand that more data ≠ better experiences. We all now have so much data available to us through multiple services that, arguably, the greatest challenge isn’t sourcing information but filtering it out. We can only handle so much information input before we become overloaded. This issue risks being omnipresent with maps. There are so many potential points of interest on a map that it’s essential to be clear about what needs to be exposed to users.

Also, UX design, map design, and user interface are all critical. While maps can be a powerful way of drawing people in, if end-users feel that you didn’t even consider the visual design, they’ll ‘bounce off’ your site or app in moments.

Common Use Cases

When are maps useful, and what problems do they solve? Let’s dive right into the most common use cases for maps used in web design.

Navigation and Direction

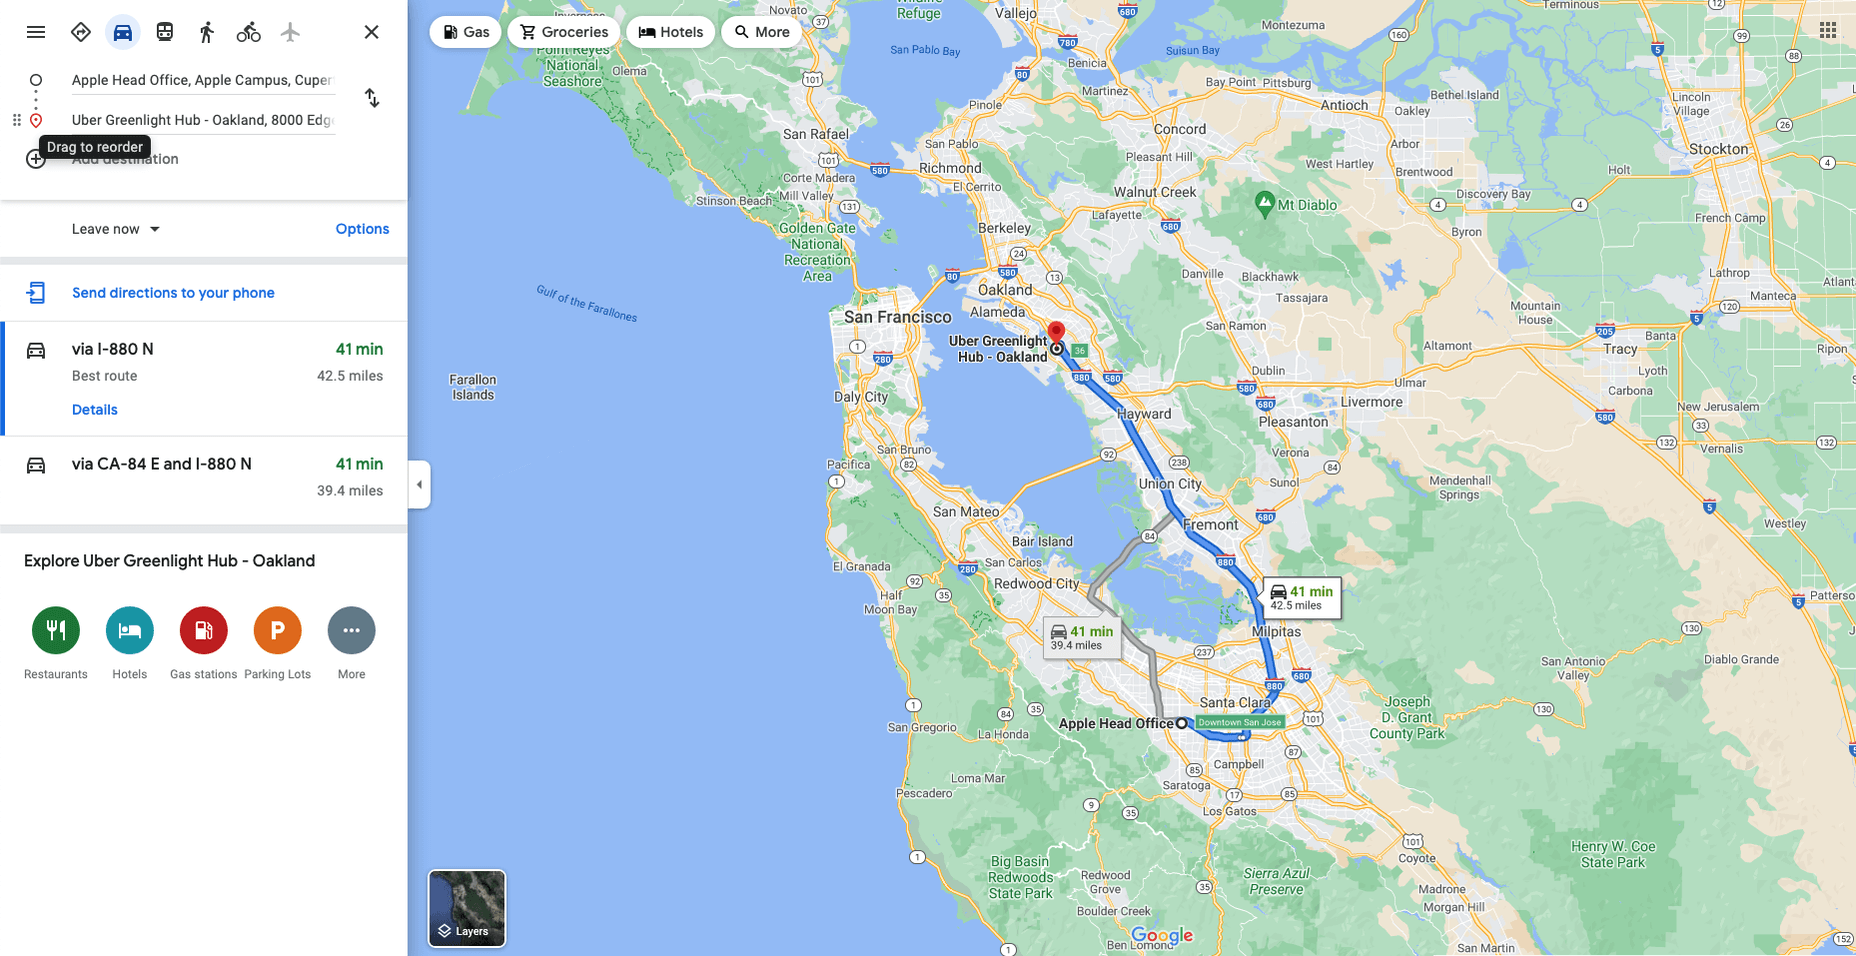
Like Google Maps shows, navigation and direction are arguably the classic case study for interactive maps. You are in one place and need to get to another. You can enter your destination, your current location, and the map will present suggestions for getting there. You can select the method of travel and adjust desired departure or arrival times. But you need to understand first what functionality your users need. How these options are exposed to users is a critical piece of UX design.

Also, if users are searching for options such as somewhere to eat, it’s not so straightforward. Then, how your map handles panning in real-time as users swipe around a city is going to be a big issue.
Showing Relationships and Trends Geographically

This is something that you’ll see in every election in any western country. We’re all used to seeing maps that give us a state-of-play for which state or seat is held by which party. Then, we might see projections based on voter intentions and projected voting swings deriving from that. Then, exit poll data can be projected with the map updated on an ongoing basis until the final result is confirmed.

The capability to do this is essential because if a static map were used, it’d be out of date any time a new poll was released. Also, voting intentions can change over a campaign, so such maps need to be dynamic. Of course, such maps are only as accurate as the available data, as the US 2016 election map showed.

Show Points of Interest

As mentioned previously, there’s a lot of data that can be exposed to map users. However, that doesn’t automatically mean that it should be. Usability is key. For example, when you look at a map, you’ll typically first see key points of interest. Which points of interest are going to be presented to you can vary.

One variant is zoom level. If your map is currently showing an entire city, the level of detail the map presents is deliberately limited. You’ll see districts, large roads, or geographic features such as rivers. If more detailed information were presented, users on mobile devices, in particular, would be overwhelmed. Even at this level, you’ll notice typography differences. These can include the city name being in bold or the names of different areas in capital letters. So the level of detail is coupled with the scale of the map. Zooming in a few notches will expose significant points of interest, such as museums. Zooming in to specific districts will reveal restaurants, coffee shops, and universities. This visual hierarchy is a critical way of managing the exposed level of information.

But information is still being abstracted away. It’s not until you tap on the museum that you’ll see information on opening hours and busy times. This is also typically presented with user photos and reviews. Context is also taken into account, so you’ll start to see local hotels and restaurants. So it’s not just individual points of interest that are important, but the connections between them.

6 Tips For Improving Interactive Maps

What are the challenges of creating effective maps, and how do people address the data overload problem? We’ll answer this question and go over the must-know aspects of map creation.

1. Ensure Security and Brand Trust

GDPR or General Data Protection Regulation. This is a critically important European law that extends a wide range of legal protection to European citizens regarding personal data. It’s not possible here to cover the full extent of the law, but here are some quick key points:

  • Consent is required for the processing of personal data; it cannot be assumed
  • You need to have a retention policy for information that’s capable of identifying people

Be aware that the latter doesn’t just cover commercial purposes. Research students have to submit GDPR forms that address what kind of data they’re sourcing and how they’ll be retaining it.

But the most crucial context is commercial. If a business suffers a data breach, it can be fined up to 20 million euros or 4% of annual worldwide turnover in the preceding financial year, whichever is greater. Therefore, any business storing data that could identify their customers will need to assess risk and compliance. Remember: it’s 4% of worldwide turnover, not EU turnover.

Also, anything of your business that you expose to your customers or users is an extension of your brand. Therefore, you need to assess your maps for brand compliance too. If you have primary brand colors and your map doesn’t abide by them, that’s a very poor look. Source the color hex codes directly from your brand team and involve them in design.

2. Use the Appropriate Type of Map

It’s also important to consider what type of map is most appropriate for your use case. Think carefully about what your users need, what you’re trying to communicate, what information you need to present, and how best to present it.

For example, points of interest style maps in a tourist app will be way more helpful than heat maps: people want to know where something is, key data like opening hours, and how to get there. A heat map showing the number of visitors to each attraction or area of a city is unlikely to be useful to tourists. However, it could be useful to the attractions themselves to map their visitors by heat map over time. This could help larger museums chart which exhibits are most popular.

Transport for London is charting passenger movement on the London Underground by detecting when a device with Wi-Fi comes into range and then passes out of range. They’re using this to understand overall user journeys and movements within individual stations to better manage disruptions.

3. Avoid Pop-Ups

It should go without saying by now that auto pop-ups are despised. It doesn’t matter what they’re doing or what they’re offering; an unwanted pop-up can only get in the way. The level of impact is even greater on a phone where pop-ups take up even more screen space.

Given this, many users close them without even reading them. So if you’re using pop-ups, don’t kid yourself. You’re likely just irritating users and increasing the likelihood that they’ll ‘bounce off’ or uninstall.

4. Avoid Auto-Geolocation

Auto-geolocation sounds incredibly convenient but can result in some real problems. For example, if there are any bugs with auto-geolocation, you could get false results. If someone connects through public building Wi-Fi, you could get false results. If they’re connecting through a VPN then, unless you get the user’s IP address and check if it’s the exit portal of a VPN, you could get false results.

The problem is most significant with mobile maps. If a map user is looking at a points of interest map, they likely have a specific and immediate use. This means it’s in their best to get the most accurate results possible. So why not just ask them?

Precision and Accuracy

These terms have specific meanings in geolocation. ‘Precision’ is the exactness of the data. ‘Accuracy’ is how closely the information on a map matches the real world. So you want precision and accuracy to be spot on, or data risks losing value. This applies not just to the gathering of data but to the representation of it. For example, if you have street-level data but your maps don’t present individual streets, then any representation of data on that map is likely to have poor accuracy. That map might succeed in abstracting irrelevant information but presenting an imprecise and inaccurate view.

5. Avoid Map Legends as Much as Possible

In many cases, primarily points-of-interest maps, they’re just not needed anymore. An essential part of user experience design isn’t just visual hierarchy but information hierarchy. You can mouse over on a desktop or laptop to get the essentials of a location, e.g., the museum’s name and its opening hours. On a mobile device, you can tap on that location to get the essentials, and you can tap on another location to move on; you don’t even have to press back. Given that, a legend would get in the way. So this simple piece of information design solves information overload issues.

As with all rules, there are exceptions. A good one is a heat map where a density of what’s being measured needs to be communicated. It doesn’t matter what the data is; it just needs to be something where mapping provides greater insight, especially if it informs decision-making. Sales is an excellent example for a national or multinational company. Of course, weather forecasting can make use of literal heat maps.

6. Accessibility Compliance

Not everyone has perfect eyesight. Even if someone has excellent vision, they could still be colorblind (8% of men and 0.5% of women are). Given that, take the W3C’s accessibility standards into account and treat them as a baseline or minimum barrier to entry for compliance. You shouldn’t feel good about the possibility of excluding 8% of your potential audience or customers. Ensure you keep your UX designers involved and don’t shy away from creating senior-friendly web designs.

Put simply: imagine if you could appeal to a new demographic that’s not catered to. If your competitors ignore them, you could give them a real reason to choose you instead by taking some straightforward steps. If your competitors are catering to them, you also need to. If you don’t, you’re just giving potential customers a big reason to ignore you.

Conclusions

The key takeaway is that there’s far more to creating good maps than just good cartography. That can be critical, too, though this may vary depending on the use case.

This will be a team effort because your map will involve data sets, design decisions, and, yes, cartography. You’re going to need to involve brand and IT too. So think about design principles and development methodologies.

First and foremost, what are your users’ needs? If you haven’t done any user research or taken the time to understand the customer journey, are you adding anything or getting in the way? It’s easy to see the department that requested the map as stakeholders, but you should probably view your users as stakeholders too.

This sounds complex, but as you hopefully now appreciate, a map is probably more complicated than you thought.


Featured image via Pexels.

Source

The post The UX of Maps in Web Design first appeared on Webdesigner Depot.

Source de l’article sur Webdesignerdepot
Since the global pandemic turned up on our doorsteps, the world has noticed drastic changes. In many different ways, things have changed dramatically. Societal norms and economic challenges have impacted people in many ways after the emergence of COVID-19.     

There is no way we can sweep away the differences the time has caused and move back to the life we had in the past. 

Source de l’article sur DZONE

Gartner predicts that by 2023, over 50% of medium to large enterprises will have adopted a Low-code/No-code application as part of their platform development.
The proliferation of Low-code/No-code tooling can be partially attributed to the COVID-19 pandemic, which has put pressure on businesses around the world to rapidly implement digital solutions. However, adoption of these tools — while indeed accelerated by the pandemic — would have occurred either way.
Even before the pandemic, the largest, richest companies had already formed an oligopsony around the best tech talent and most advanced development tools. Low-Code/No-code, therefore, is an attractive solution for small and mid-sized organizations to level the playing field, and it does so by giving these smaller players the power to do more with their existing resources.
While these benefits are often realized in the short term, the long-term effect of these tools is often shockingly different. The promise of faster and cheaper delivery is the catch — or lure — inside this organizational mousetrap, whereas backlogs, vendor contracts, technical debts, and constant updates are the hammer.
So, what exactly is the No-Code trap, and how can we avoid it?

What is a No-Code Tool?

First, let’s make sure we clear up any confusion regarding naming. So far I have referred Low-Code and No-Code as if they were one term. It’s certainly easy to confuse them — even large analyst firms seem to have a hard time differentiating between the two — and in the broader context of this article, both can lead to the same set of development pitfalls.
Under the magnifying glass, however, there are lots of small details and capabilities that differentiate Low-code and No-code solutions. Most of them aren’t apparent at the UI level, leading to much of the confusion between where the two come from.
In this section, I will spend a little bit of time exploring the important differences between those two, but only to show that when it comes to the central premise of this article they are virtually equivalent.

Low-Code vs. No-Code Tools

The goal behind Low-Code is to minimize the amount of coding necessary for complex tasks through a visual interface (such as Drag ‘N’ Drop) that integrates existing blocks of code into a workflow.
Skilled professionals have the potential to work smarter and faster with Low-Code tools because repetitive coding or duplicating work is streamlined. Through this, they can spend less time on the 80% of work that builds the foundation and focuses more on optimizing the 20% that makes it different. It, therefore, takes on the role of an entry-level employee doing the grunt work for more senior developers/engineers.
No-Code has a very similar look and feel to Low-Code, but is different in one very important dimension. Where Low-Code is meant to optimize the productivity of developers or engineers that already know how to code (even if just a little), No-Code is built for business and product managers that may not know any actual programming languages. It is meant to equip non-technical workers with the tools they need to create applications without formal development training.
No-Code applications need to be self-contained and everything the No-Code vendor thinks the user may need is already built into the tool.
As a result, No-Code applications create a lot of restrictions for the long-term in exchange for quick results in the short-term. This is a great example of a ‘deliberate-prudent’ scenario in the context of the Technical Debt Quadrant, but more on this later.

Advantages of No-Code Solutions

The appeal of both Low-Code and No-Code is pretty obvious. By removing code organizations can remove those that write it — developers — because they are expensive, in short supply, and fundamentally don’t produce things quickly.
The benefits of these two forms of applications in their best forms can be pretty substantial:
  • Resources: Human Capital is becoming increasingly scarce — and therefore expensive. This can stop a lot of ambitious projects dead in their tracks. Low-Code and No-Code tools minimize the amount of specialized technical skills needed to get an application of the ground, which means things can get done more quickly and at a lower cost.
  • Low Risk/High ROISecurity processes, data integrations, and cross-platform support are all built into Low-Code and No-Code tools, meaning less risk and more time to focus on your business goals.
  • Moving to Production: Similarly, for both types of tools a single click is all it takes to send or deploy a model or application you built to production.
Looking at these advantages, it is no wonder that both Low-Code and No-Code have been taking industries by storm recently. While being distinctly different in terms of users, they serve the same goal — that is to say, faster, safer and cheaper deployment. Given these similarities, both terms will be grouped together under the ‘No-Code’ term for the rest of this article unless otherwise specified.

List of No-Code Data Tools

So far, we have covered the applications of No-Code in a very general way, but for the rest of this article, I would like to focus on data modeling. No-Code tools are prevalent in software development, but have also, in particular, started to take hold in this space, and some applications even claim to be an alternative to SQL and other querying languages (crazy, right?!). My reasons for focusing on this are two-fold: 
Firstly, there is a lot of existing analysis around this problem for software development and very little for data modeling. Secondly, this is also the area in which I have the most expertise.
Now let’s take a look at some of the vendors that provide No-Code solutions in this space. These in no way constitute a complete list and are, for the most part, not exclusively built for data modeling. 

1. No-Code Data Modeling in Power BI

Power BI was created by Microsoft and aims to provide interactive visualizations and business intelligence capabilities to all types of business users. Their simple interface is meant to allow end-users to create their own reports and dashboards through a number of features, including data mapping, transformation, and visualization through dashboards. Power BI does support some R coding capabilities for visualization, but when it comes to data modeling, it is a true No-Code tool.

2. Alteryx as a Low-Code Alternative

Alteryx is meant to make advanced analytics accessible to any data worker. To achieve this, it offers several data analytics solutions. Alteryx specializes in self-service analytics with an intuitive UI. Their offerings can be used as Extract, Transform, Load (ETL) Tools within their own framework. Alteryx allows data workers to organize their data pipelines through their custom features and SQL code blocks. As such, they are easily identified as a Low-Code solution.

3. Is Tableau a No-Code Data Modeling Solution?

Tableau is a visual analytics platform and a direct competitor to Power BI. They were recently acquired by Salesforce which is now hoping to ‘transform the way we use data to solve problems—empowering people and organizations to make the most of their data.’ It is also a pretty obvious No-Code platform that is supposed to appeal to all types of end-users. As of now, it offers fewer tools for data modeling than Power BI, but that is likely to change in the future.

4. Looker is a No-Code Alternative to SQL

Looker is a business intelligence software and big data analytics platform that promises to help you explore, analyze, and share real-time business analytics easily. Very much in line with Tableau and Power BI, it aims to make non-technical end-users proficient in a variety of data tasks such as transformation, modeling, and visualization.

You might be wondering why I am including so many BI/Visualization platforms when talking about potential alternatives to SQL. After all, these tools are only set up to address an organization’s reporting needs, which constitute only one of the use cases for data queries and SQL. This is certainly a valid point, so allow me to clarify my reasoning a bit more.

While it is true that reporting is only one of many potential uses for SQL, it is nevertheless an extremely important one. There is a good reason why there are so many No-Code BI tools in the market—to address heightening demand from enterprises around the world — and therefore, it is worth taking a closer look at their almost inevitable shortcomings.

Source de l’article sur DZONE

Illustration is a big trend in 2021. Every designer should have some ability to illustrate, whether that’s producing icons, creating lettering, mocking up layouts, or crafting full-blown illustrations.

Designers’ workflows are as varied as their work, and one designer’s favorite tool is a frustrating mess to the next designer. Most design apps have a free trial, so it’s worth trying out a few before committing.

Counting down to the best illustration app for designers in 2021, all of the apps on this list are worthy of at least a second glance:

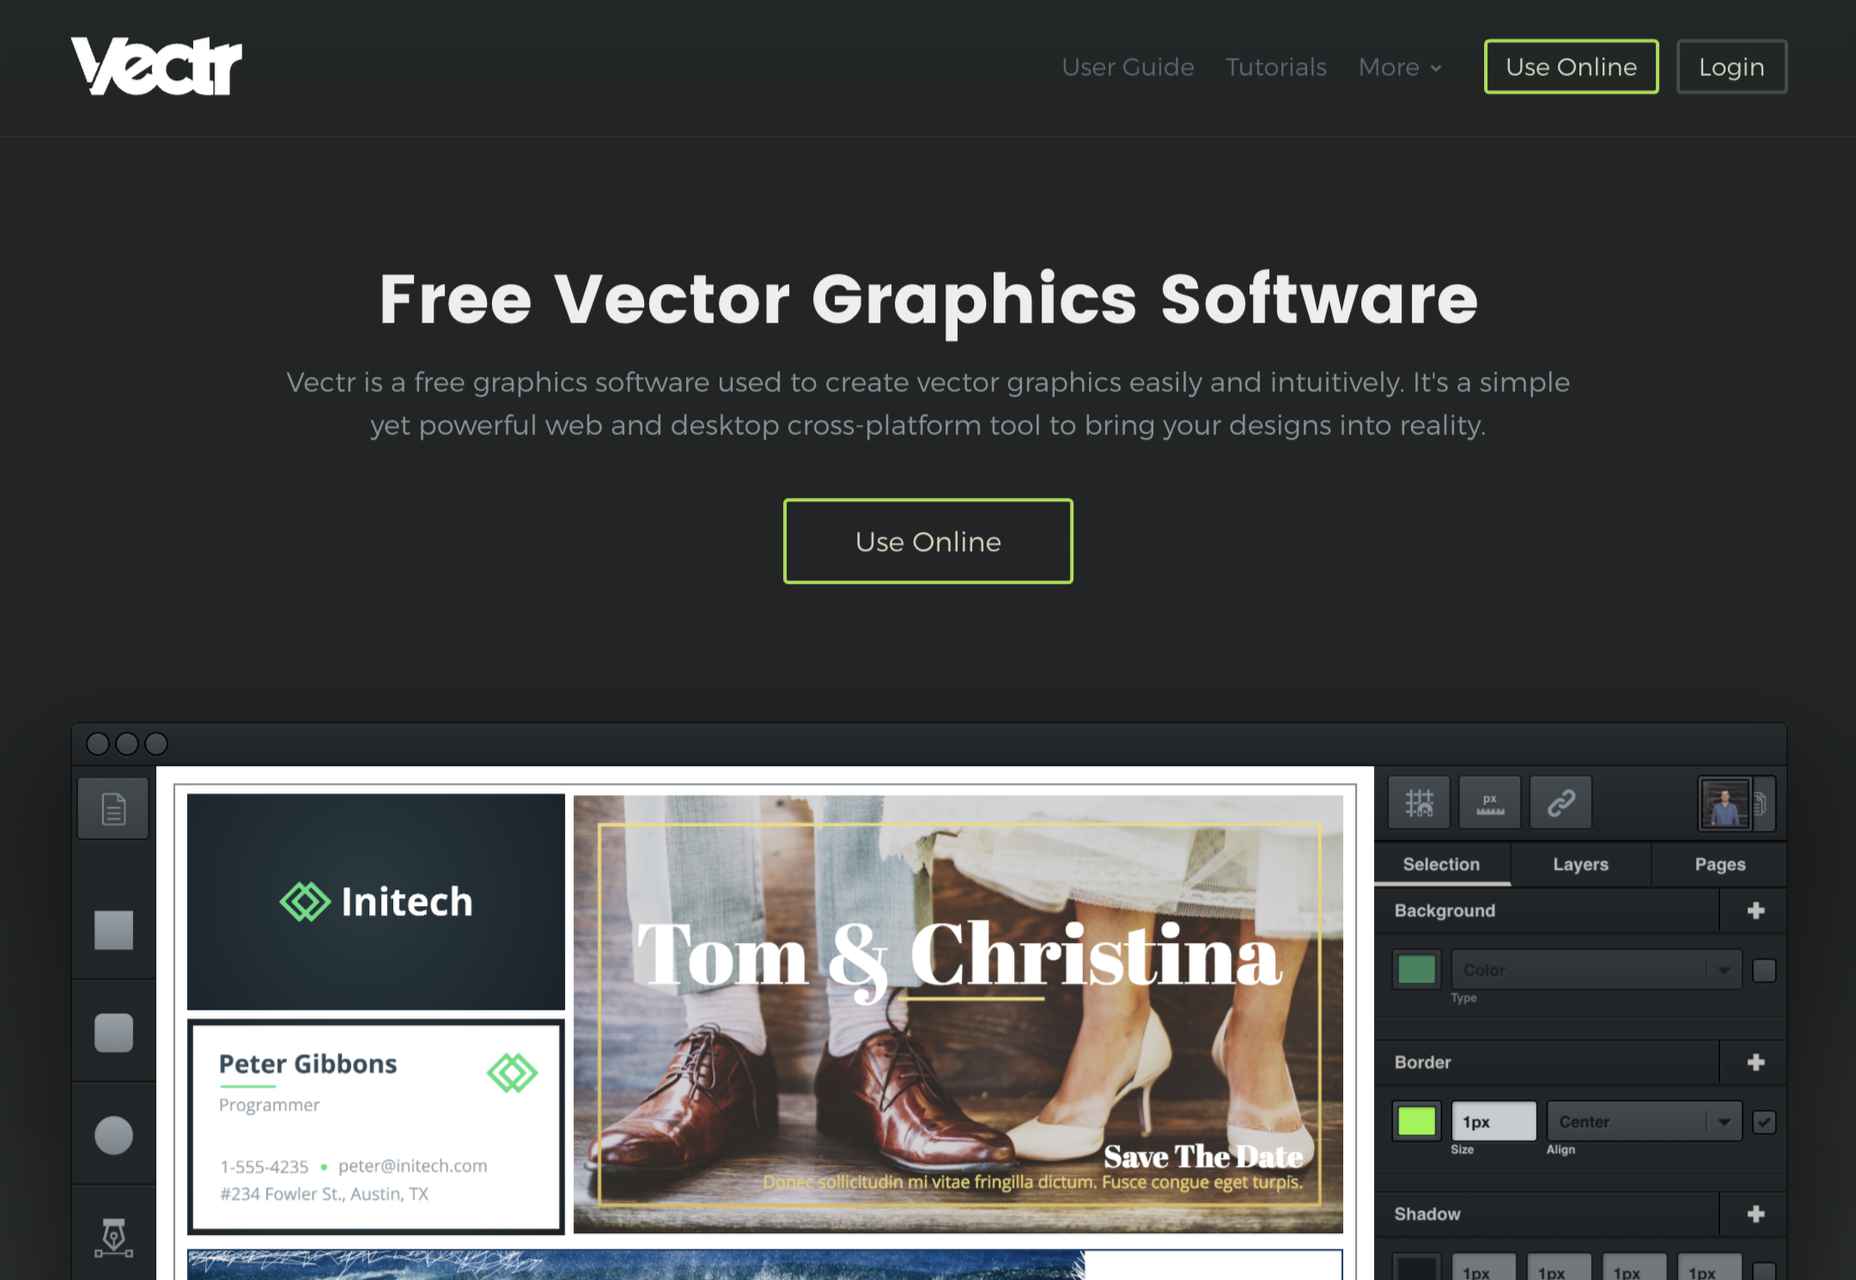
10. Vectr

Vectr is a simple vector design tool. It is heavily geared towards layout and even product design. It’s difficult to use it for many illustration jobs, but simple icon and UI creation are possible. It scrapes into our top ten thanks to the fact that it’s free to use.

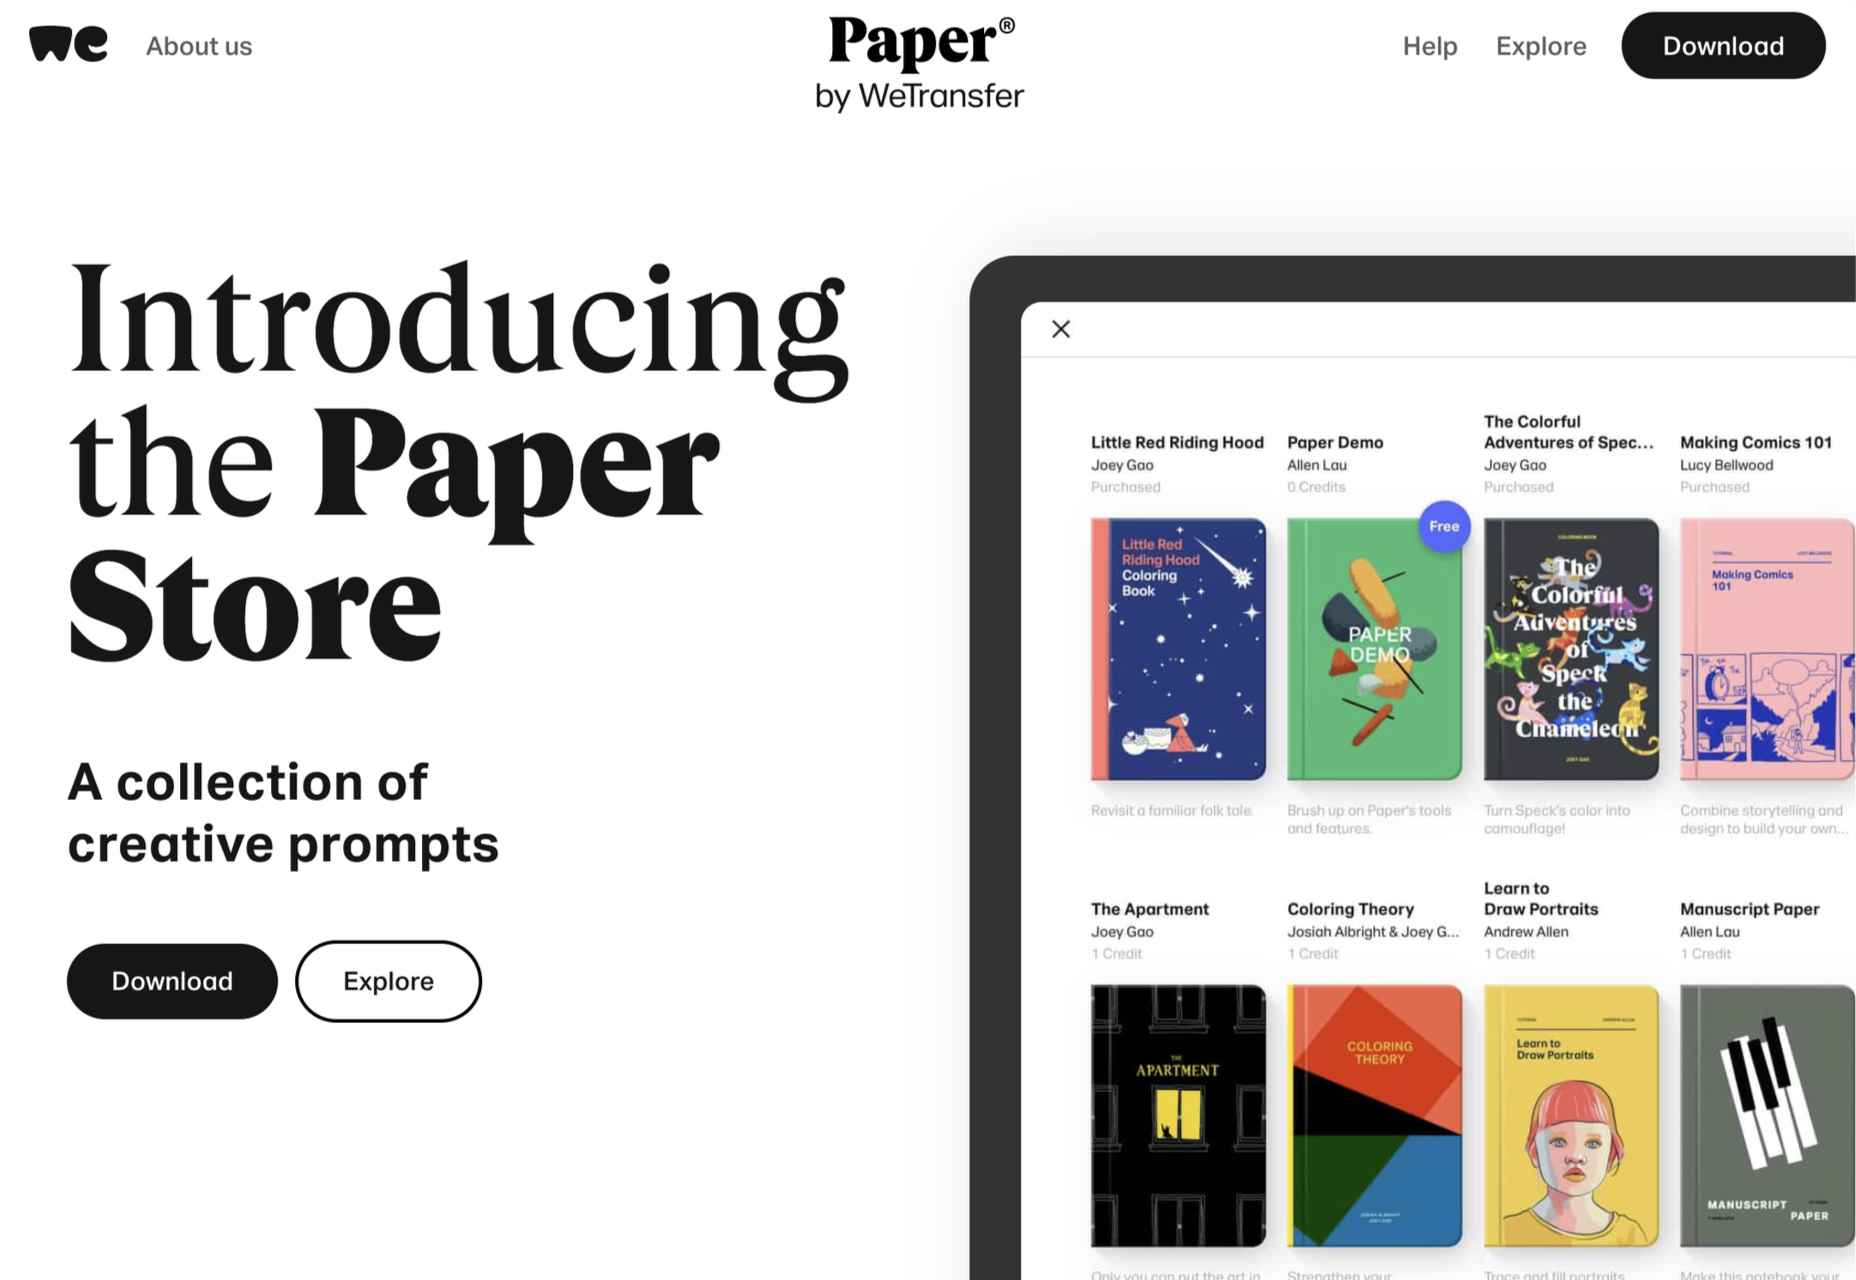
9. Paper

Paper is a sketching app developed by WeTransfer. It grabs number nine in our top ten thanks to its simplified interface that is perfect for generating ideas. It may not be the most flexible app, but it’s free to download, making illustration accessible to anyone with an iOS device.

8. Inkscape

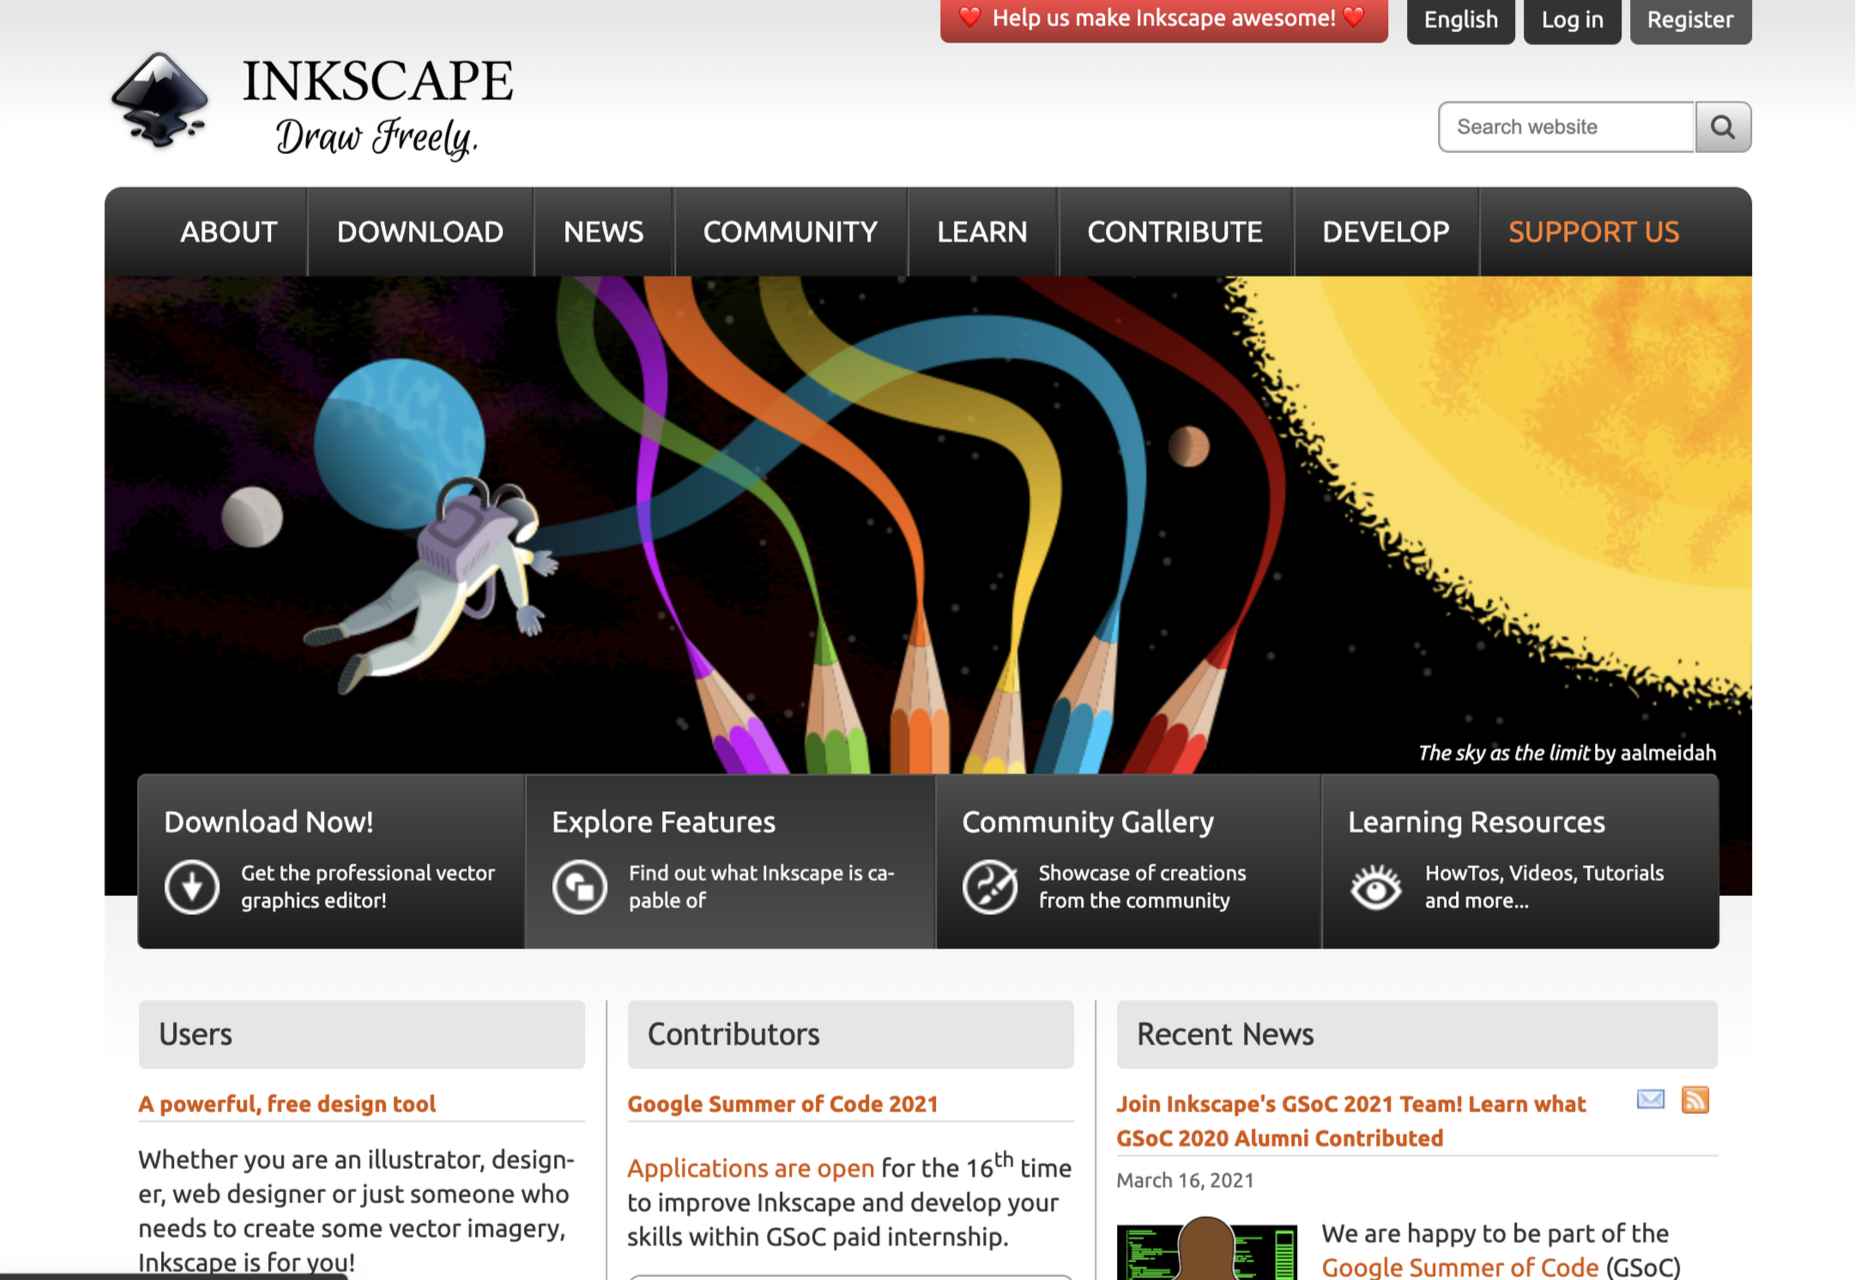
We love the fact that there’s someone out there producing a professional-grade artwork app for free. Inkscape is available for GNU/Linux, Windows, and macOS. If you’re interested in exploring this design area without signing up for a subscription or buying an iPad, Inkscape is a great place to start.

7. Assembly

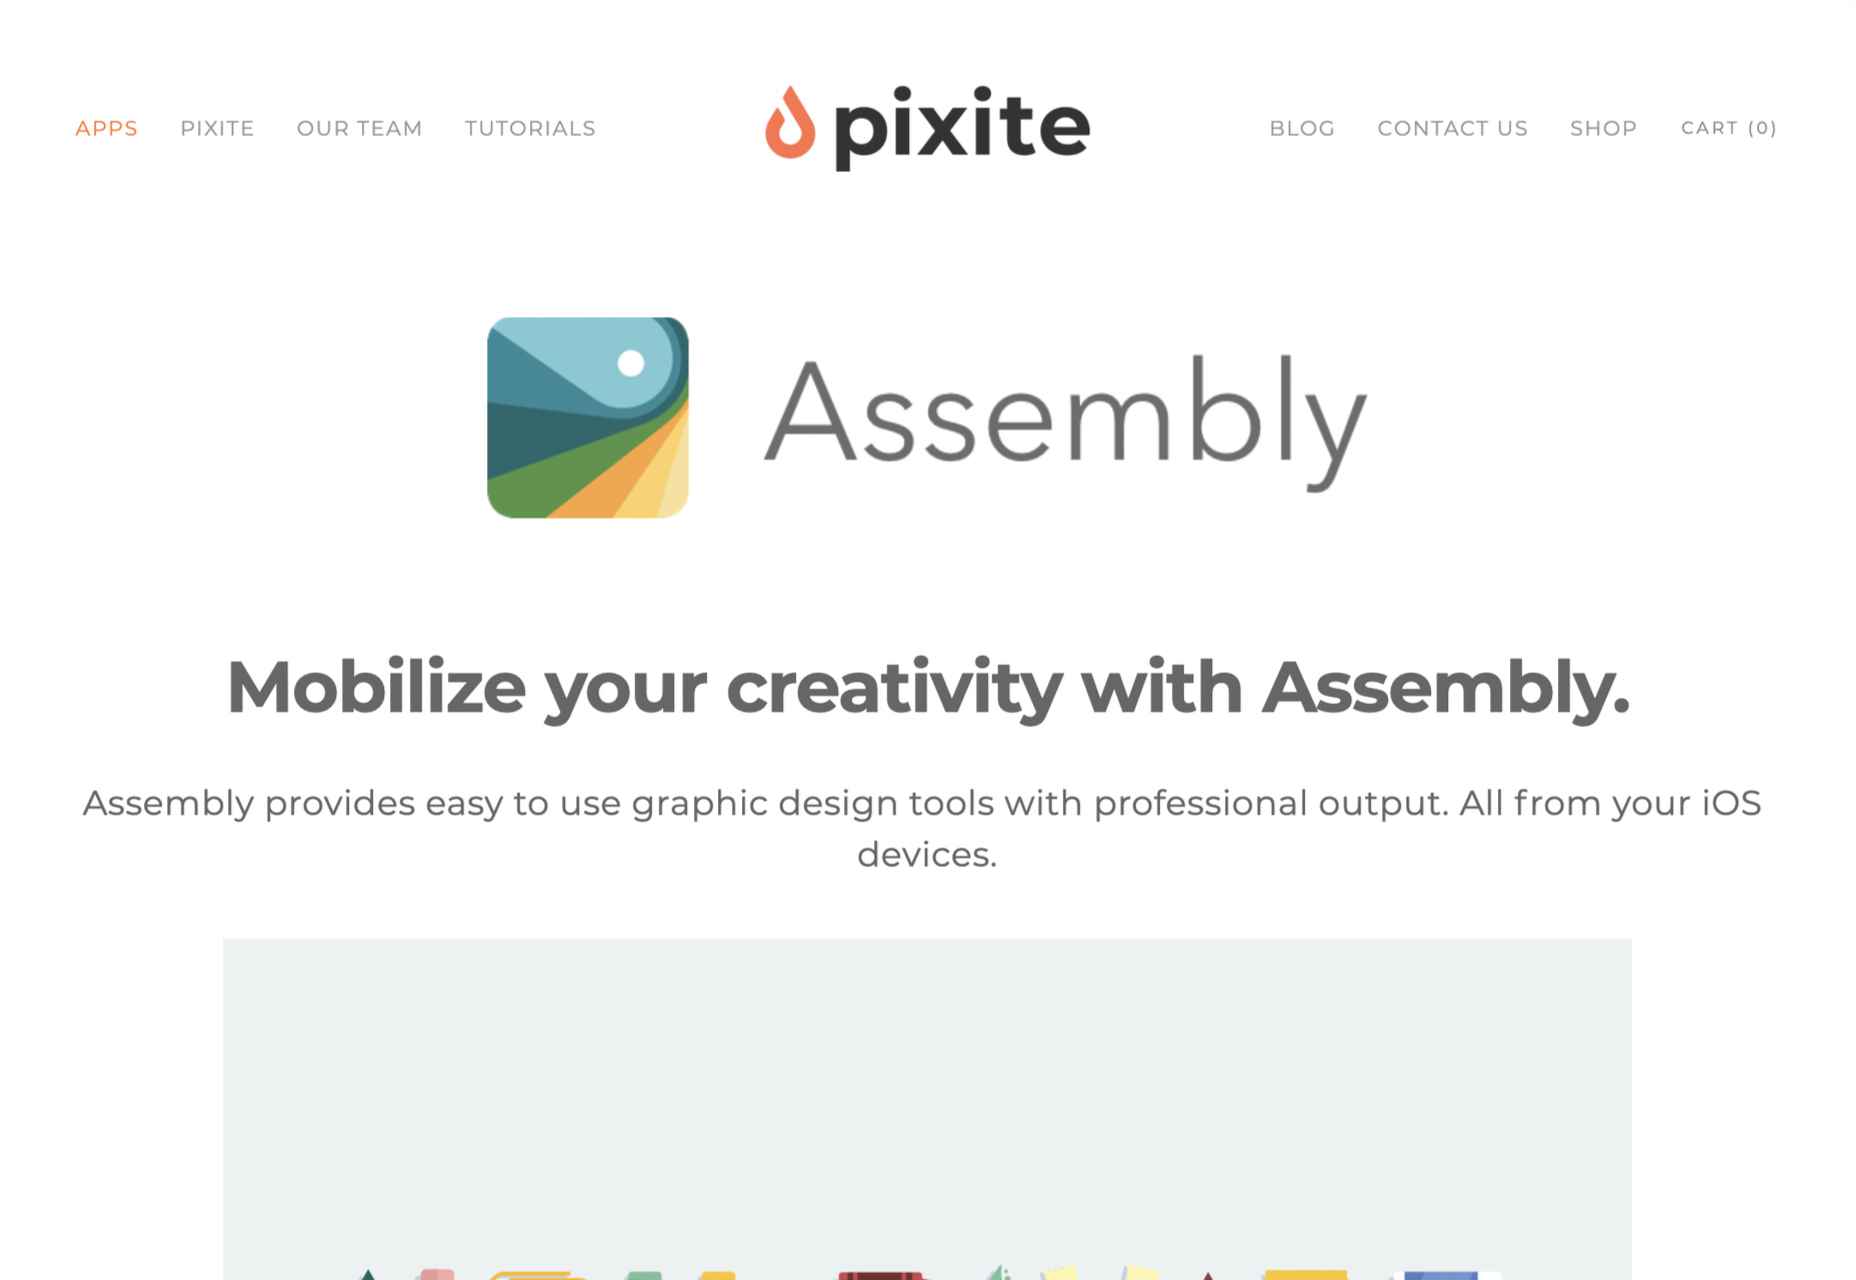
Assembly is another app that’s dependent on the transition of illustrators from desktop machines to mobile devices and is available for iOS. Assembly does things a little differently; instead of manipulating boolean curves, Assembly builds illustrations out of shapes. If you’re someone who thinks they can’t draw (spoiler alert: everyone can draw), this is the app for you.

6. Sketch

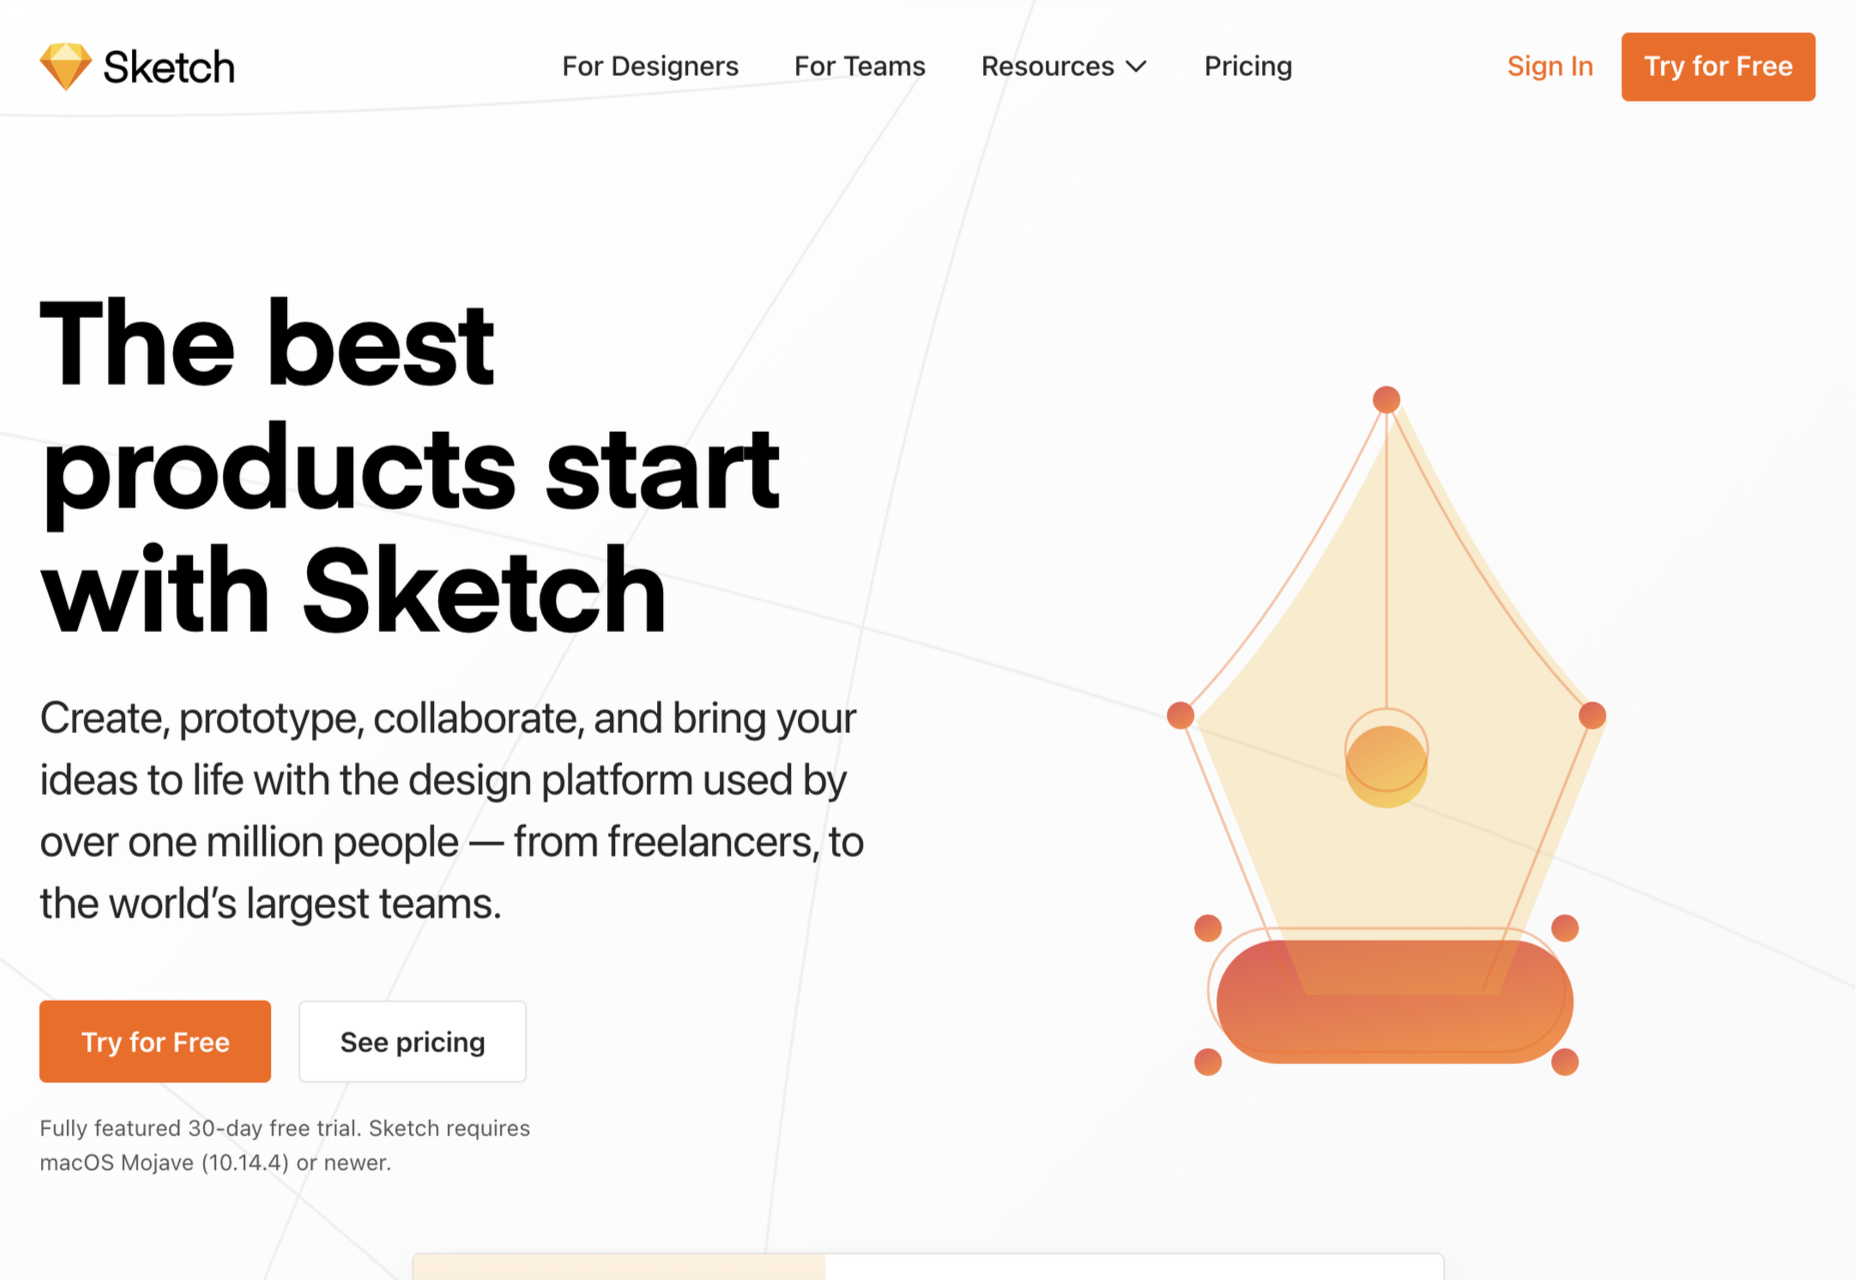
It’s a shock low-rating for Sketch, the highly popular product design app doesn’t make it out of the bottom half of our list. The reason for the lower ranking? Sketch is an incredible design app, but its greater investment in prototyping features has come at the cost of drawing innovation. It’s still a great choice for crisp icon design, but it’s not flexible enough to take a higher spot in our list.

5. CorelDRAW

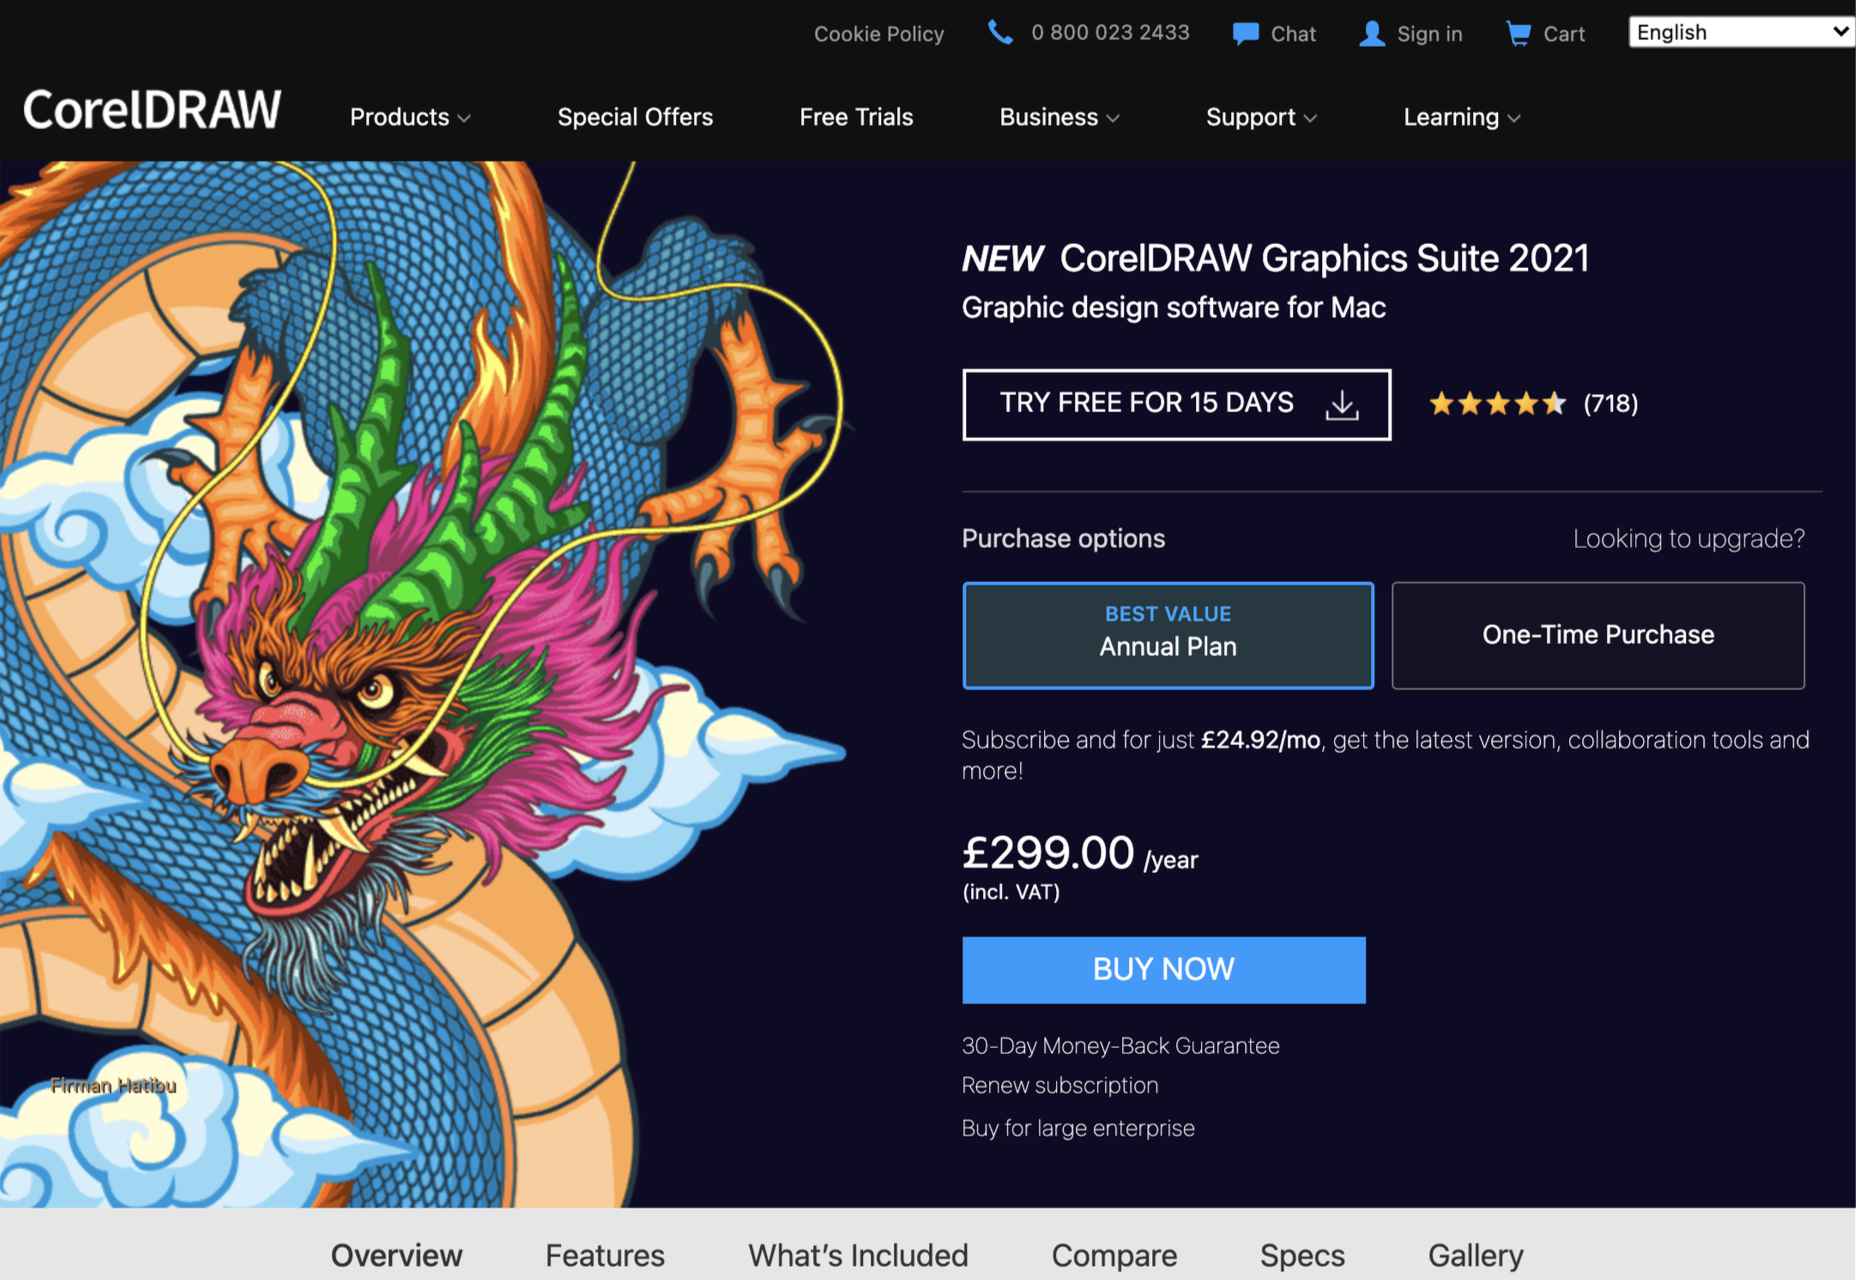
If you’re getting the impression that design apps are mostly for macOS or iOS, then you’d not be alone. CorelDRAW Graphics Suite is one of the few that began its life on Windows before being rebuilt for Mac. CorelDRAW is a premium option, but like Adobe’s offering, it is a suite of tools that cover everything you’ll need to create any form of design work you could ever need.

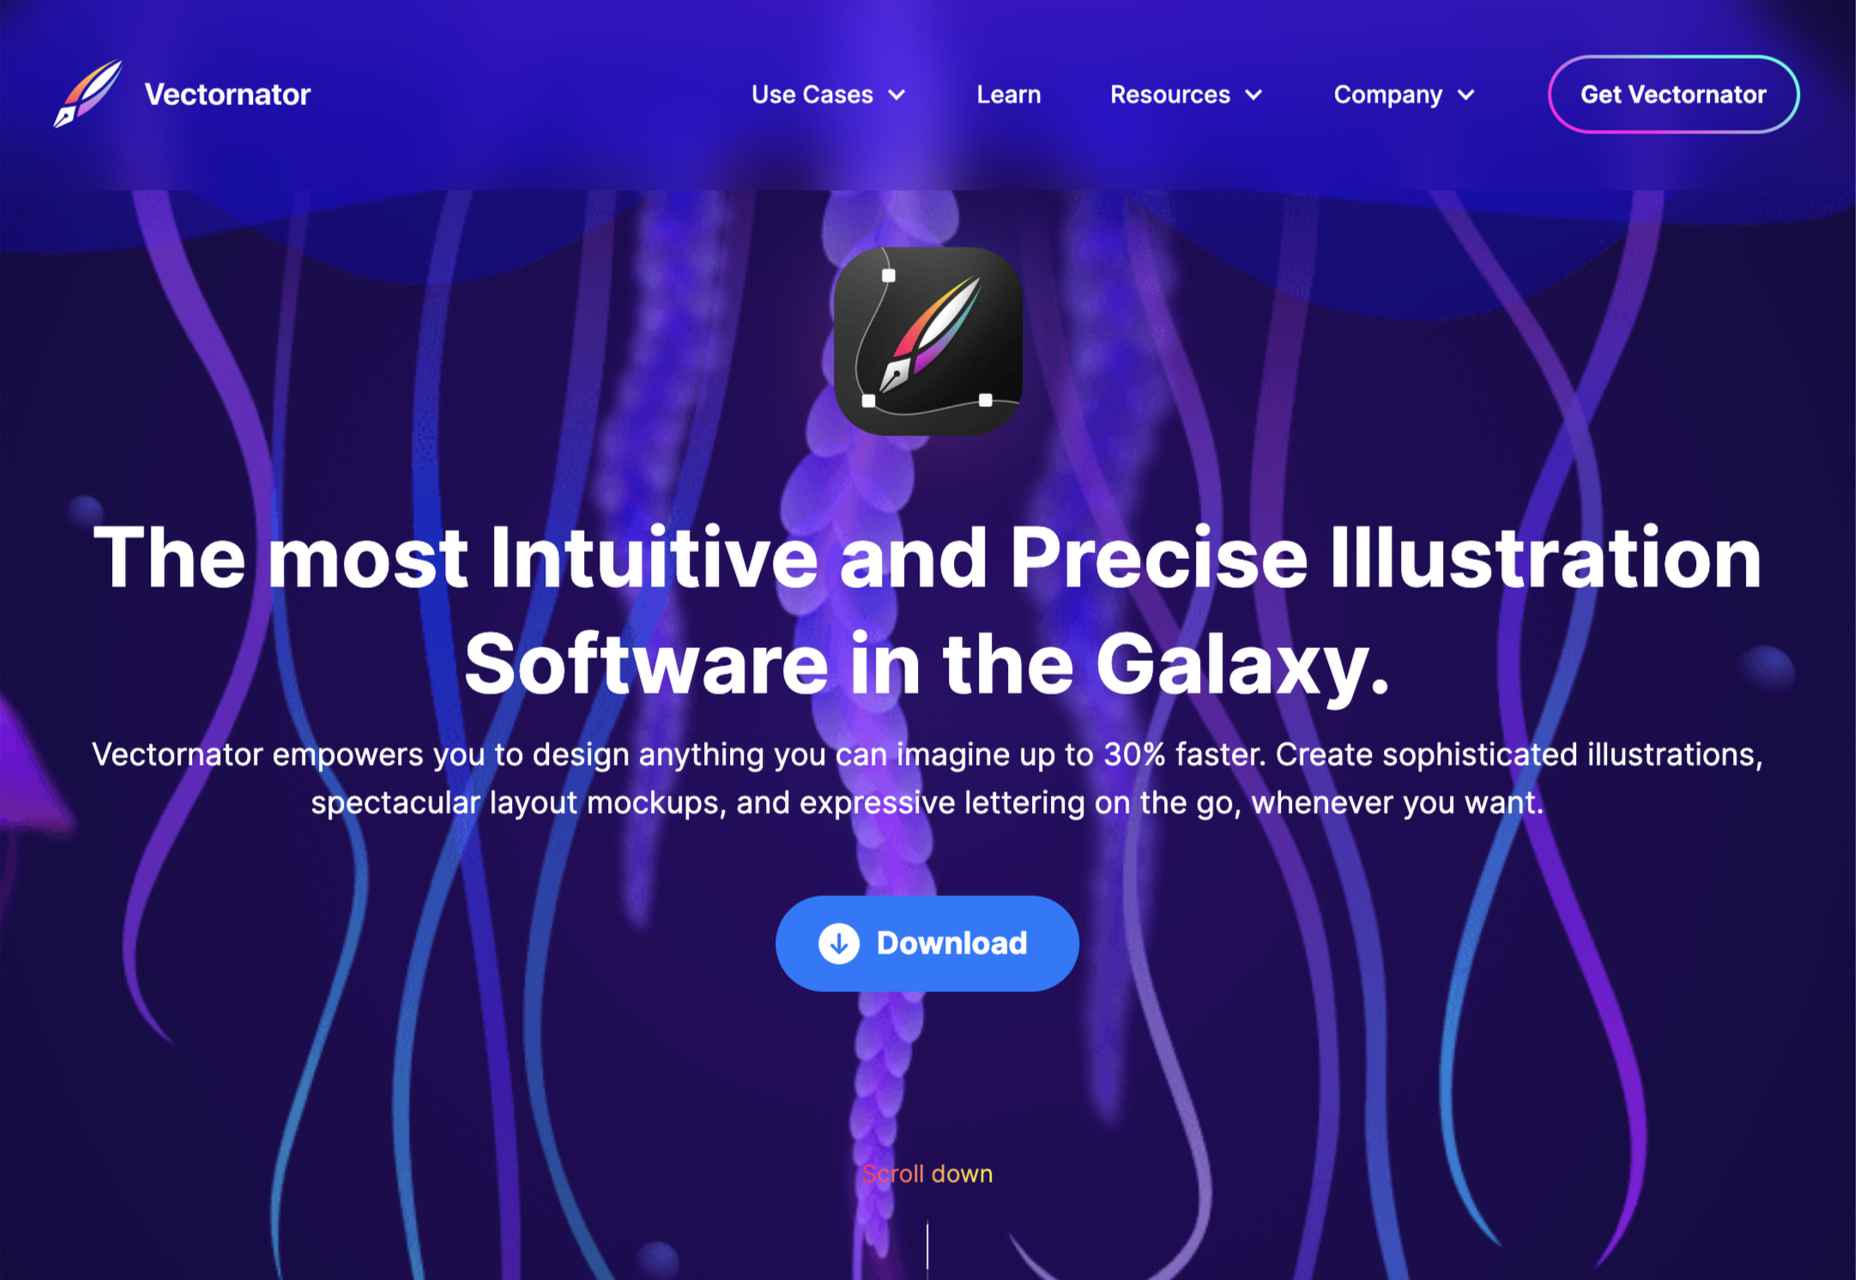
4. Vectornator

Moving closer to the top spot, Vectornator is an up-and-coming tool. Like many other apps further up our chart, Vectornator does a lot more than simply illustration. Its underlying tools provide a solid foundation for a flexible set of tools that you can use for any artwork. Vectornator does an awful lot, awfully well. 

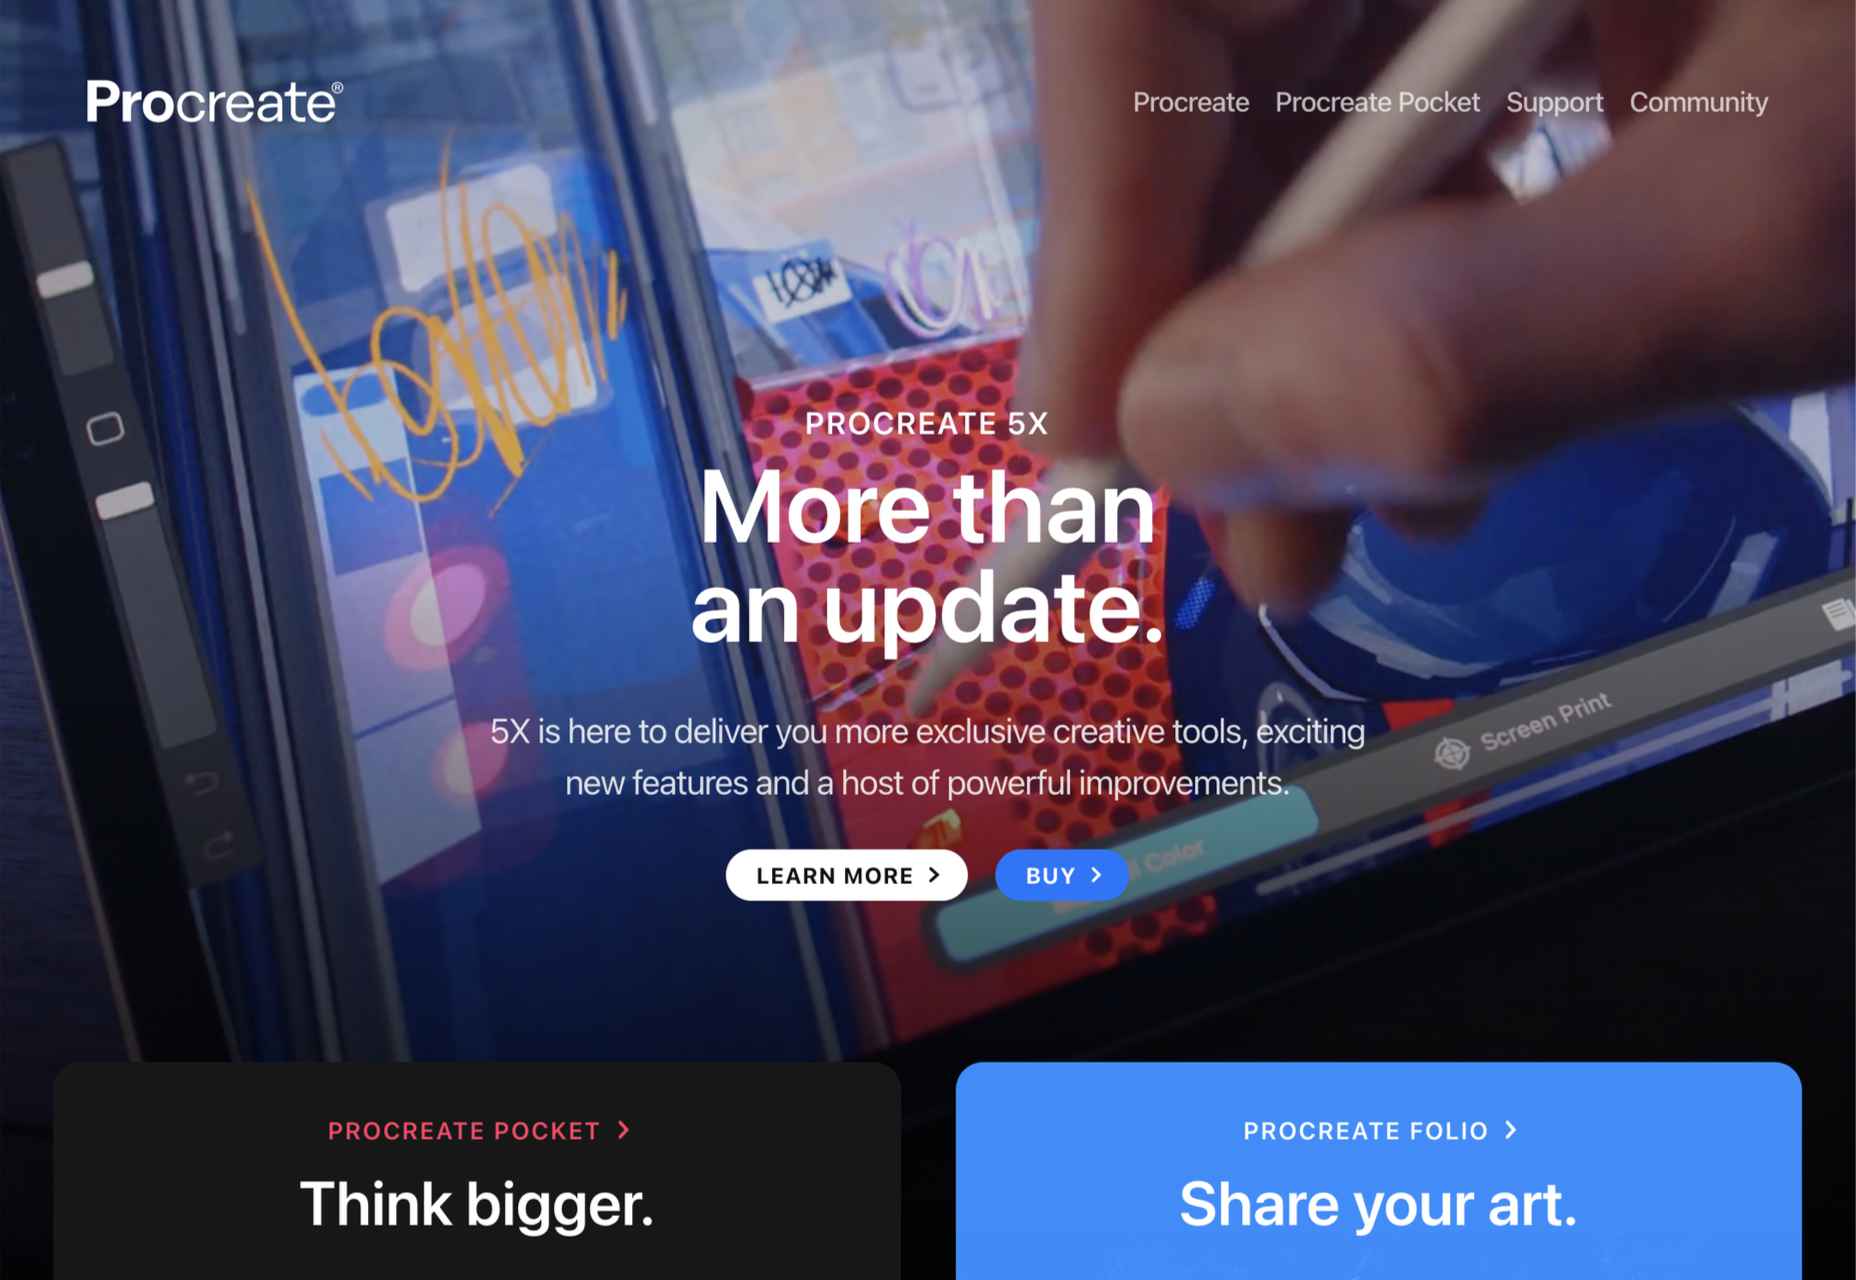
3. Procreate

Procreate is one of the finest apps on this list, thanks in main to its incredible brush studio; being able to edit the marks you make is essential for any expressive artwork. Procreate enables expressive illustration, typography, and simple sketches. The only downside to this app is that it’s iOS only; if available on more platforms, it might have been even further up the list.

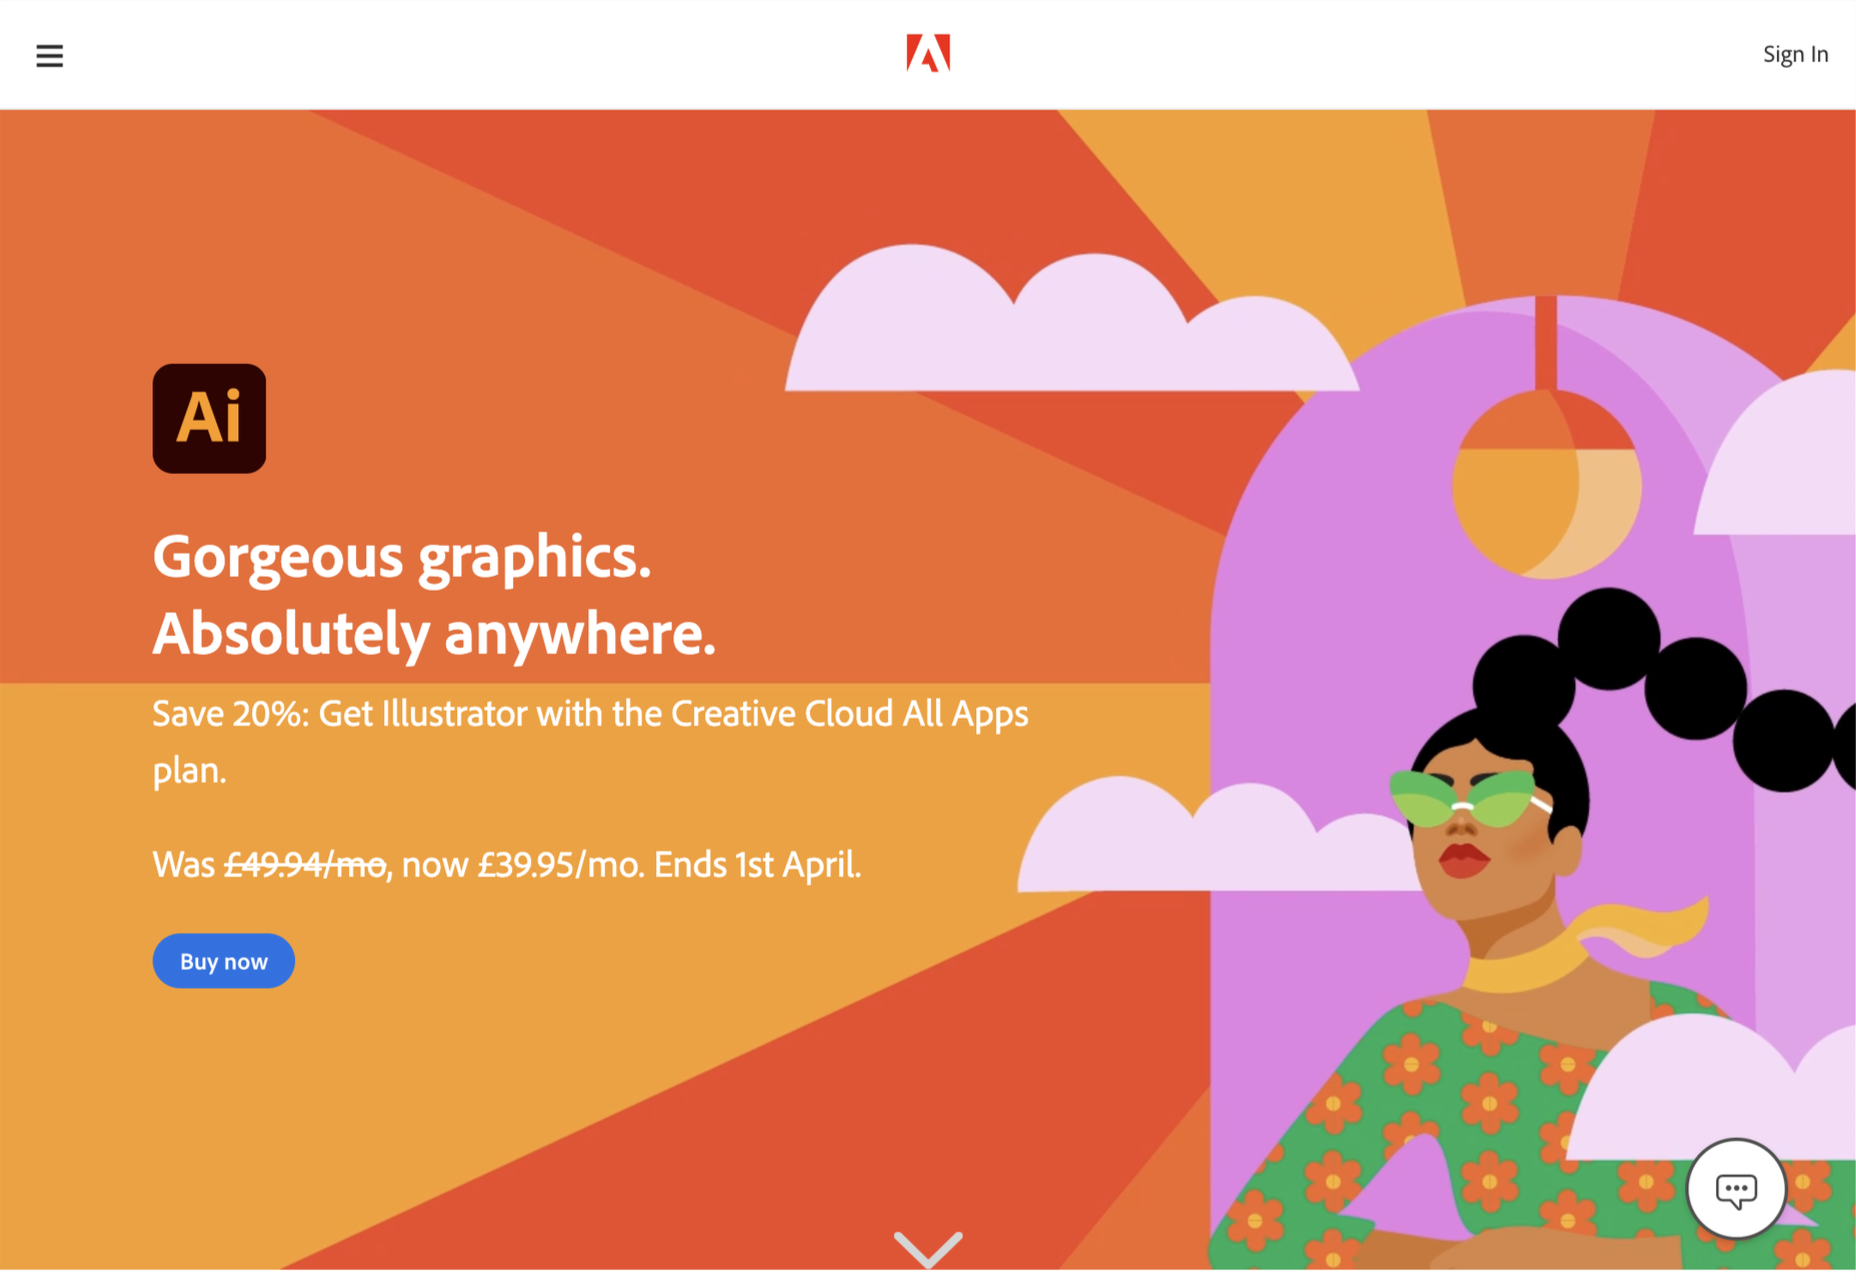
2. Adobe Illustrator

That’s right; we don’t think design giant Adobe’s illustration app Illustrator is worthy of the number one spot.

Illustrator is an excellent tool and arguably deserves to be considered Adobe’s flagship product. Since Adobe relented and allowed individual app subscriptions, it is also reasonably priced. It does everything you could want in an illustration app, from designing icons to creating original artwork.

So why not the top spot? It wasn’t so much that Illustrator fell down anywhere, as a different app pipped it to the post…

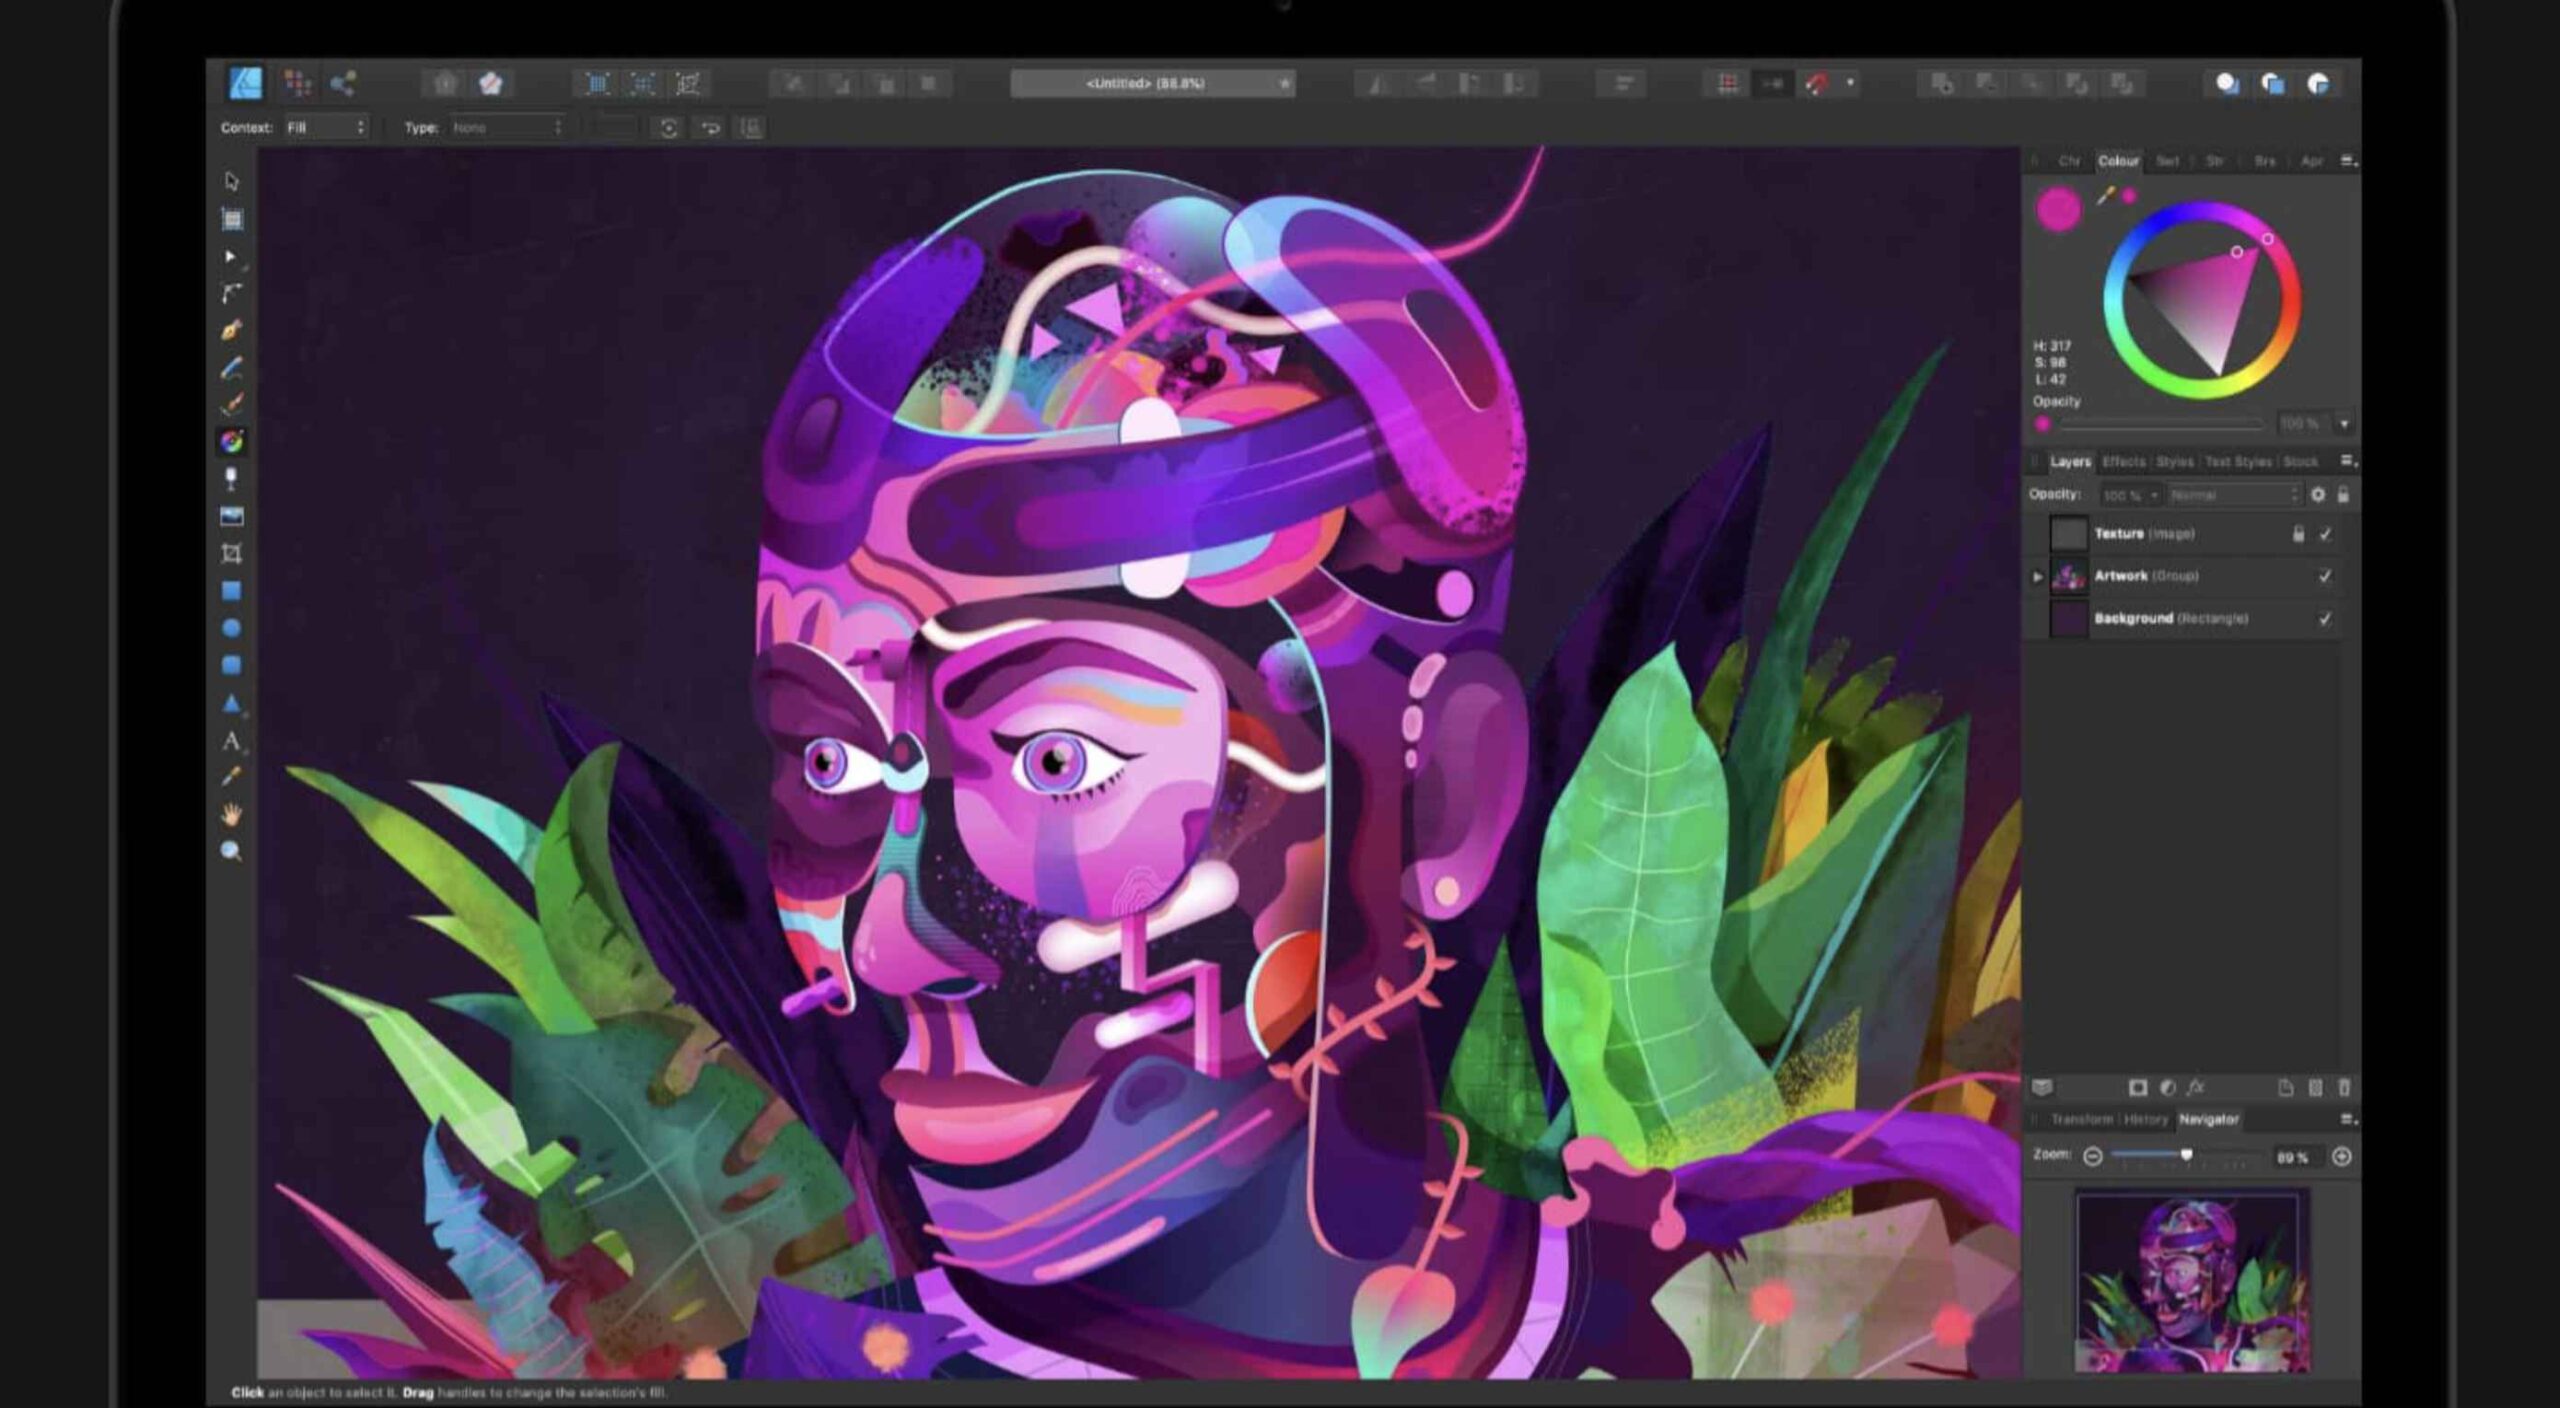
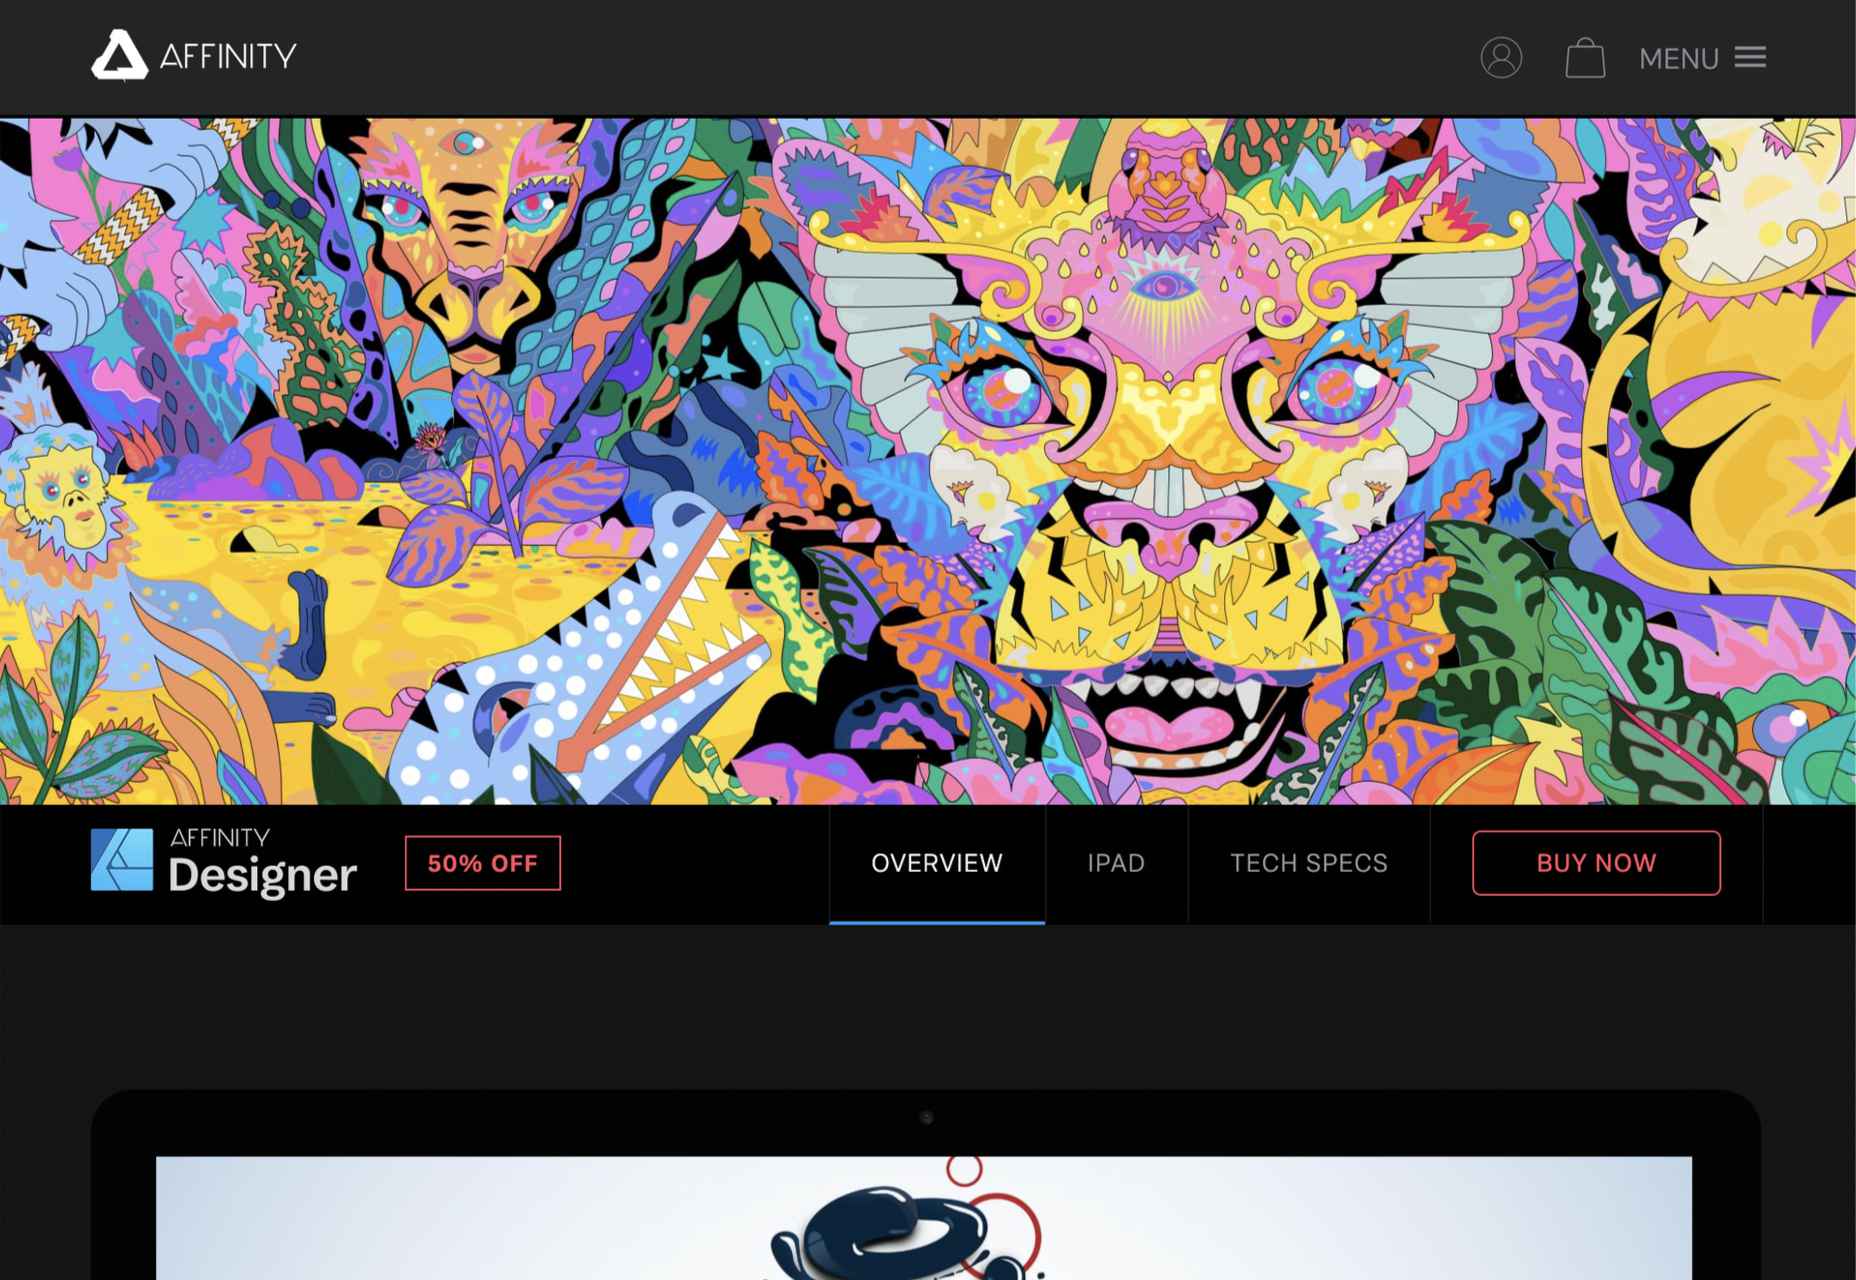
1. Affinity Designer

The best app for illustration in 2021 is Affinity Designer. We’ve been fans since its first beta version, and we’ve watched it go from underdog to champion.

On top of being an excellent vector app, Designer is comfortable with raster graphics. Although it certainly can’t compete with Photoshop (Affinity built Photo for that), Designer is more than adequate for many image tasks, making it a great all-around design app. Designer was also the first design app to support macOS’ new M1 chip natively.

The knockout blow is that Affinity Designer is available as a desktop app and an iOS app; the two apps have minor differences in their interfaces; what matters is that both apps use the exact same file format. You can seamlessly switch between desktop, iPad, and back to desktop, taking advantage of the precision of a mouse and the expression of a stylus.

It’s this kind of flexibility that bends Affinity Designer to your workflow instead of the other way around, and that’s why it’s top of our list.

Source

The post Ranked: Top 10 Illustration Apps in 2021 first appeared on Webdesigner Depot.


Source de l’article sur Webdesignerdepot

Every week users submit a lot of interesting stuff on our sister site Webdesigner News, highlighting great content from around the web that can be of interest to web designers.

The best way to keep track of all the great stories and news being posted is simply to check out the Webdesigner News site, however, in case you missed some here’s a quick and useful compilation of the most popular designer news that we curated from the past week.

Google’s Next Big Chrome Update Will Rewrite the Rules of the Web

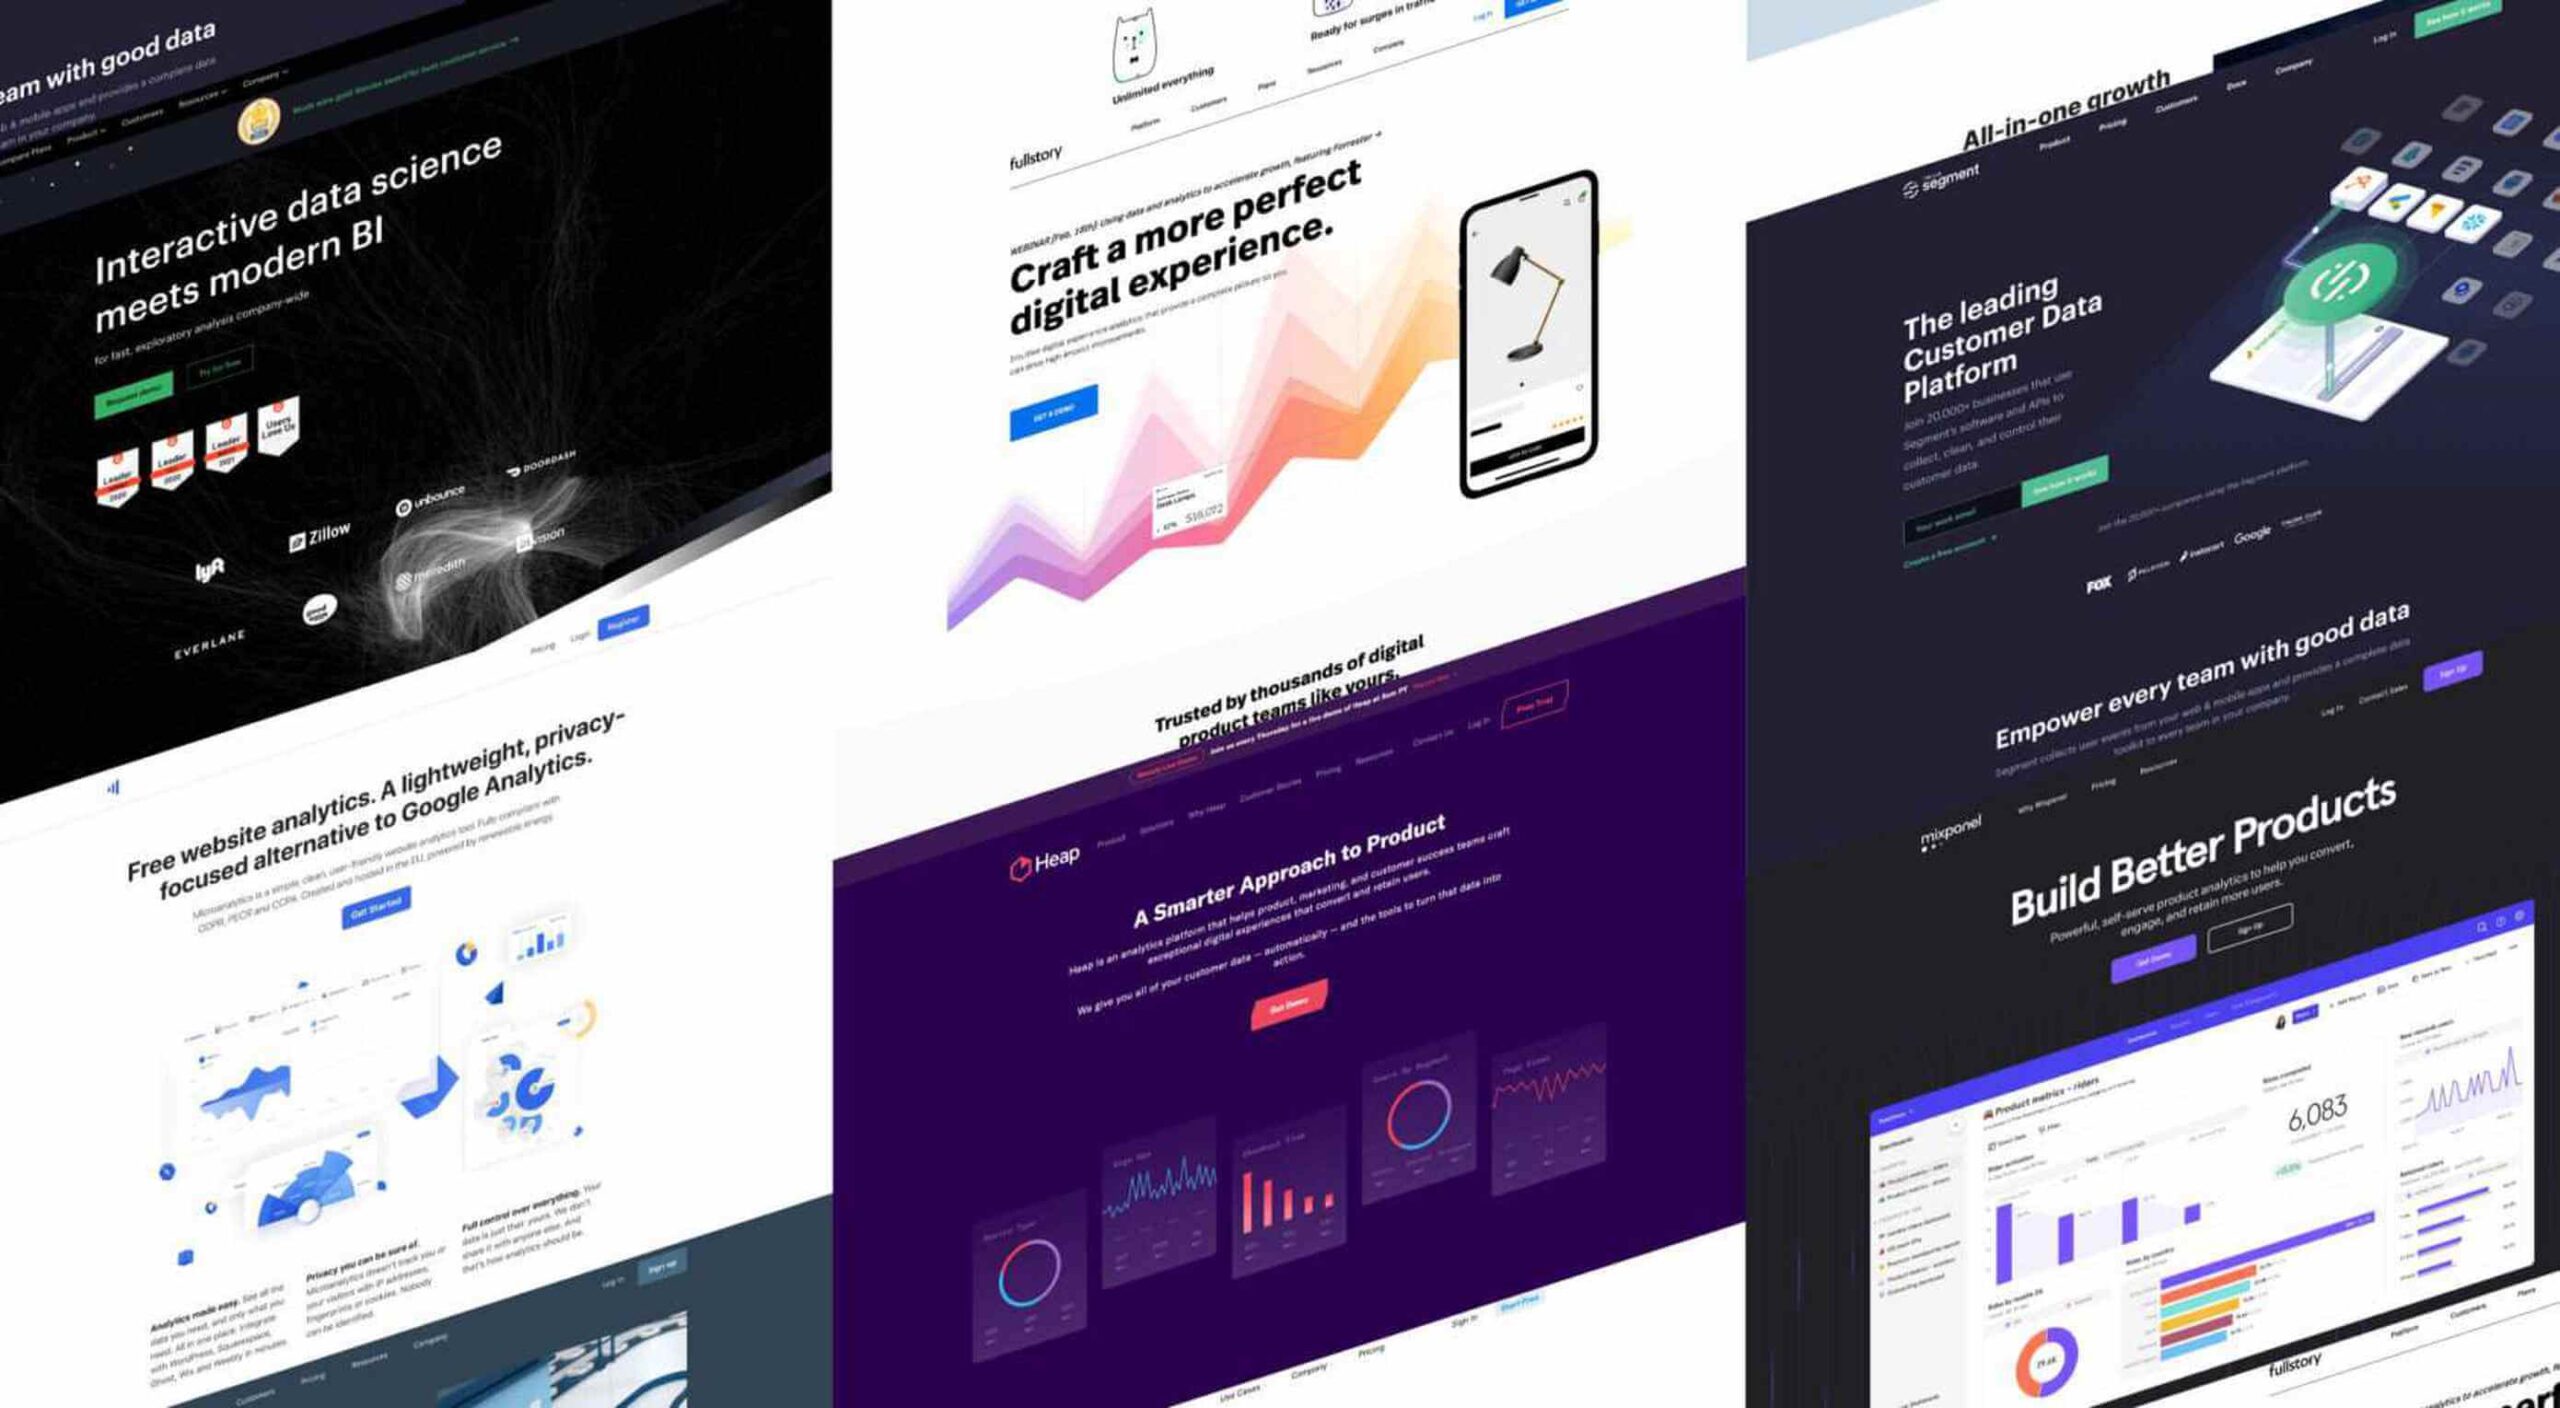
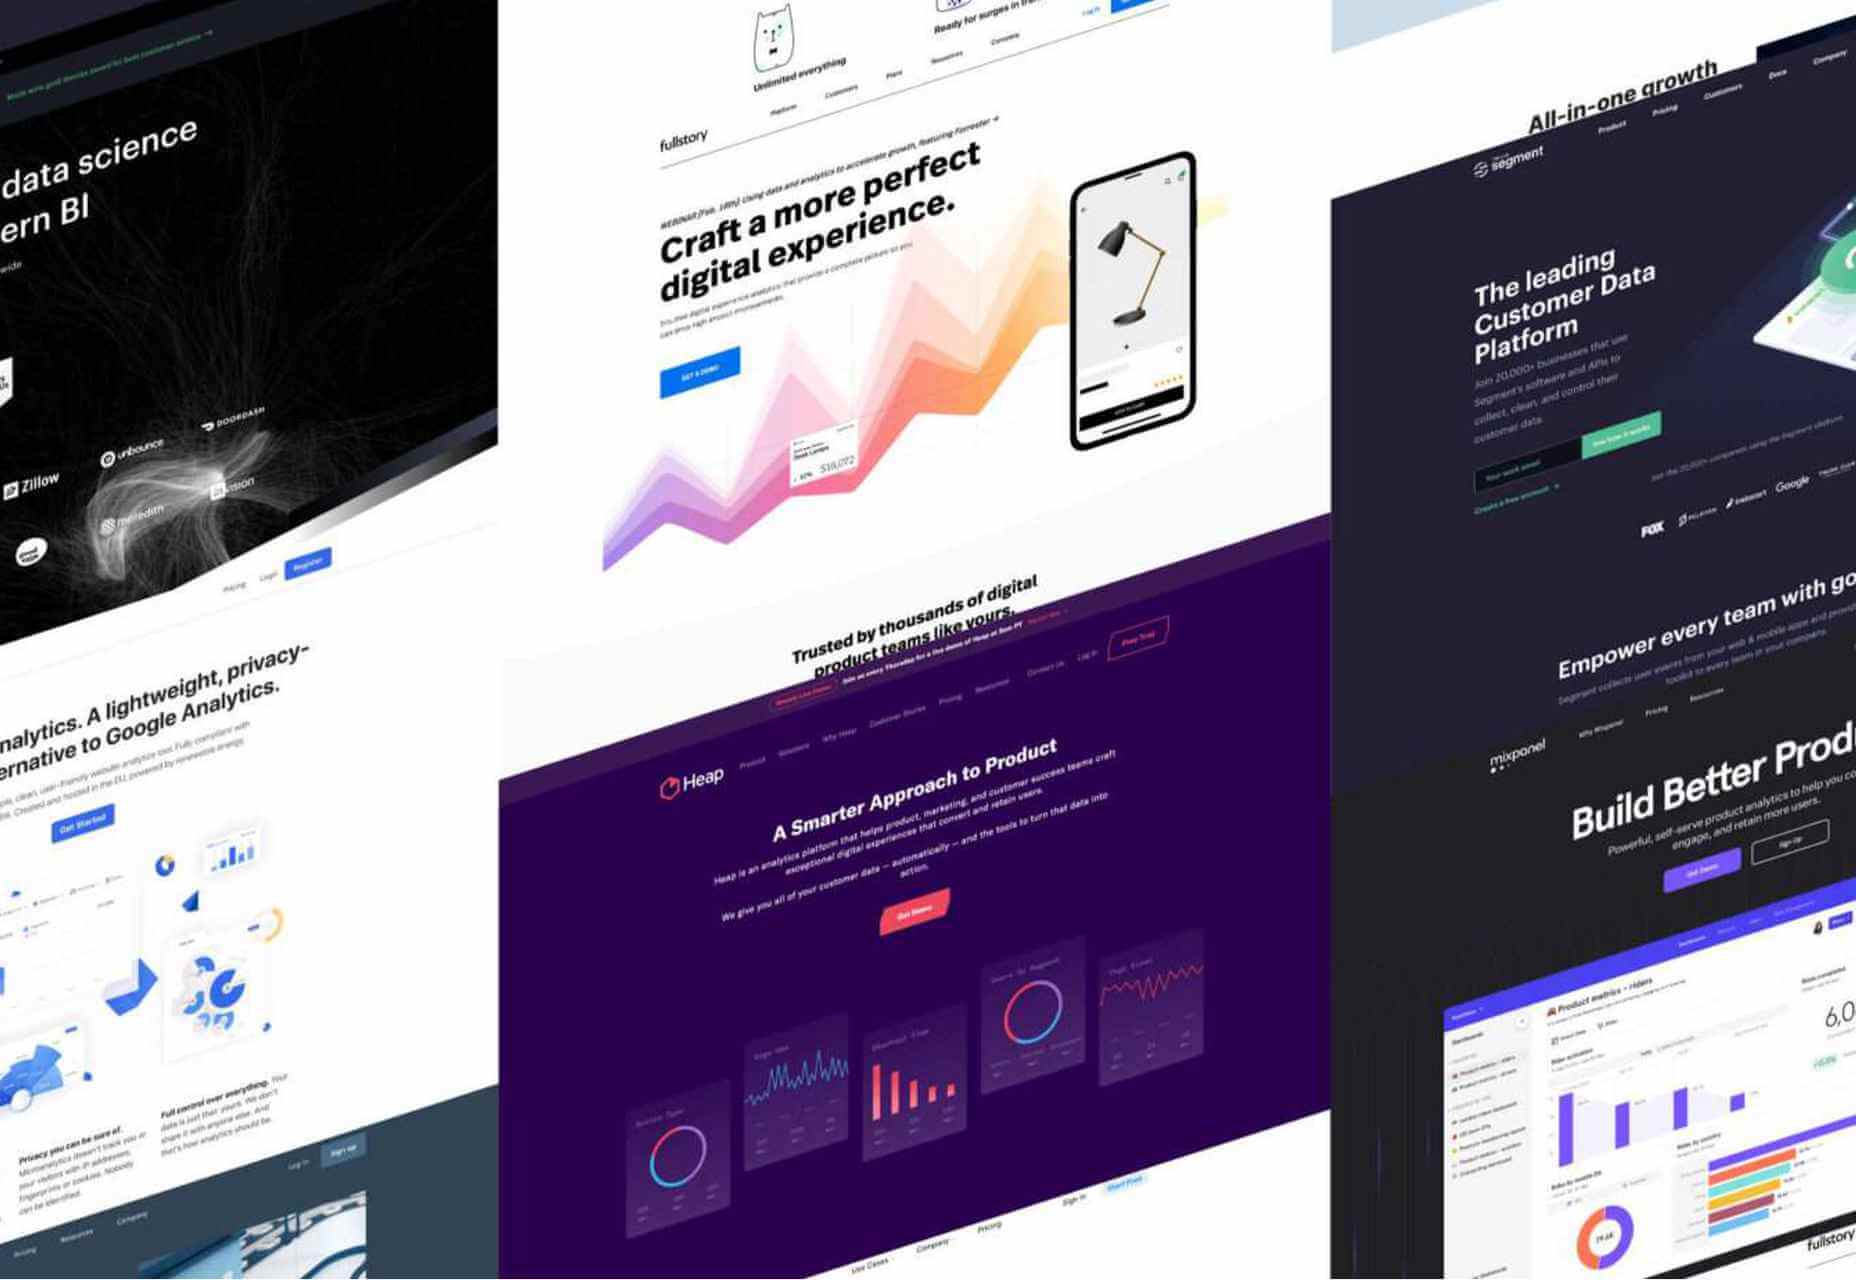
10 Best Alternatives to Google Analytics in 2021

Gamification in UX Design: Designing Fun Experiences for Serious

UI Design Trends for Web and Mobile We Start 2021 With

Getting The Most Out Of Git

Appreciating the Unsung Heroes of WordPress

Simple CSS Line Hover Animations for Links

How to Kill a Unicorn

Animating a CSS Gradient Border

Color Spark – A Color Scheme Plugin for Figma

QuickLens – Inspect the UI Like a Pro

6 Important WordPress Gutenberg Updates to Be Aware Of

23 Exciting New Tools for Designers, February 2021

A UX Guide to Optimize Conversions

13 UX Tips That Will Improve Your Website’s SEO

Don’t Offer a Free Plan

The 25 Best Single Page Web Designs

Illustration Kit – Premium Open Source Illustrations Updated Daily

DesignOps: Just a New Buzzword?

Bilgge – a Privacy-paranoid Free Service for your Notes and Secrets

How to Deal With Designers in 10 Easy Steps

Website Optimization Checklist: Your Go-To Guide to SEO

JavaScript Minification Benchmarks

Framer is Dead · A Love Letter to my Prototyping Tool of Choice

The Differences in Web Hosting (Go with the Happy Path)

Pixelplace.io – One Giant Pixel Canvas That Anyone Can Draw On

Source

The post Popular Design News of the Week: February 8, 2021 – February 14, 2021 first appeared on Webdesigner Depot.


Source de l’article sur Webdesignerdepot

When creating a website, it’s vital to remember that not only does it need to work and look great on the device you are creating it on, but on all the other devices, it might be used on too.

Mobile and tablet optimization is important not only for the user journey but from an SEO point of view too, and badly created mobile sites just don’t cut it anymore.

With more and more devices entering the market, you need to check any website you create is compatible across the board. One bad experience and users are likely to leave and not come back again, which can be catastrophic for a business, particularly if it is just starting out.

It’s vital to check how a site looks and behaves when browsed differently from how you would use it. A common mistake is to assume users only browse websites on mobile devices in portrait mode; they don’t; landscape browsing is common, especially if the user is used to watching video.

Here are some of our top tools for testing websites on devices without the need for an entire device library:

1. Multi-Screen Test

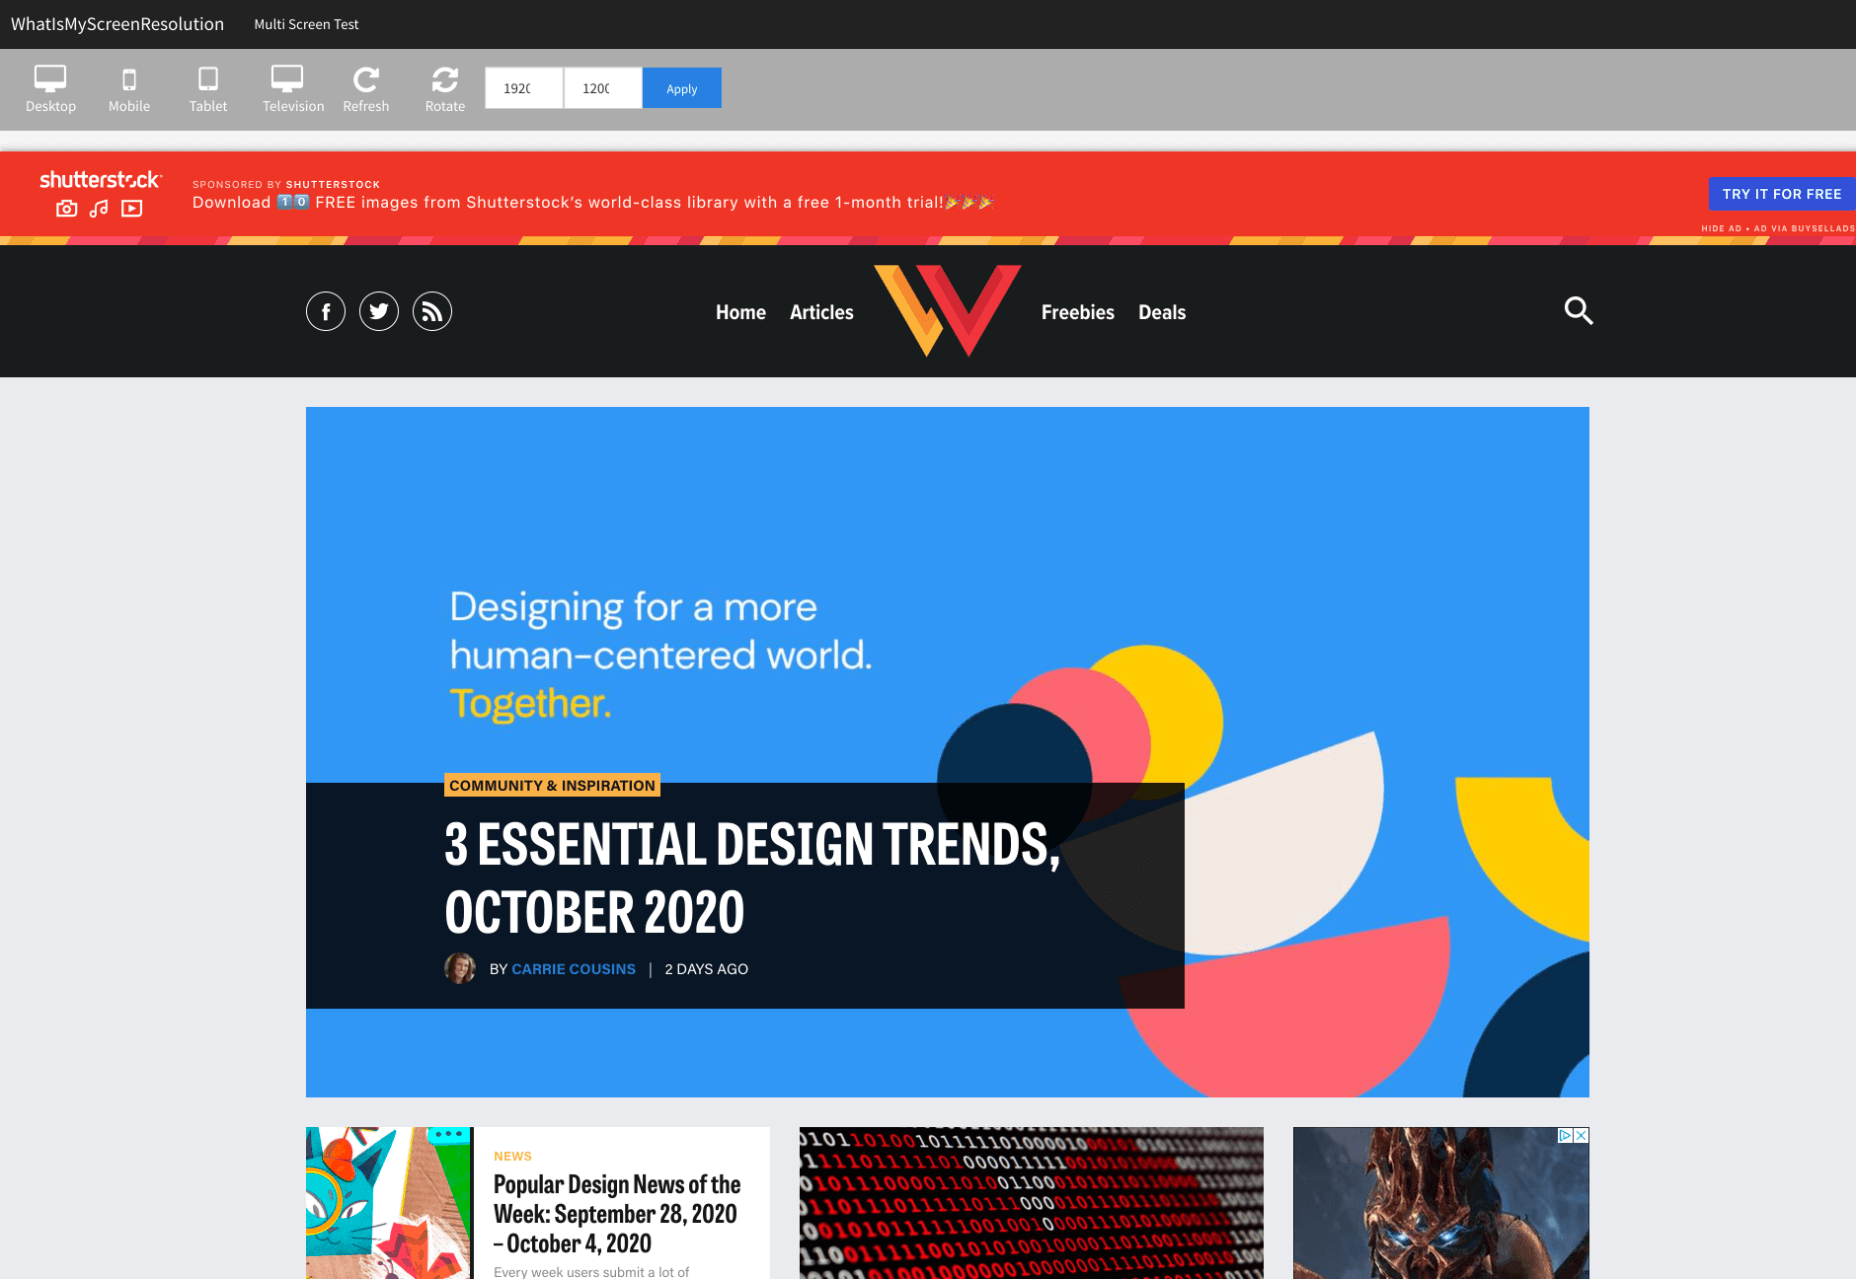
WhatIsMyScreenResolution offers a great little tool to test how your site will look on different devices easily, and it costs absolutely nothing. You put the URL and choose between desktop, mobile, tablet, and television and then the orientation. Each device can also be broken down into different sizes and resolutions (or you can enter your own), making it easier than ever to test what a site will look like on different devices.

2. Responsinator

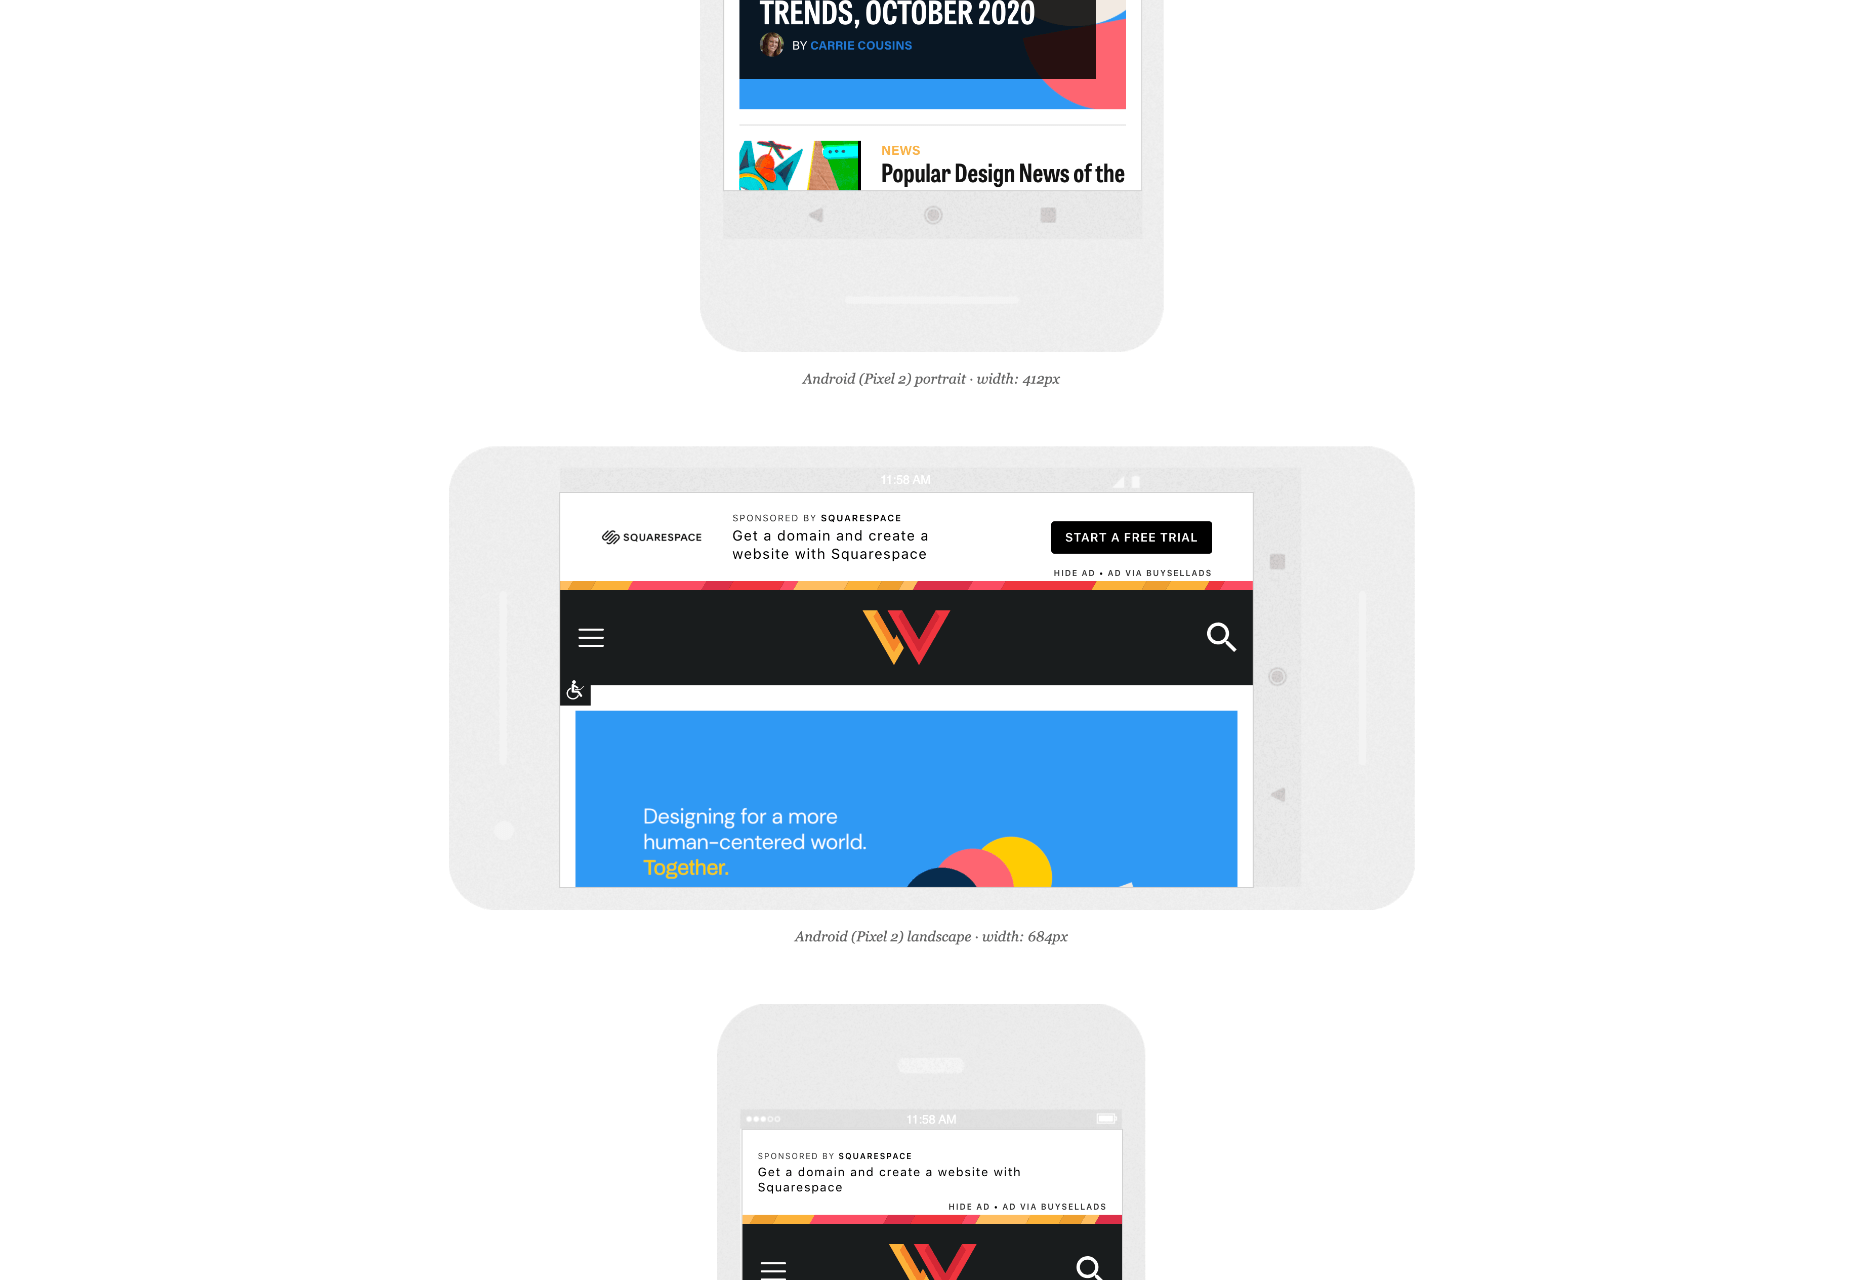
Responsinator is another great tool to test how a site looks on other devices without dipping into your wallet. Put your URL in the top bar, and it will instantly show you what it looks like on generic devices. This is a great, easy to use tool, and you can click through any links on your site to check the usability of multiple pages. This site is free, but if you want to “create your own” template, you need to sign up.

3. Google Dev Tools

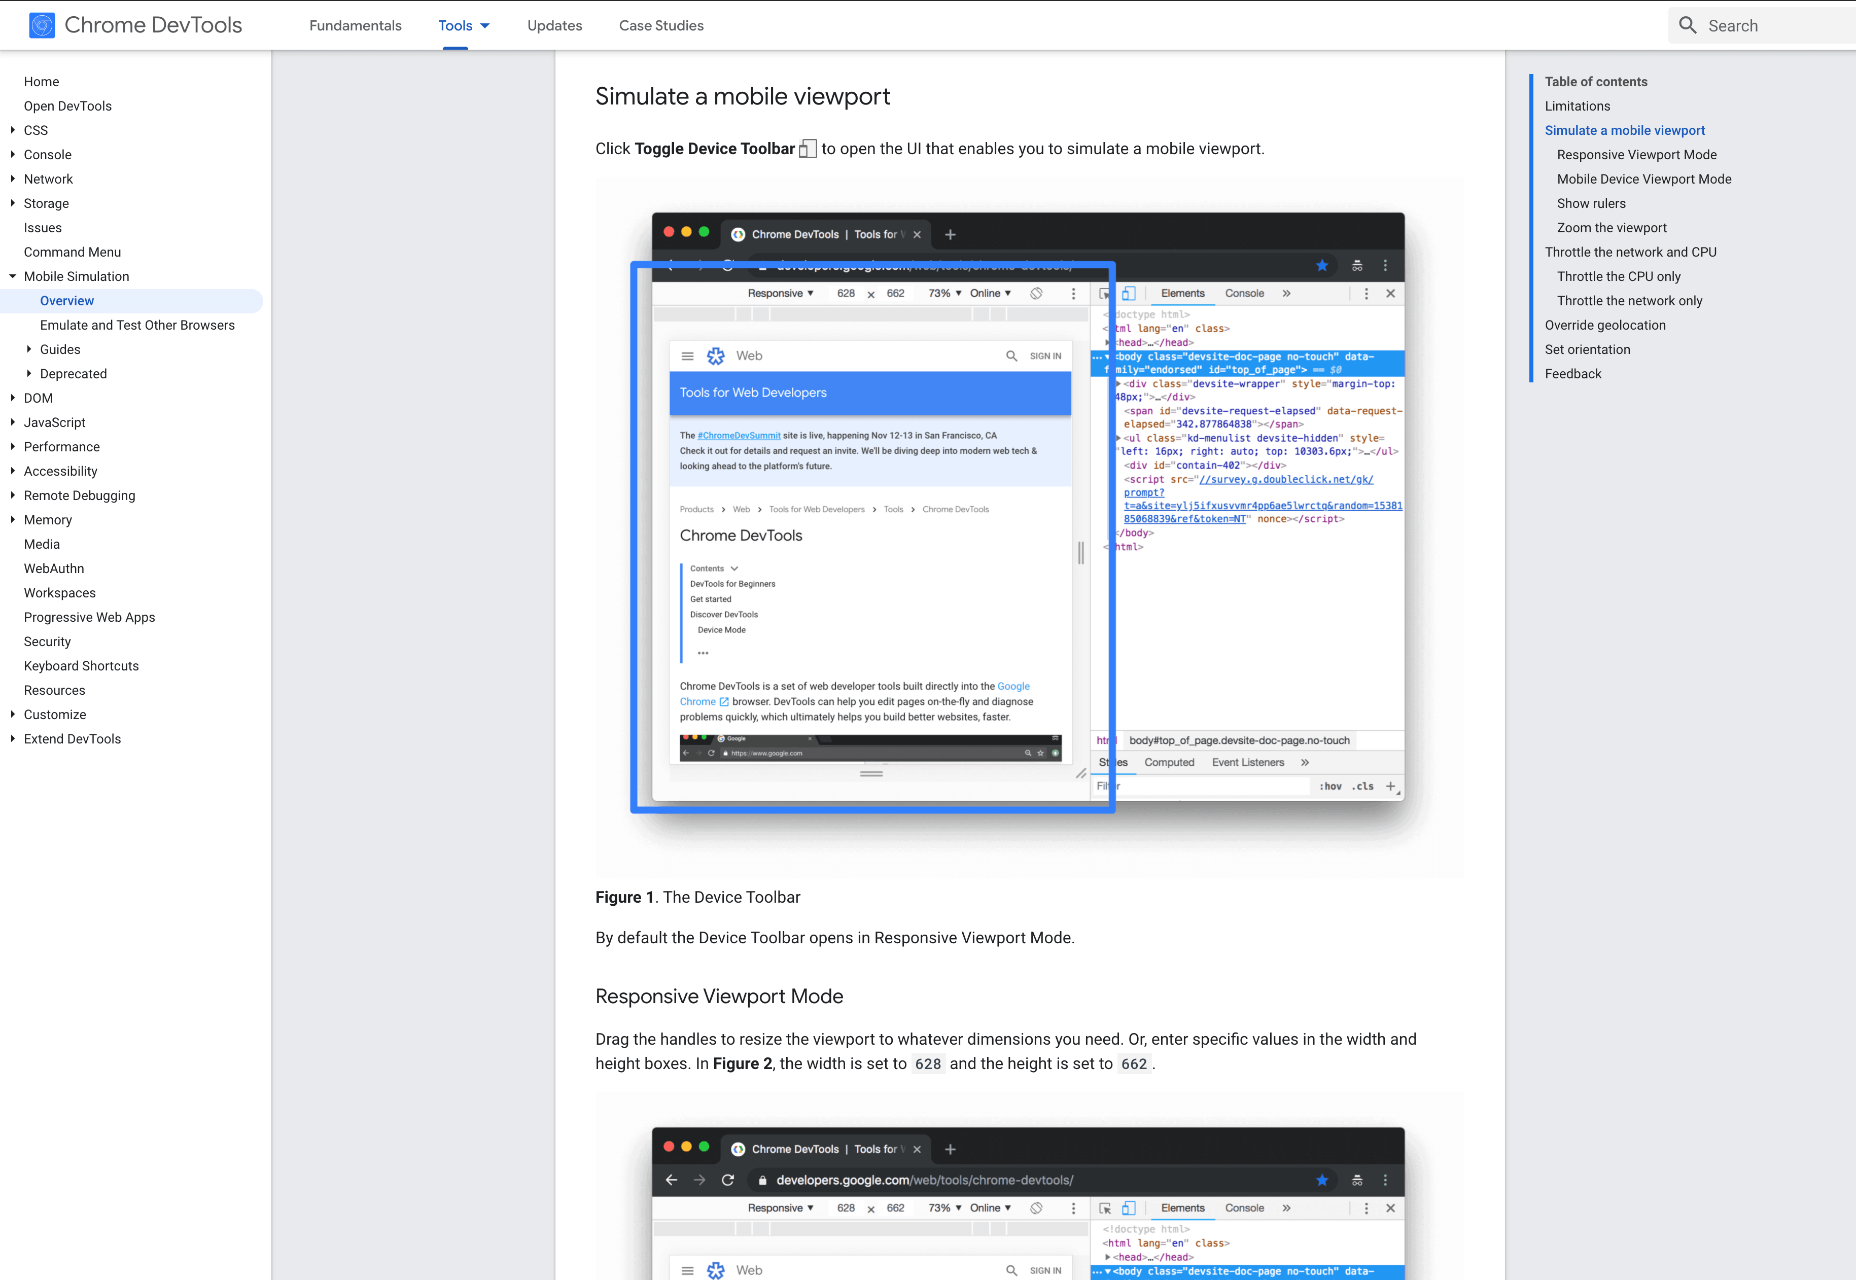
Google Dev Tools is one of the most commonly used free tools. Add it to Chrome, and you can see how your site looks in a multitude of different screen sizes and resolutions. You can simulate touch inputs, device orientation, and geolocation to test how they work. It’s great to easily spot problems using their remote debugging tool to view, change, debug and profile a page’s code directly from your laptop or computer while viewing it on your mobile device.

4. Browser Stack

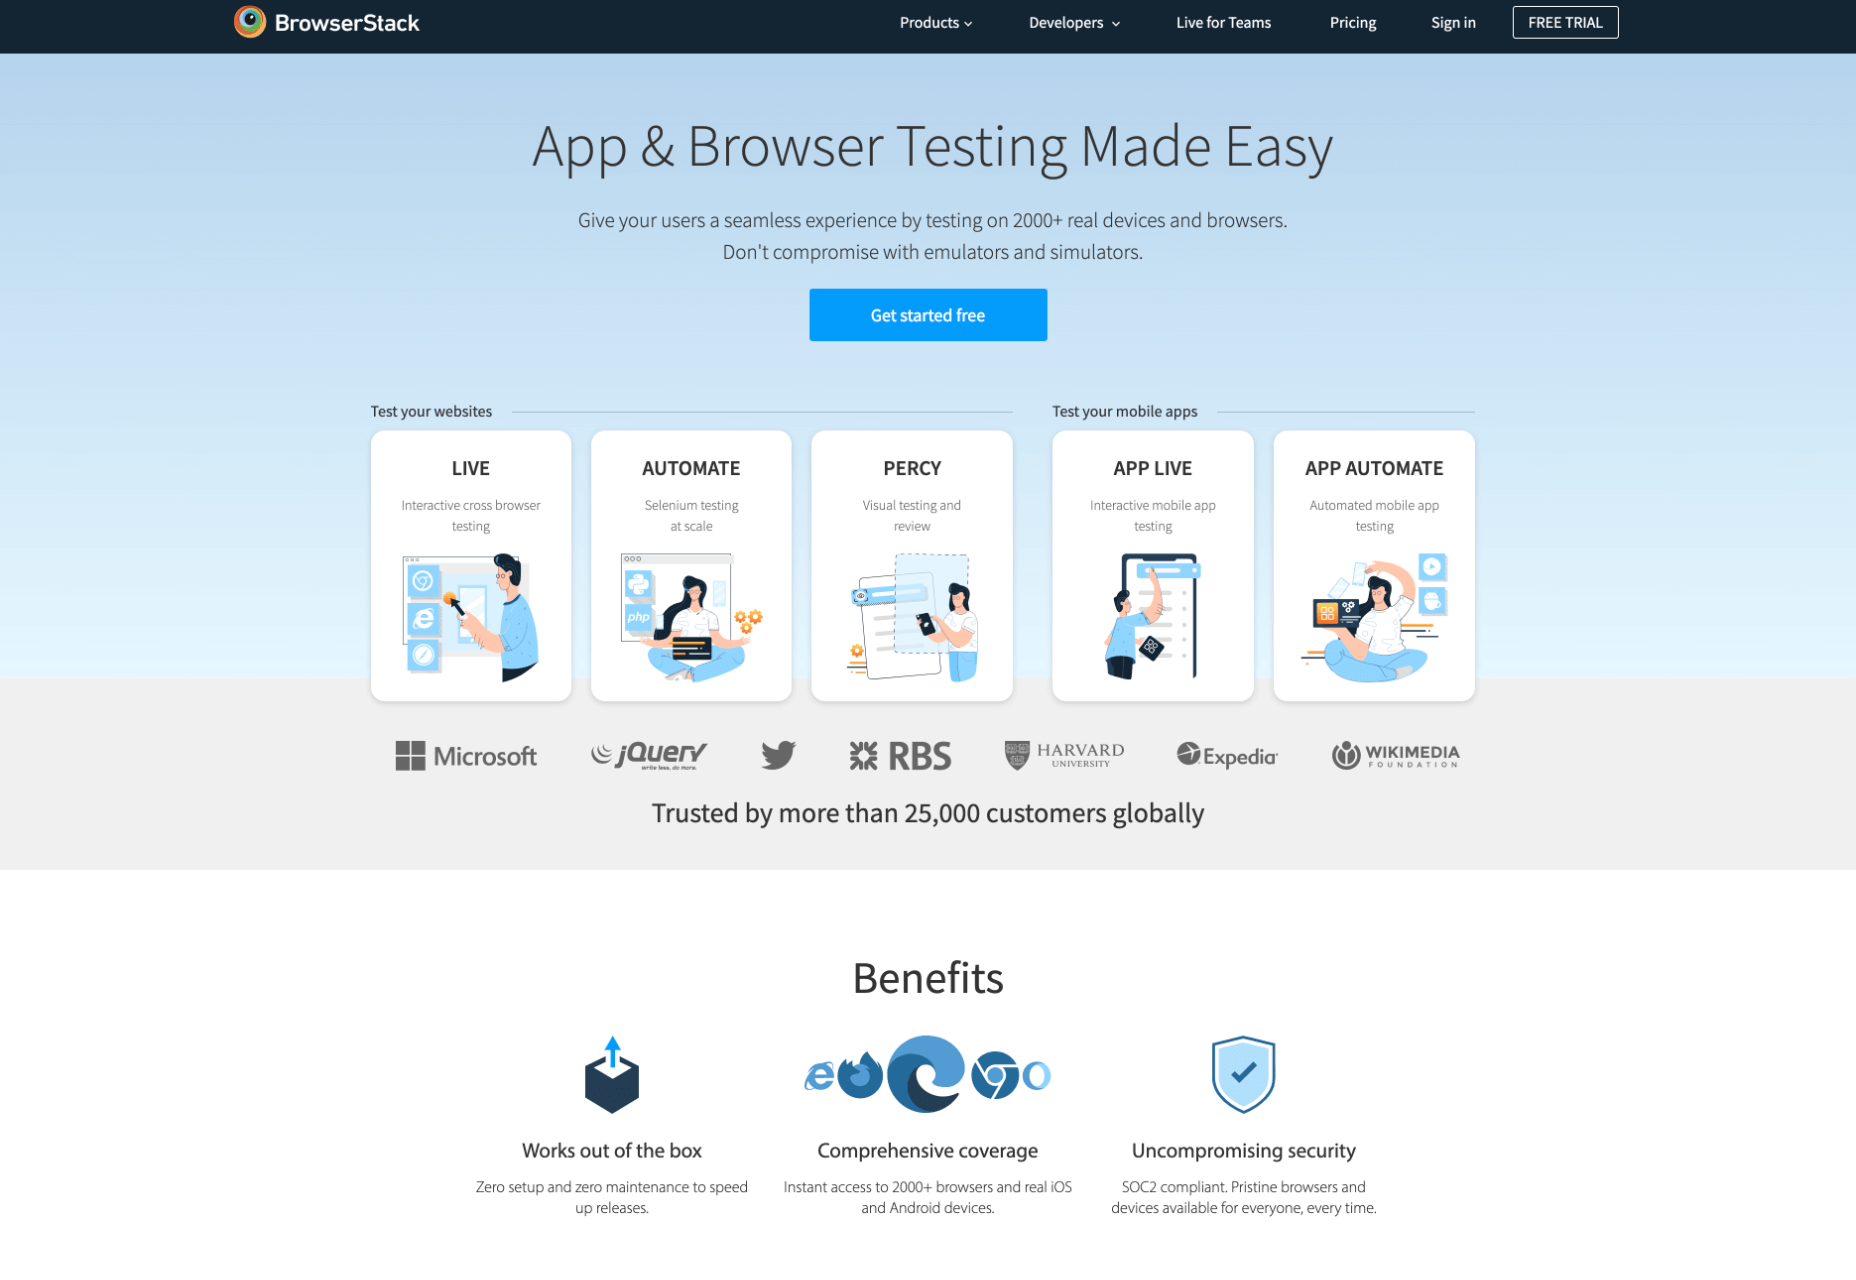
Browser Stack allows you to test your site on over 2,000 real devices and browsers, enabling you to see in real-time how your site looks. It is no hassle to set up, and it can be seamlessly integrated into your setup. As it tests on real browsers on real machines, you know the results are more reliable and accurate. It also enables you to debug in real-time using their pre-installed developer tools for ease of editing. The tests are all run securely on tamper-proof physical devices and are wiped clean of all data after each session, so you don’t need to worry about security being compromised.

5. TestComplete Mobile

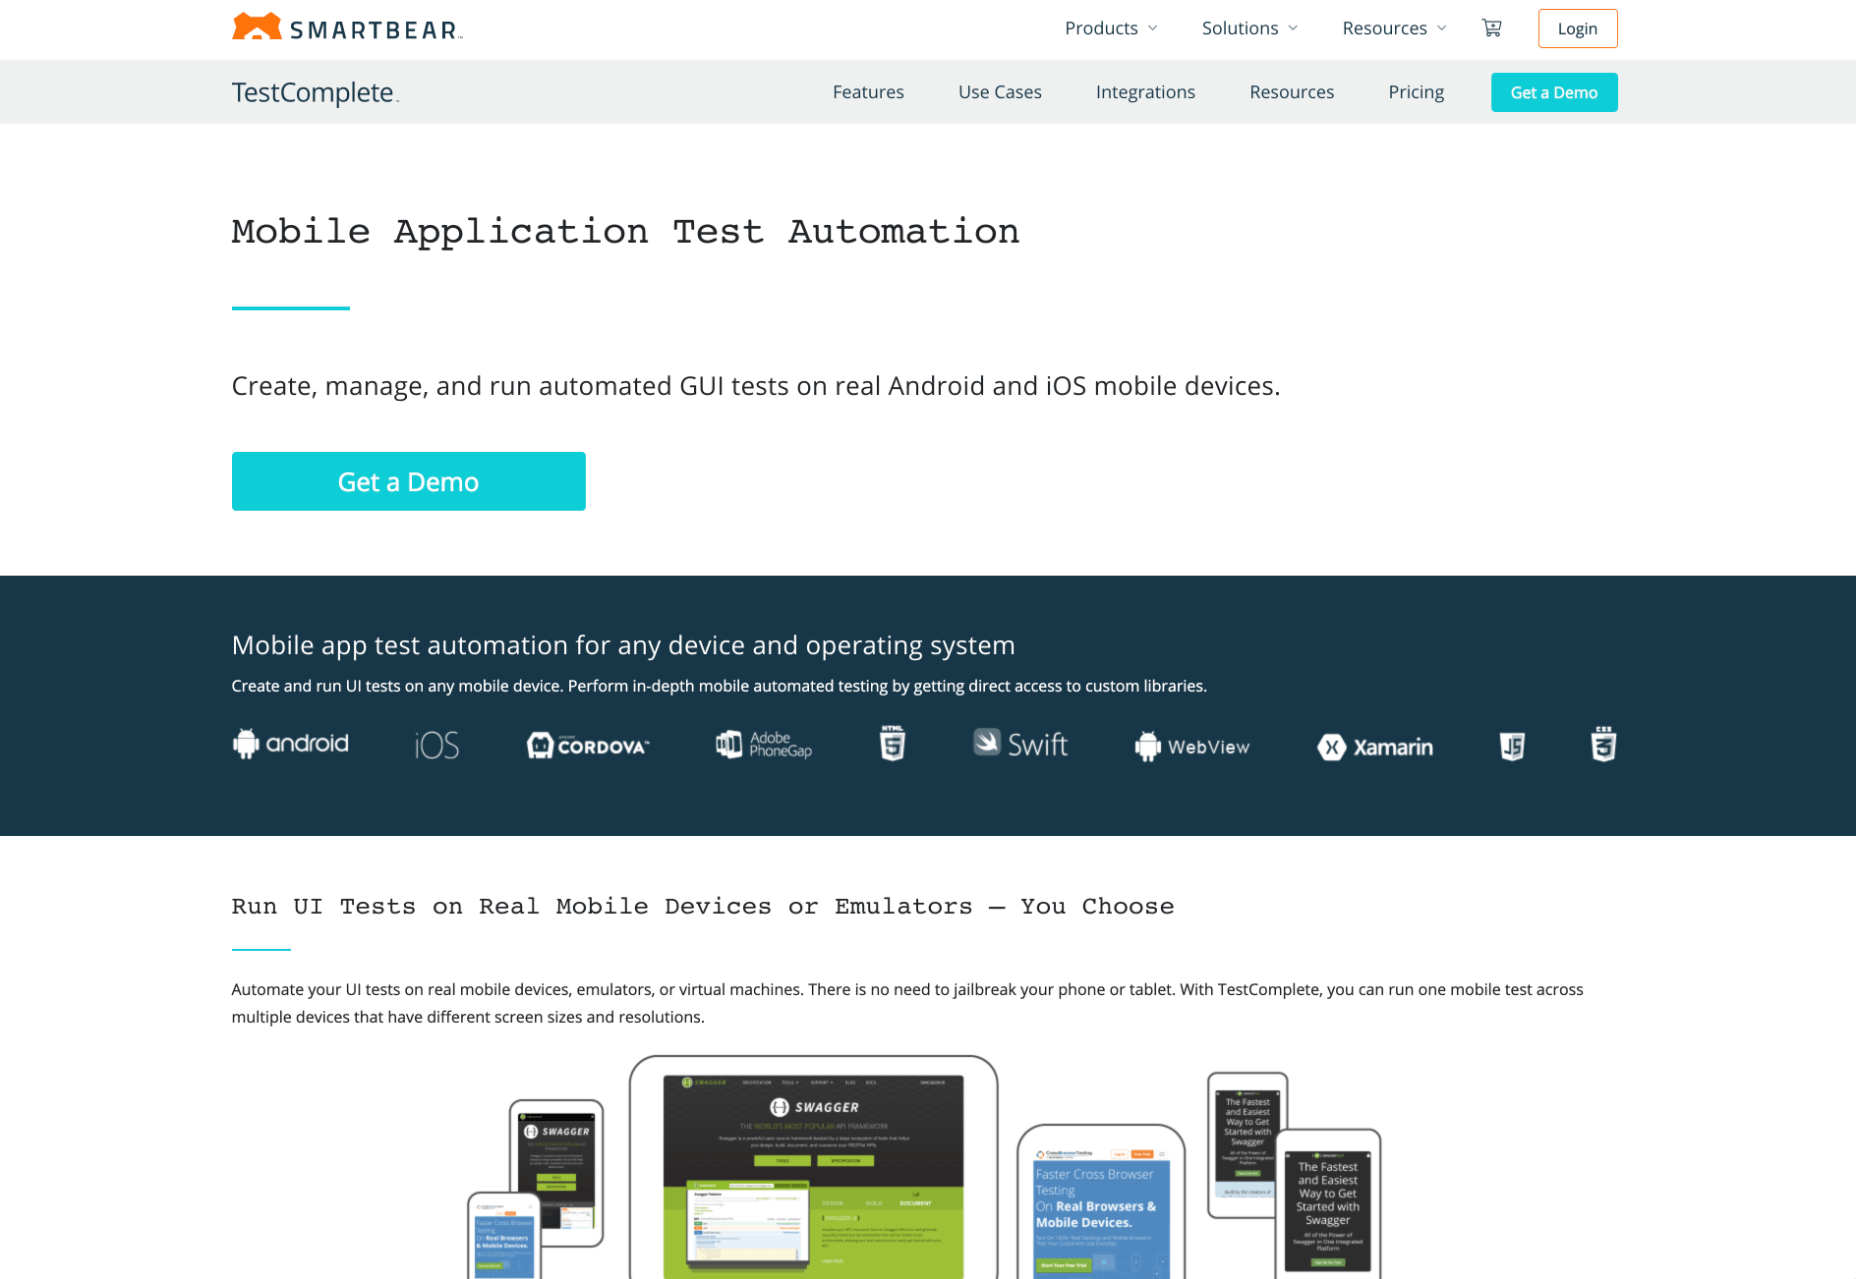
TestComplete Mobile allows you to create and run UI tests across real mobile devices, virtual machines, and emulators. You can test both mobile device layouts and apps with script-free record and replay actions. This can help you to edit and fix any potential issues that may arise during the tests. Due to them being conducted on real devices, you know it is less likely to have errors in the system than a simulated device. This is free for 30 days then can get pricier, so make sure you take advantage of the trial and try the service before committing to it.

6. Sizzy

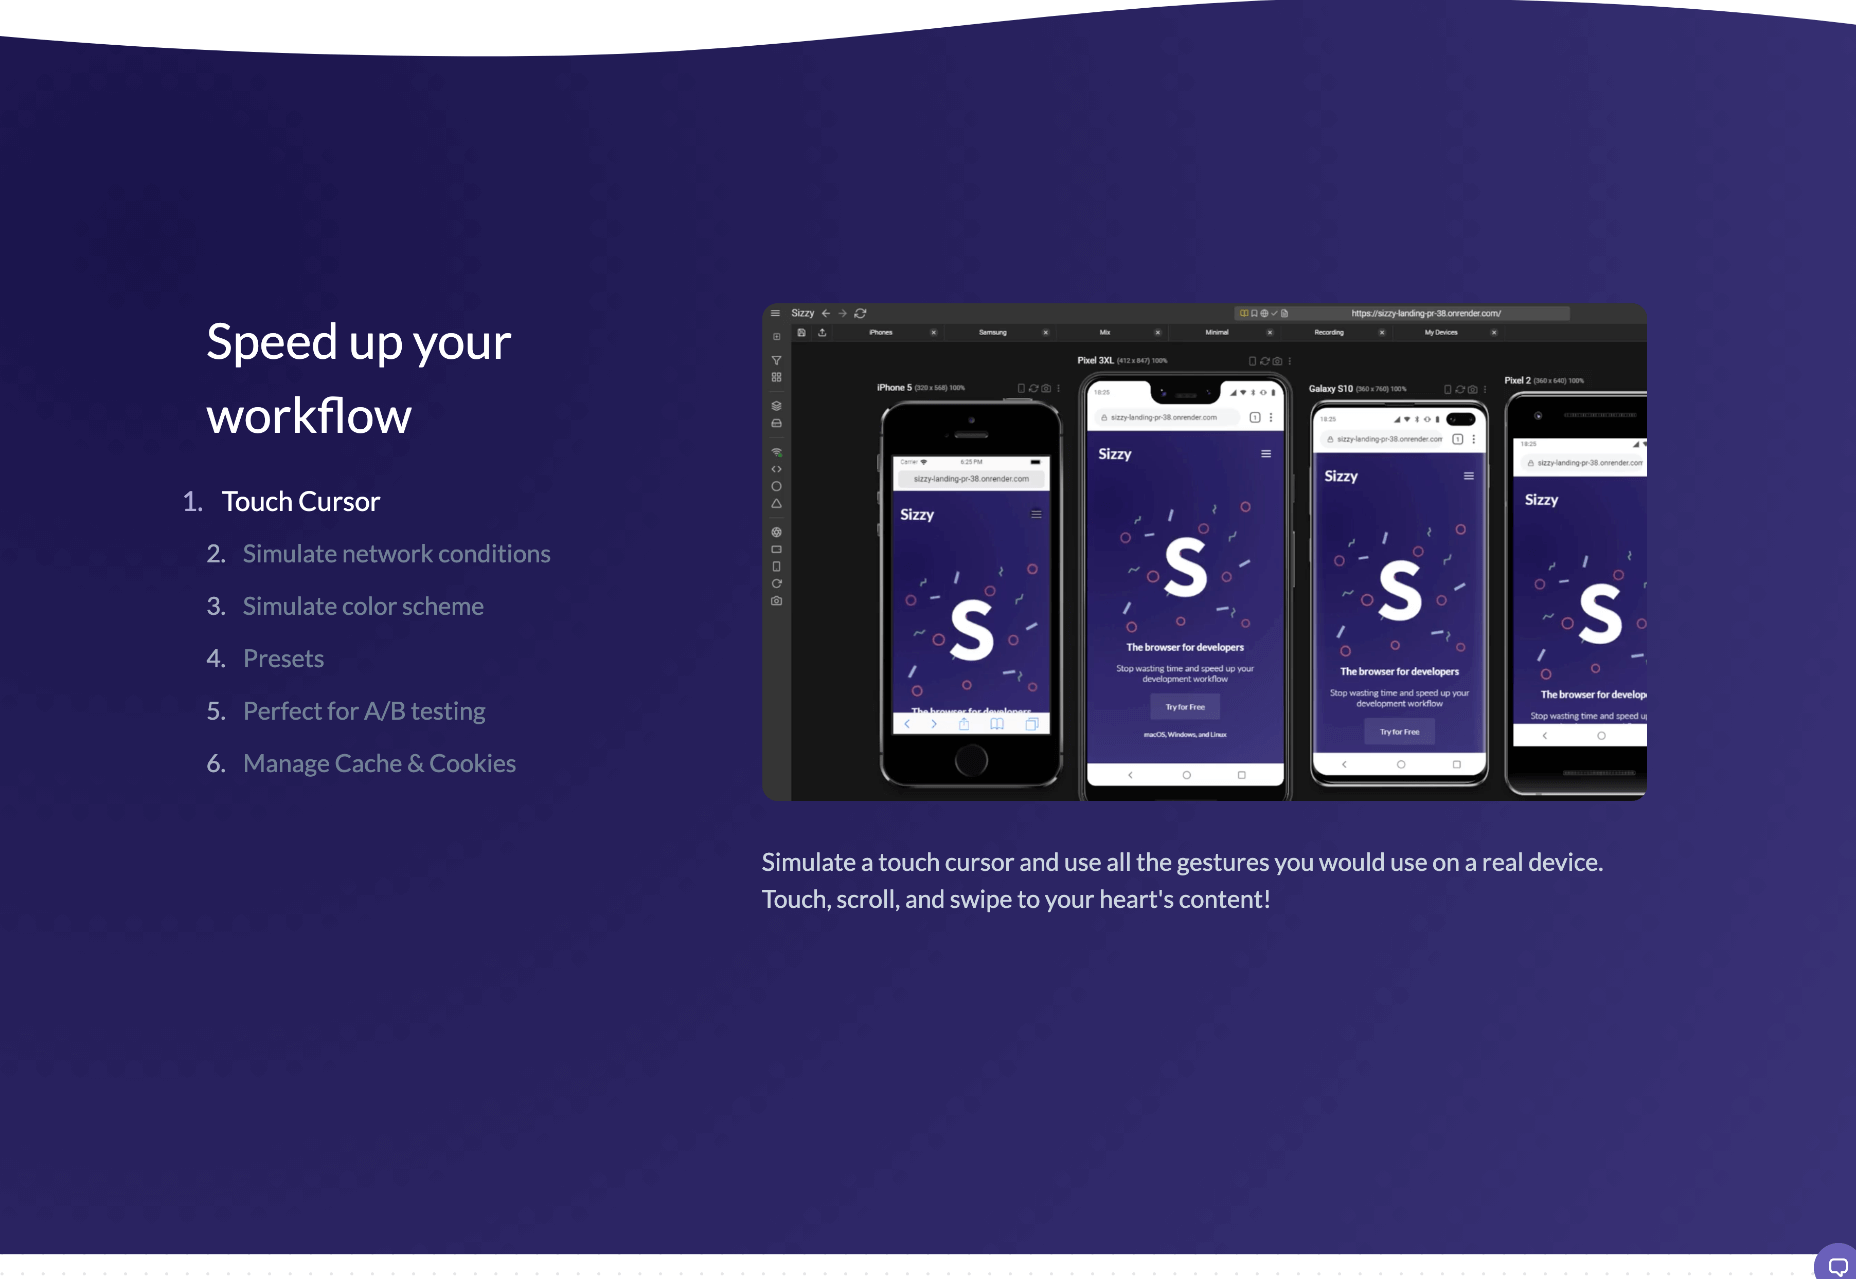
Sizzy is a great tool for checking sites, and it has a host of features to assist you. You can rotate the screen between portrait and landscape, filter by OS and device type, switch themes, and take screenshots. These little things mean it’s a super easy to use and convenient tool. It claims to simulate each device’s viewport and user agent, meaning the results are the same as what you would actually see on that phone/ tablet, etc. It can’t simulate different browser rendering engines however, so there’s a chance there might be some minor differences compared to the actual thing. Sizzy offers a free trial or has different price packages starting at $5 per month.


Featured image via Unsplash

Source

The post 6 Tools for Rapid Cross-Device Website Testing first appeared on Webdesigner Depot.


Source de l’article sur Webdesignerdepot

The end of the year tends to be busy for a variety of reasons and it can limit some of the freshness we see in designs during much of the year. Regardless, there are a few trending design elements.
What we are seeing right now is rooted in deep simplicity with a focus on the message.

Here’s what’s trending in design this month…

Activism and Engagement

Websites with a focus on societal issues have moved to the forefront. While the look and design techniques used for these websites can vary greatly, there’s a common theme of activism, community engagement, and support.

What’s great about this movement – and what it reflects – is that people can take to the digital space to help amplify their message or find support with people who are going through the same things they are.

While some of these efforts are backed by people and brands you may know, that’s not always the case.

The designs also work best when they reflect the personality of the spokesperson or mood of the issue at hand. Note the vast differences in the three examples.

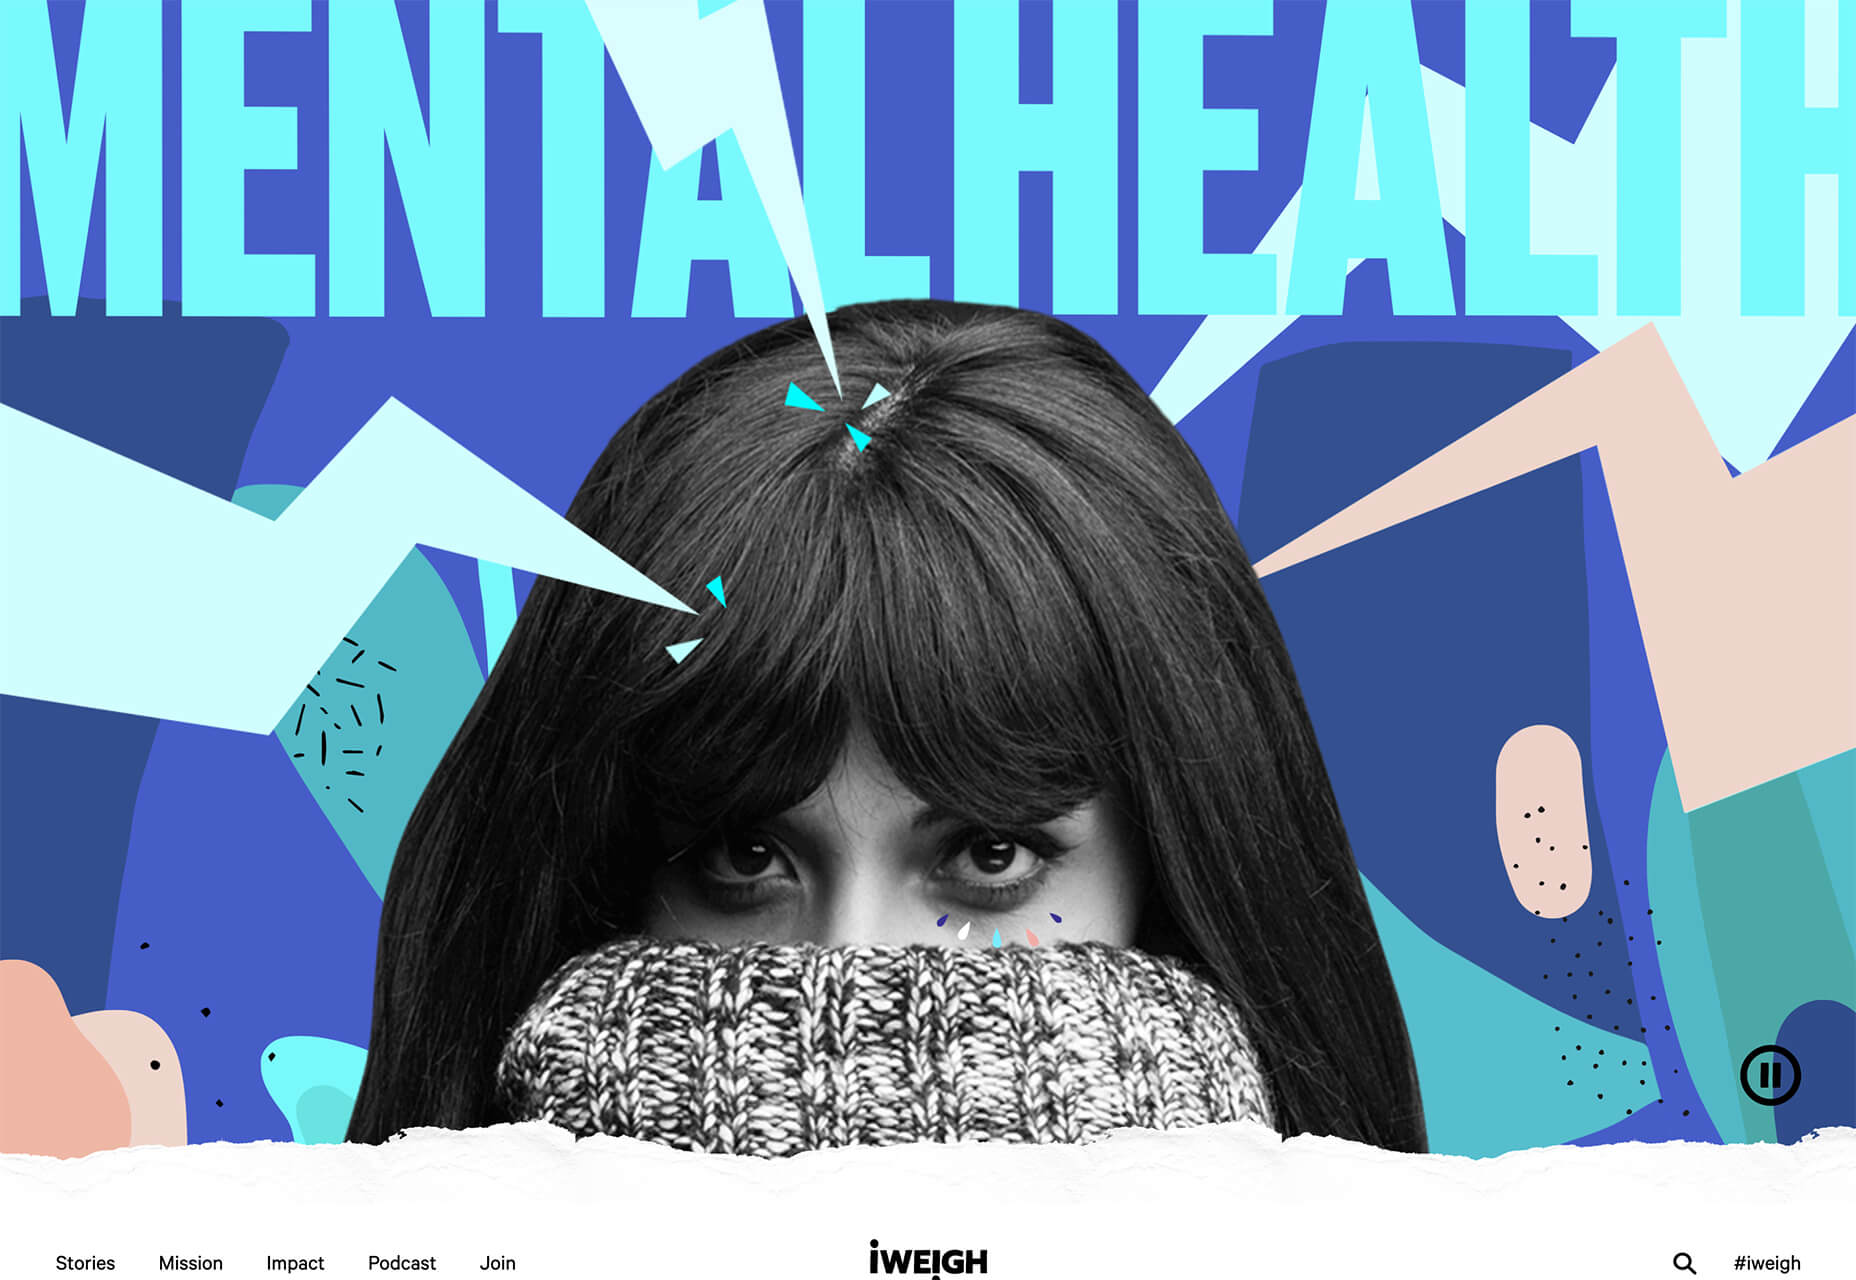
The I Weigh Community uses bright color with a black and white image of promoter and celebrity Jameela Jamil to bring attention to mental health issues.

Wear the Waste by retailer H&M uses simple typography in a natural environment to set the stage for more eco-friendly clothing options.

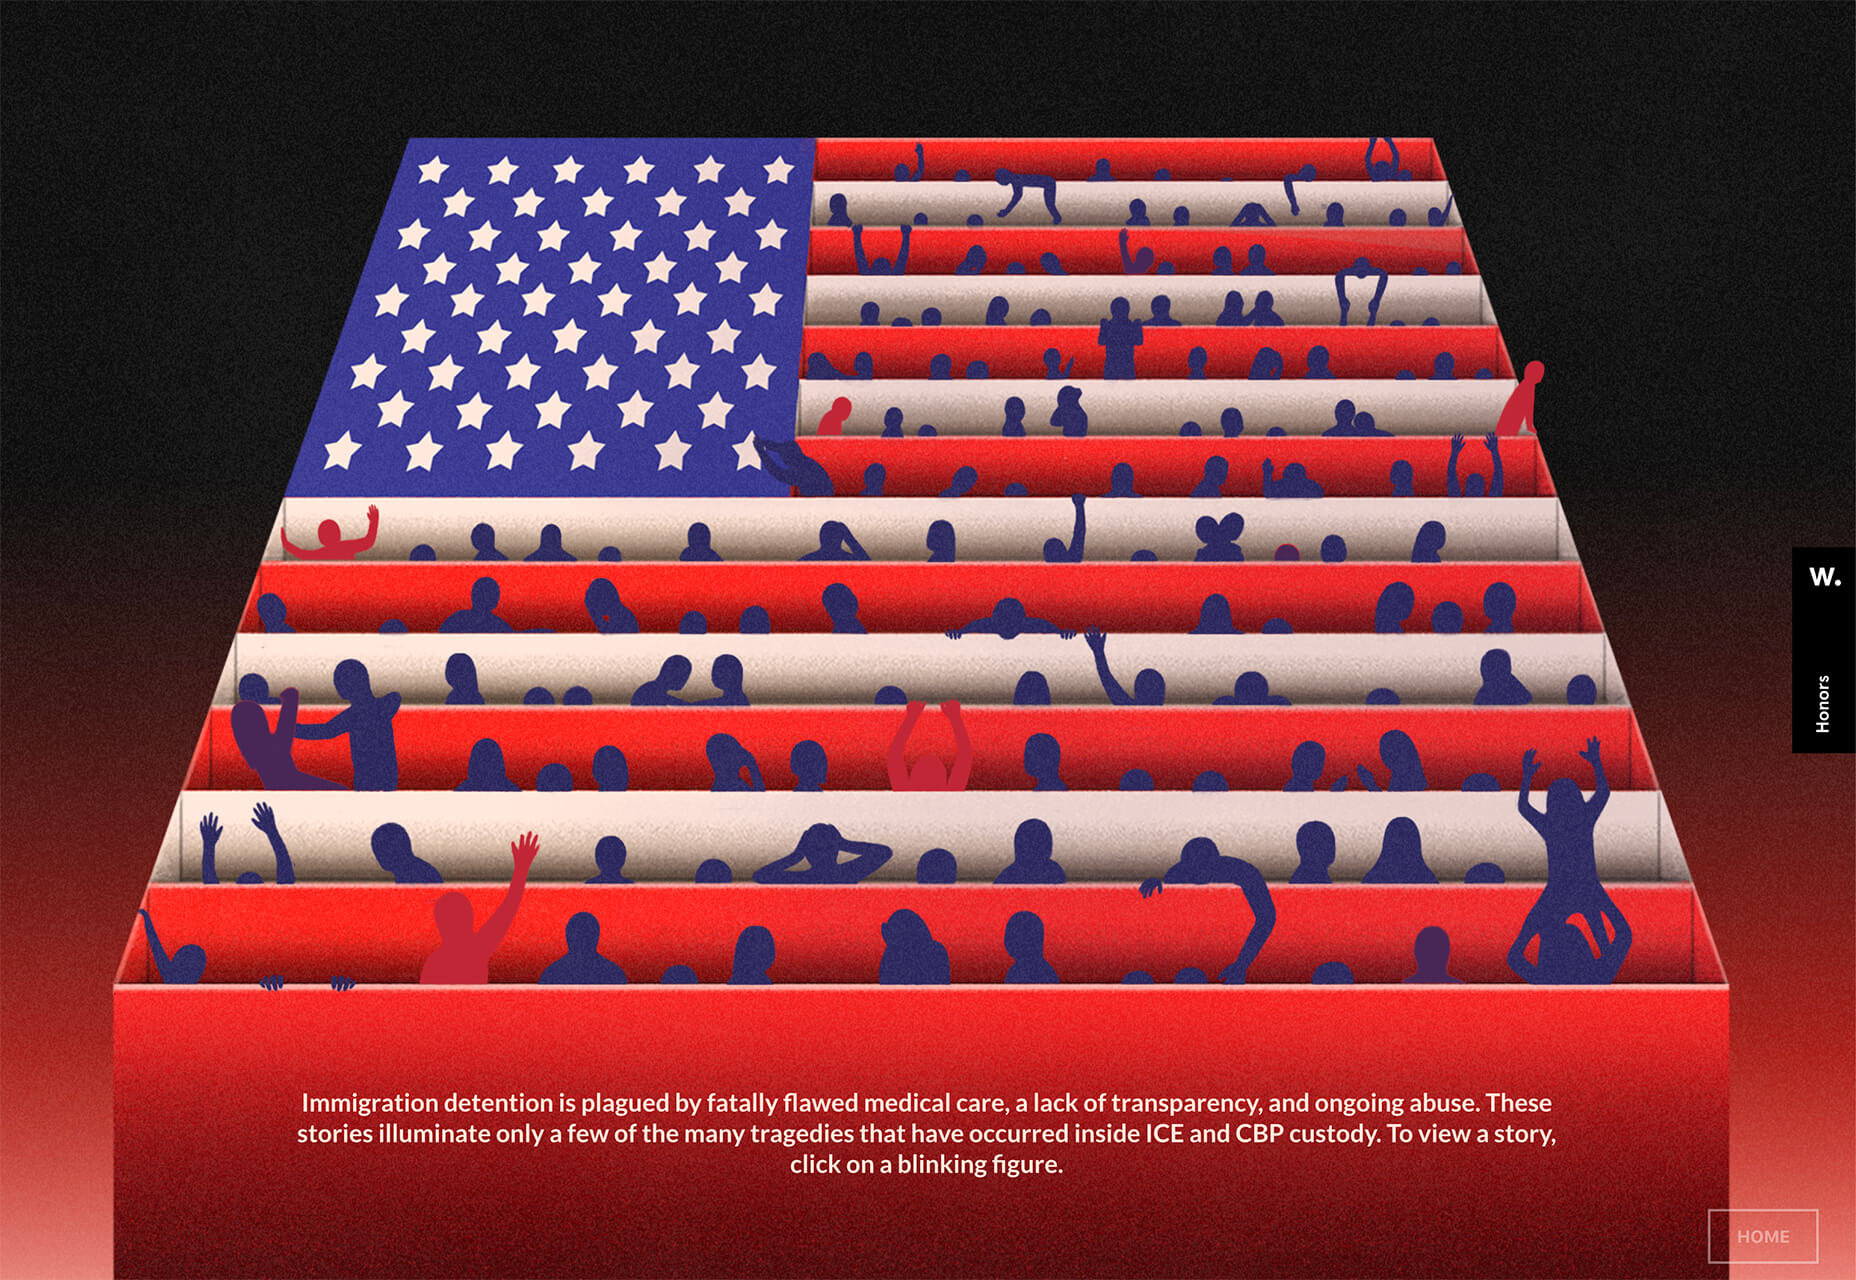
Wavering Stripes uses an illustrative approach to bring attention to the stories of immigrants in detention.

Each design is vastly different but all are striking and draw attention to the causes therein. The common thread is that each design is simple enough to draw you in and help you better understand the message and not get lost in tricks or design effects.


In Your Face Products

’Tis the season for product promotion.

Designers are opting for larger-than-life product images that allow shoppers to see every detail before making a purchase. (Seems like a good plan in a socially-distanced pandemic world.)

It can work in a number of ways:

  • With an oversized image and ability to use on-screen controls to take a closer look;
  • With video and animation effects to see the product in action;
  • With super high-resolution and zoomed in photography.

Pair these visuals with strong descriptive language and you’ve got a winning combination.

The variance in the examples is a good showcase of how to do this well, while not over-doing effects.

The Fitbit Charge 4 website uses an opening image of the device that’s way larger in scale than reality (especially if you are on a large desktop screen). Users control using click and scroll to get more views and details of the device. Zoom and animation aren’t overwhelming, providing a solid look at the product.

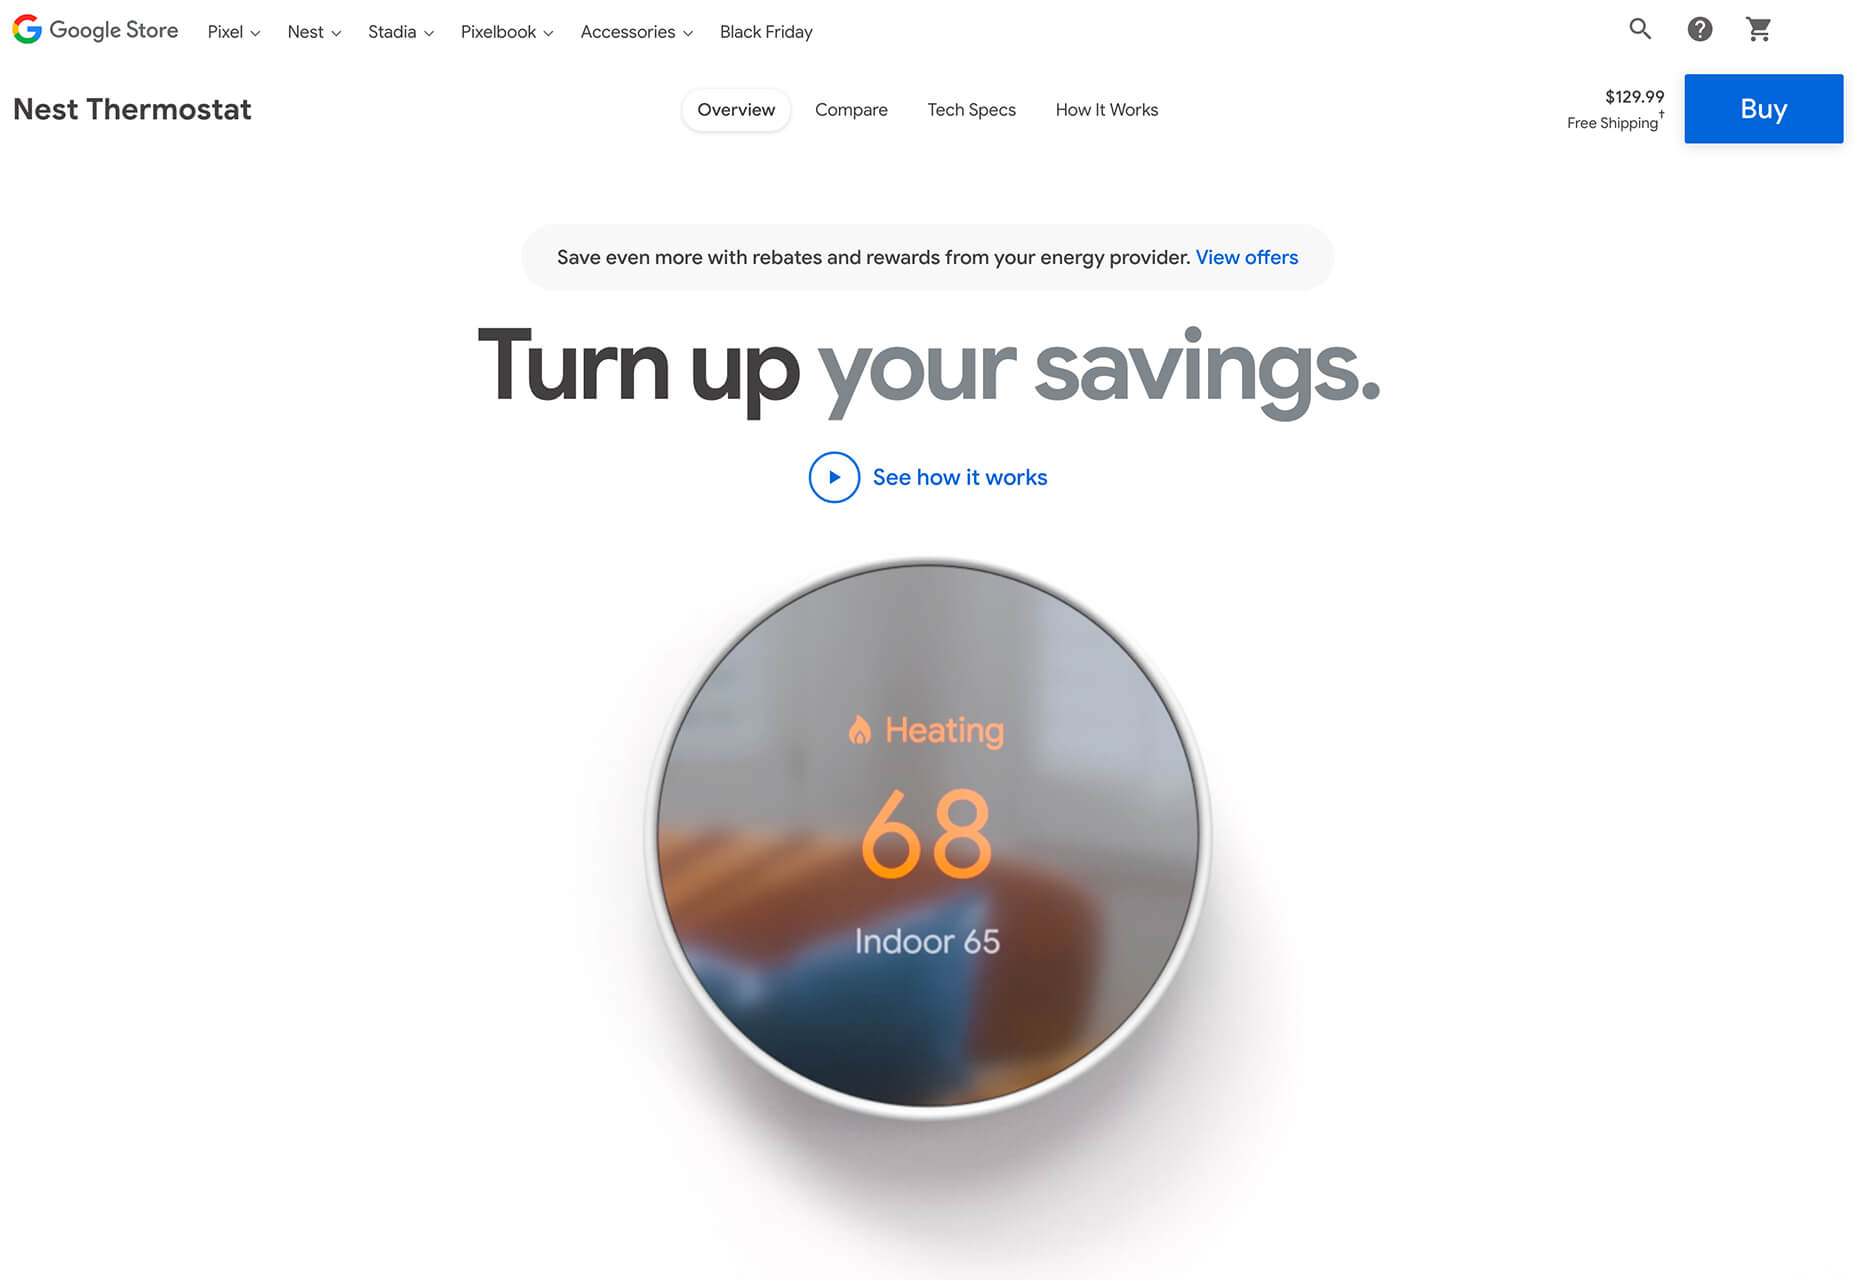
The Nest Thermostat opens with a video animation of the device moving into the forefront of the screen. (It’s rather quick.) From there, if you want more detail, there’s a video to watch that provides deeper product information in a digestible manner.

The final example isn’t really a product at all, but rather an art installation. What’s interesting is that it uses these same oversized options to show the art in detail. This is a great way to handle seeing something that you may not be able to experience in person. What makes it work so well is that the angles of the photography mimic how you would view it, looking up toward the piece hanging from the ceiling.


Simple Motion for Impact

Carrying on the theme of big, bold, and oversized designs, this trend focuses on simple animation for maximum impact.

While all-out cinematic animation can be fun to watch, it can be a little overwhelming at times. This more subtle approach is easier to digest and helps put the focus on the content at hand rather than the effect on the display.

There are plenty of ways to use simple animated effects, including scrolling animations, hover actions, and constantly moving elements. (You can see each of these if you click through the examples.)

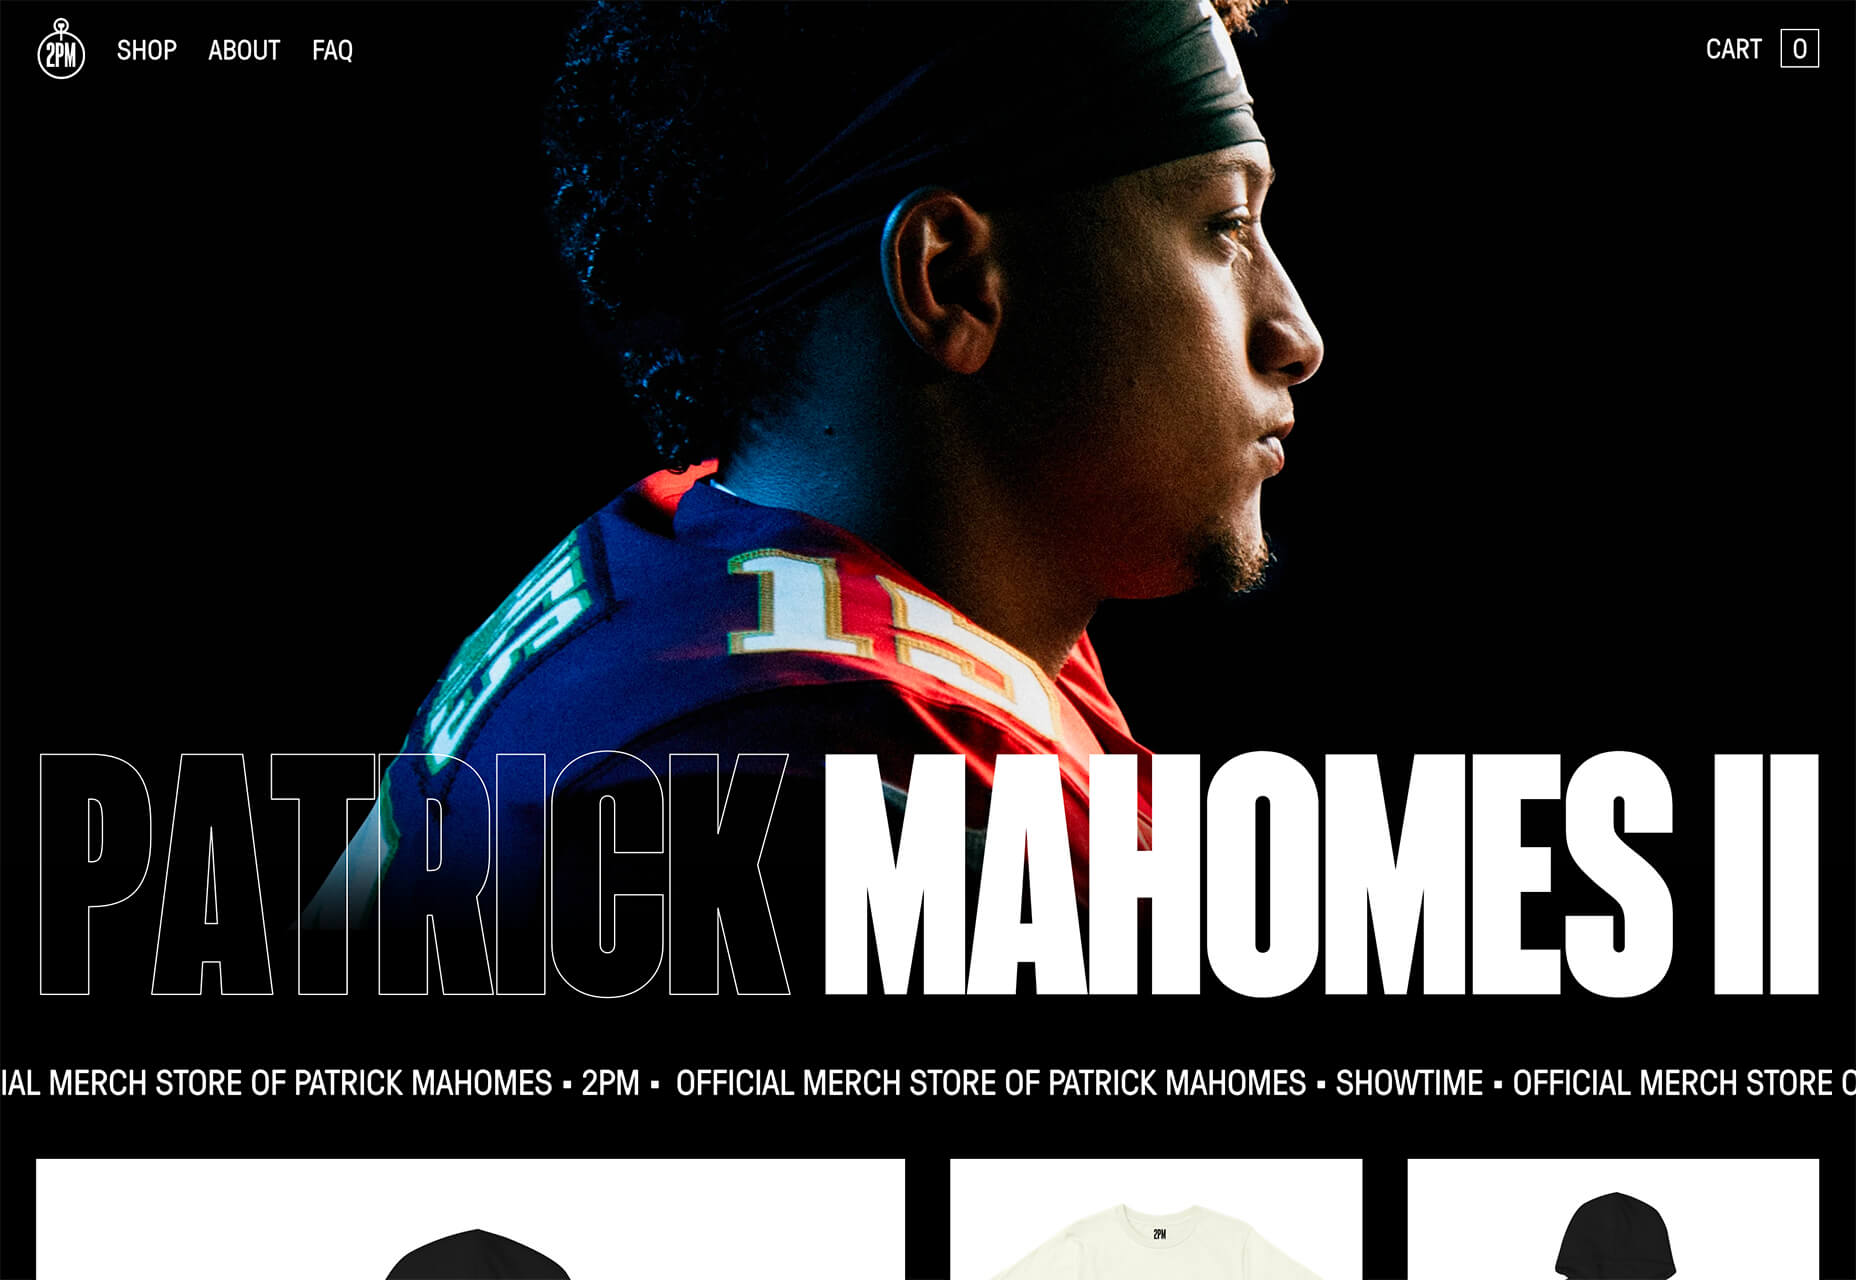
The Patrick Mahomes store, 2PM, uses a single line of moving text that tells you what the website is about. It differentiates the retail store website from information about the athlete or his other efforts. White text on a black background is classic and easy to read. The most important thing of note may be the speed of the animation; it’s timed in a way that’s scannable but not dizzying. Sometimes the hardest part of nailing an animation is getting the speed right.

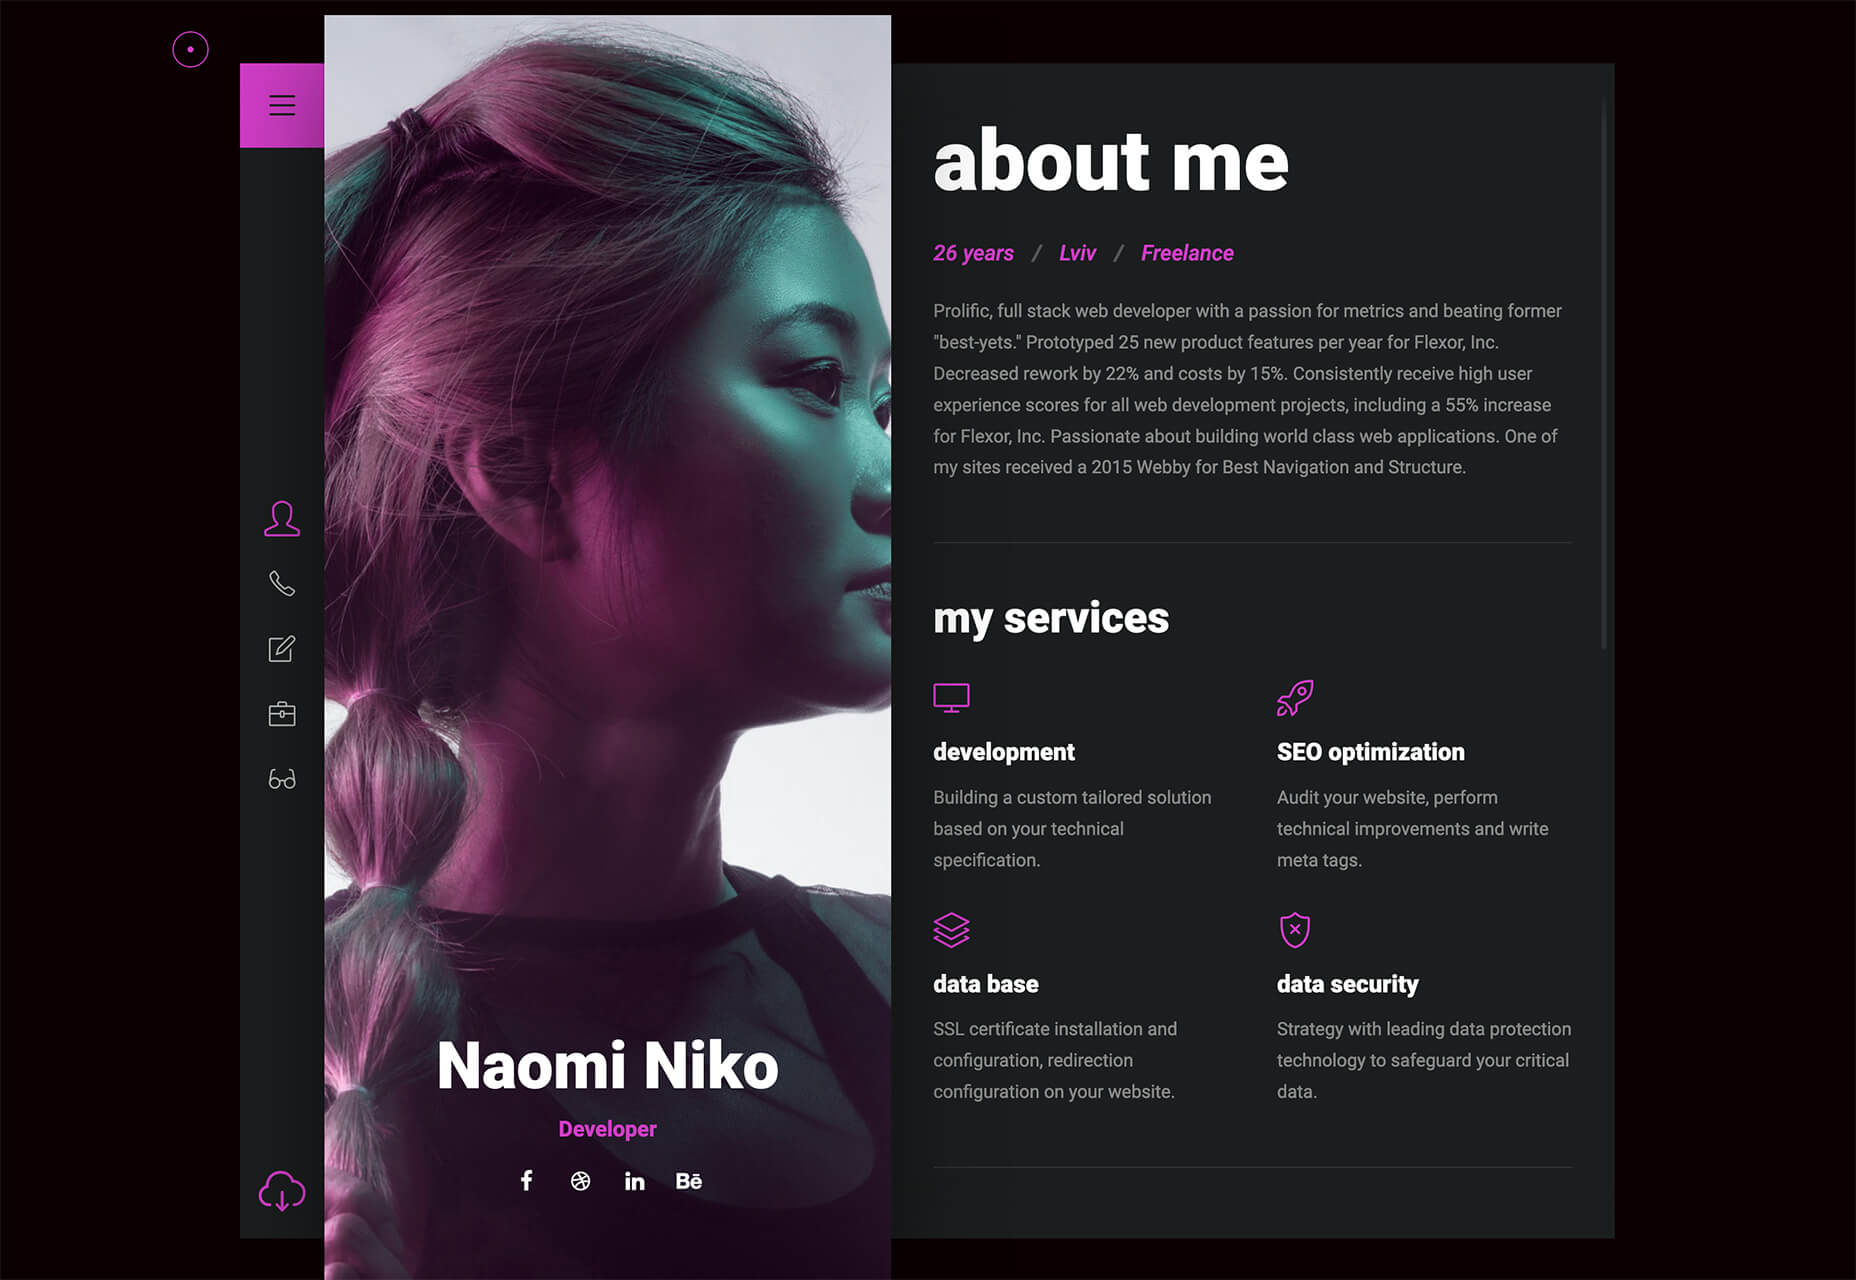
The resume-style website for Naomi Niko is striking and simple, but neat hover effects and a simple scroll animation for her resume only – and not the photo or details on the left side of the screen – make the design intriguing. The almost awkward crop and directional pull of her image also creates interest and makes you want to get further into the design.

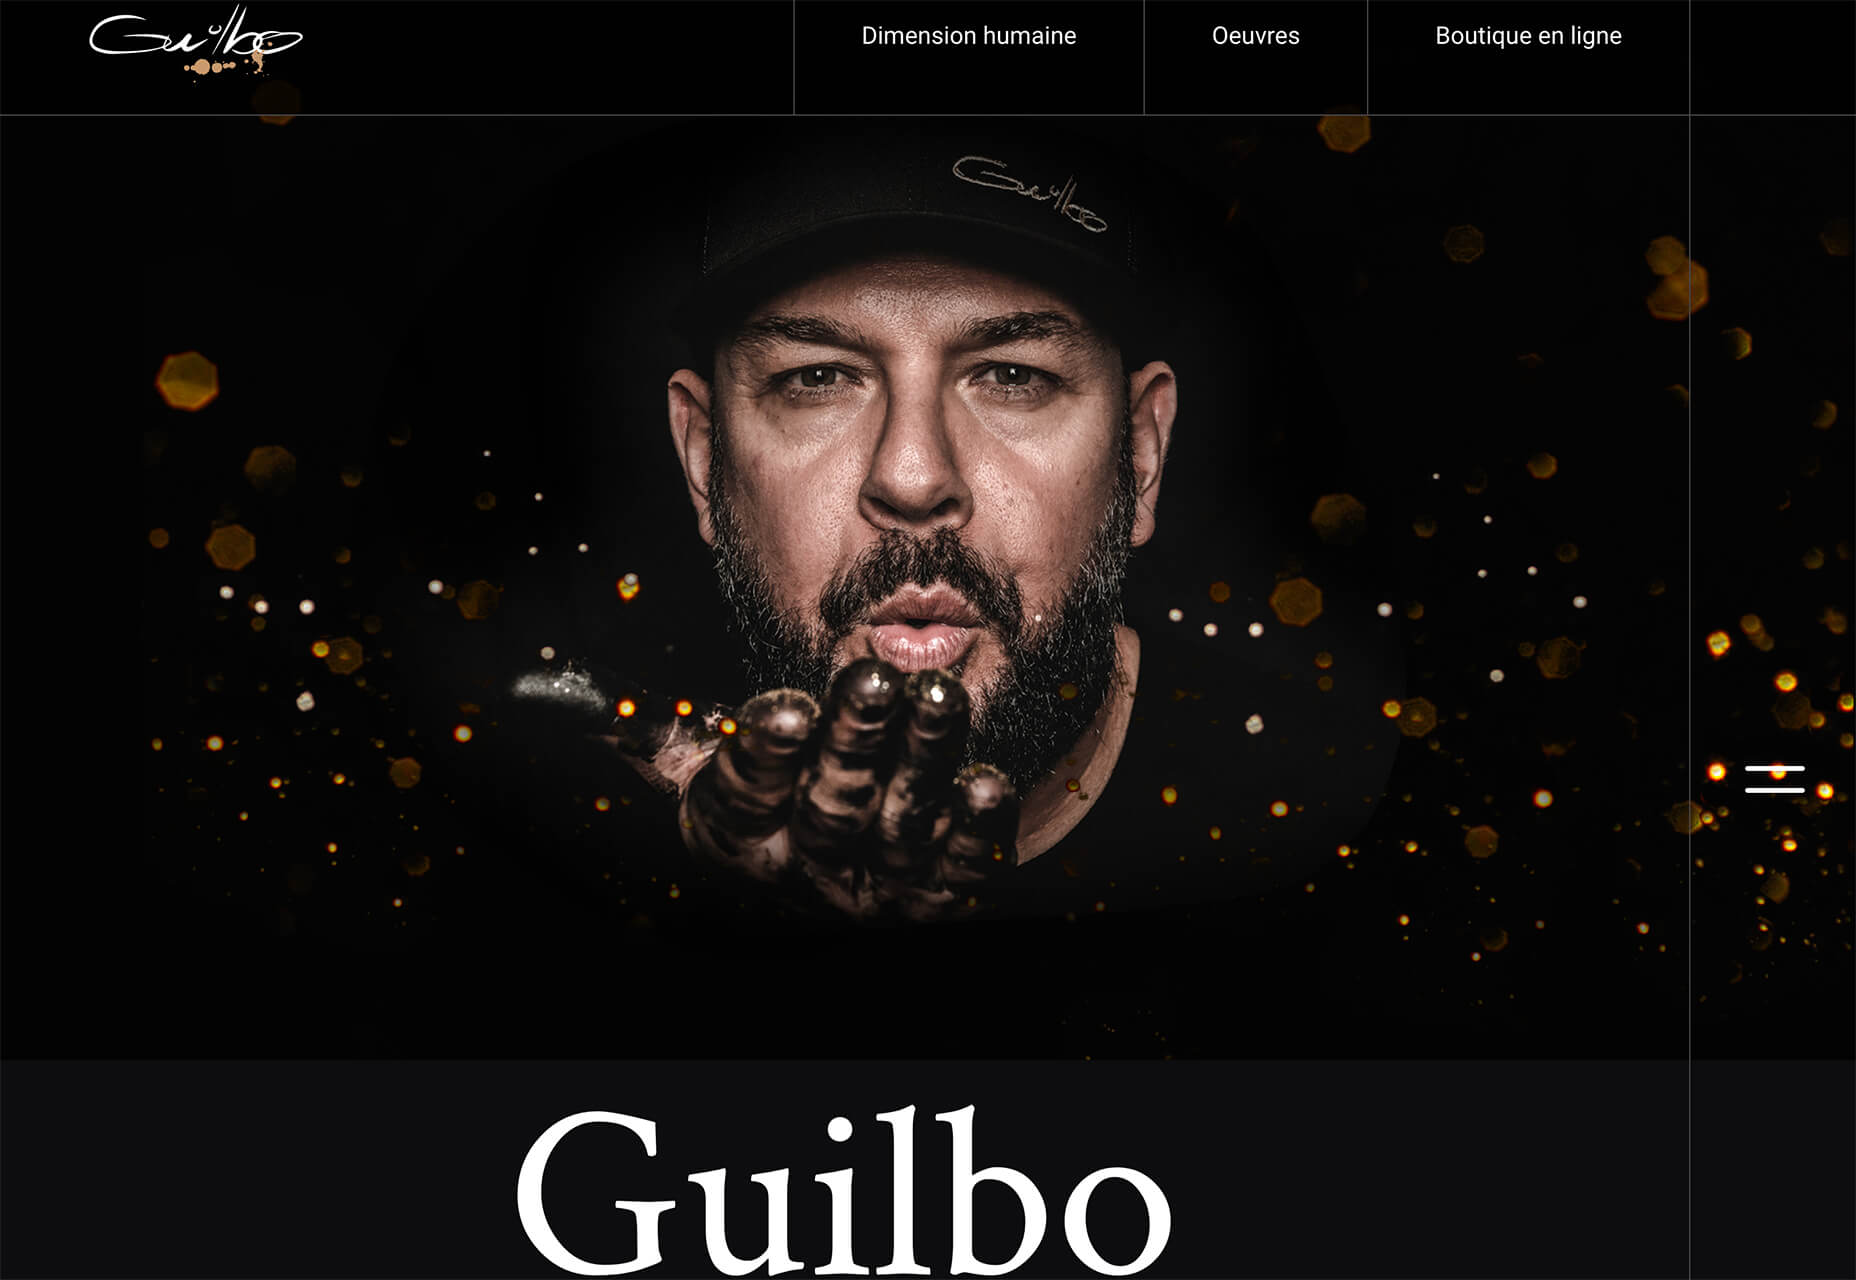
Guilbo uses layered hover animation to make it look like he’s blowing a glittery-dust off the screen and at the user. The rugged detail of his face with the sparkle of the animation is a fun contrast. The design uses layering with dots in the foreground and background for an additional depth effect. It’s also especially nice that the objects are made to stay off his face for a realistic effect.


Conclusion

While 2020 has been an interesting year, designers have continued to find new ways to evolve the craft and create visual experiences that are inspiring. These trends are no exception.

It shows that even in unusual circumstances or with odd constraints, that amazing work and creativity can thrive. Stay creative everyone, and keep those new designs – and potential trends – coming!

Source


Source de l’article sur Webdesignerdepot