As the author of GCeasy – Garbage collection logs analysis tool, I get to see a few interesting Garbage Collection Patterns again and again. Based on the Garbage collection pattern, you can detect the health and performance characteristics of the application instantly. In this post, let me share a few interesting Garbage collection patterns that have intrigued me.
1. Healthy Saw-tooth Pattern
![Fig 1: Healthy saw-tooth GC pattern]()
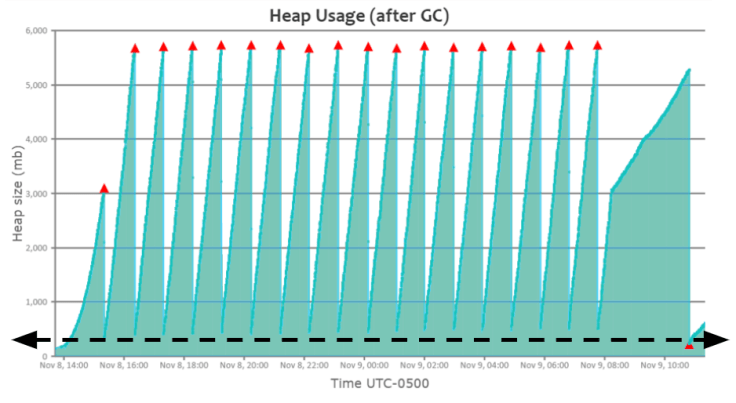
You will see a beautiful saw-tooth GC pattern when an application is healthy, as shown in the above graph. Heap usage will keep rising; once a ‘Full GC’ event is triggered, heap usage will drop all the way to the bottom.