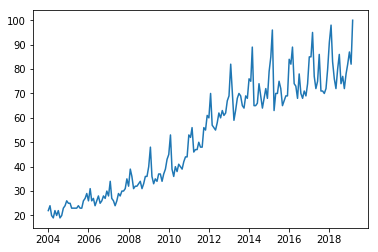
The trend of time series is the general direction in which the values change. In this post, we will focus on how to use rolling windows to isolate it. Let’s download the interest in the search term Pancakes from Google Trends and see what we can do with it:
import pandas as pd
import matplotlib.pyplot as plt
url = './data/pancakes.csv' # downloaded from https://trends.google.com
data = pd.read_csv(url, skiprows=2, parse_dates=['Month'], index_col=['Month'])
plt.plot(data)
Looking at the data we notice that there’s some seasonality (Pancakes Day! Yay!) and an increasing trend. What if we want to visualize just the trend of this curve? We only need to slide a rolling window through the data and compute the average at each step. This can be done in just one line if we use the rolling method:


Laisser un commentaire
Participez-vous à la discussion?N'hésitez pas à contribuer!