Overview
Monitoring metrics is highly important to operate distributed systems in production. Alluxio collects metrics using the Codahale Metrics Library on I/O throughput, RPC throughput, and resource usage. Alluxio metrics are shown in its webUI but are also available through a REST endpoint or exportable to several third-party sinks in a time-series manner (see docs).
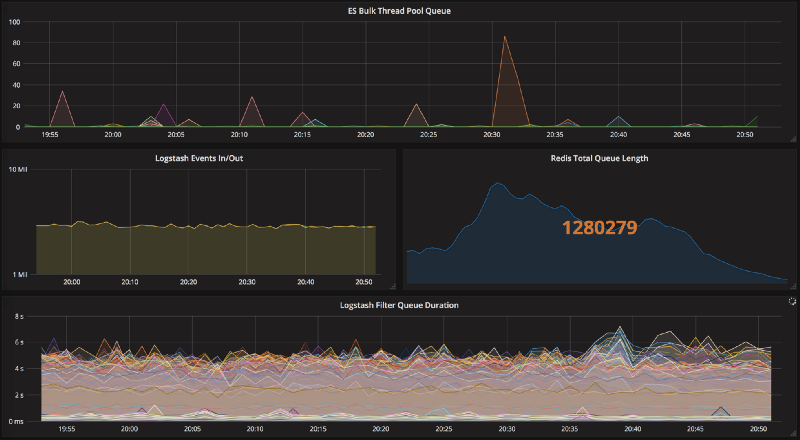
Grafana, a comprehensive metrics visualization software, ties into this process by pulling the metrics that systems like Alluxio collect through a sink and visualizes them in a more helpful fashion. This guide will cover how to set up Grafana and Graphite, a supported sink for Alluxio, which will put metrics in a time-series database, along with exploring some of the possibilities that the combination offers.


