Articles

You might have heard about the K8ssandra project and want to start contributing, or maybe you want to start using all of its features. If you aren’t familiar with K8ssandra (pronounced like “Kate Sandra”), you can read this overview before digging into the developer activities in this post.

In a nutshell, K8ssandra is an open-source distribution of Apache Cassandra™ for Kubernetes, which includes a rich set of trusted open-source services and tooling. K8ssandra comes with handy features that are baked-in and pluggable, which allows for flexible deployment and configuration.

Source de l’article sur DZONE

Misconfigurations are the leading cause behind security incidents in Kubernetes-orchestrated or otherwise containerized environments. Without proper configuration in place, applications would run into problems ranging from noncompliance and inconsistencies to performance bottlenecks, security vulnerabilities, and functionality failure. Therefore, configuration management is a critical component in a software development lifecycle for maintaining systems in a desired, consistent state.

According to Red Hat’s State of Kubernetes Security report, misconfigurations were the leading cause behind security incidents in Kubernetes-orchestrated or otherwise containerized environments. Without proper configuration in place, applications would run into problems ranging from noncompliance and inconsistencies to performance bottlenecks, security vulnerabilities, and functionality failure. This would make cloud-native systems unstable and cause them to become a liability to businesses. For this reason, configuration management is a critical component in a software development lifecycle for maintaining systems in a desired, consistent state. However, the way configuration management is done has been evolving over the years. This post traces the history of configuration management, focusing on how GitOps handles this critical aspect of running cloud-native applications today.

Source de l’article sur DZONE


Introduction: EnRoute Helm Chart

Helm is a popular package manager choice for Kubernetes. Installation of software, managing versions, upgrading versions, and finding charts from the registry are key benefits of Helm.

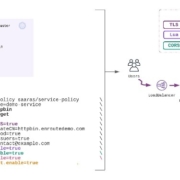
EnRoute helm chart installs the EnRoute Ingress Controller and provides easy configuration options to define policy for a service. The helm chart provides fine-grained control to define L7 policies with its ability to enable/disable plugins for a service using configuration options that can be specified when the helm is invoked.

Source de l’article sur DZONE

Using the Prometheus Operator has become a common choice when it comes to running Prometheus in a Kubernetes cluster. It can manage Prometheus and Alertmanager for us with the help of CRDs in Kubernetes. The kube-prometheus-stack Helm chart (formerly known as prometheus-operator) comes with Grafana, node_exporter, and more out of the box.

In a previous blog post about Prometheus, we took a look at setting up Prometheus and Grafana using manifest files. We also explored a few of the metrics exposed by YugabyteDB. In this post, we will be setting up Prometheus and Grafana using the kube-prometheus-stack chart. And we will configure Prometheus to scrape YugabyteDB pods. At the end, we will take a look at the YugabyteDB Grafana dashboard that can be used to visualize all the collected metrics.

Source de l’article sur DZONE