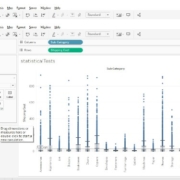
To speak bluntly, when it comes to its visualization capabilities, Tableau, while it appears so promising, astonishingly lacks in its ability to integrate seamlessly with statistical, hypothesis-driven testing. You may be let down constantly if you feel the need to not only visualize but compare your set of observations between groups on hard statistical grounds.
Hence, one must admit that there is still a strong value gap between visualization tools like Tableau, and pure statistical software such as Minitab, SPSS, SAS, and, of course, the humble yet tremendously powerful and open source workhorse, R.

