Articles

Todoist is a to-do list app that 25 million people rely on every day to keep their lives organized. As part of the Doist design team’s goals for 2021, we aimed to redesign the Todoist Android app to take advantage of the latest Google Material Design guidelines.

In this post, we cover the design decisions and processes behind redesigning the Todoist Android app for Material Design. We explore the Design and Android team’s collaboration practices that brought the app update to life, which resulted in winning the Material Design Award 2021 in the large screen category. Let’s get started!

Opportunity

When we started the project, our design implementation on Android was ready for a major overhaul. The last milestone redesign on Android was initiated after the release of the first Material Design guidelines in 2016. Since then the team successfully worked on continuous improvements to the Android app, but we saw the opportunity to improve Todoist on Android on a more holistic level.

We set out to clean up instances of older UI components, colors, and text styles and update them with the latest Material Design components. We observed that some interactions and navigational patterns had become inconsistent with what users were expecting on newer Android devices and were eager to modernize this experience. With new hardware and software changes in mind, we set out to make the experience on larger phones and tablets even better, so Todoist could take full advantage of the latest generation of devices. Material 2 and 3 provided an incredible new framework to rethink the current app experience. With this in mind, we set out to challenge what a modern Android app should look like and innovate on top of the default user experience.

Solution

The team set itself the goal of redesigning our Todoist Android app and aspiring to make it the best-designed productivity app on Android. The project was ambitious and scheduled to take several months to complete. We set ourselves the following targets while working on the project:

  • Review the current implementation and older design specs.
  • Study the latest Material Design Guidelines and assess what is relevant for our project.
  • Research great Material Design apps and case studies and learn from their execution.
  • Define the new Todoist Android app design language and document the changes.
  • Design and development work together to assess the proposed solution and implementation.
  • Test an early version of the new app internally to gather feedback and make adjustments.
  • Invite beta testers to the new app to gather feedback and make adjustments.
  • Refine the app and address core issues before launching to the public.

Review

The project was kicked off by reviewing the current Todoist Android app implementation, noting down what areas needed to be fixed and what was up to date. While reviewing, we took screenshots of the app implementation for reference. This way we could easily see the current state of the app and compare it to the new design proposals that would be created. Once the review process was finalized, we had a comprehensive overview of the current state of the app and the layout, component, and styling changes we wanted to make.

Study

We continued the project by studying the latest Material Design Guidelines, assessing the components and practices that were most relevant to Todoist.

When the project kicked off in February 2021, Material 2 was the most recent version of their design system. Since Material 2 had already been released for quite some time, we anticipated that design changes to Material would be announced soon at the Google I/O event in May 2021. Rather than wait, because we expected the changes to be iterative, we pushed ahead with our work.

We identified 25 components and UI patterns that we wanted to change across the app. The changes included buttons, forms, menus, sheets, navigation drawer, app bar, system bars, text and color styles, and more. We started by creating a table view in a Dropbox Paper document with the component changes and references links to Google’s Material Design Guidelines.

This components list was a starting point for discussion to plan the scope and complexity of the changes. Close async discussions between the design and development team in Twist and Dropbox Paper comments helped us make decisions about scope and complexity early on and set a solid foundation for the project.

Research

In the initial Material Design study, we also researched inspiring Material Design apps, Material studies, Play Store apps, and Google Workspace apps to learn from their execution.

We started out by studying the Material Design Award Winners 2020 and tested out the products that were showcased. The showcased winners struck a good balance between implementing the Material Design Guidelines while maintaining their own product’s brand within the system. This balance between Google’s guidelines and the Todoist brand was also key for us to get right and so we strived to find this mix across the work we created and implemented in the project.

Along with the MDA winners, we researched the Material Studies that Google produced to showcase what apps could look like with branding and Material Design guidelines applied. It was a great reference to see how far components could be customized while maintaining the core platform principles. The Reply case study in particular offered valuable insight to us as its content type and layout came closest to Todoist. It showcased how components like the app bar, navigation drawer, and large screen layouts worked while being customized.

We continued our research by searching the Google Play store for inspiring app examples. Google Tasks, Press, Periodic Table, and Kayak stood out to us as the level of polish and quality of the apps were on par with the experience we were aspiring to create.

Sometime later in the project when Material You was released (more on that later), we stumbled upon the Google Workspace apps blog post which previewed Material 3 changes that Google was introducing to their own products. It offered a great glimpse at what was to come before the Material 3 Design Guidelines were officially released. This post sparked new internal discussions and further design explorations that we considered for future Todoist Android updates.

Design Spec

As we started to define the new Todoist Android app design language and document the changes, we opted to create a design framework, focusing on creating components rather than designing every screen in the app. This allowed us to consistently apply the design system in the app. We did so by using the previously defined component list that we created during the review and study process.

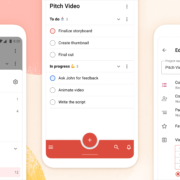
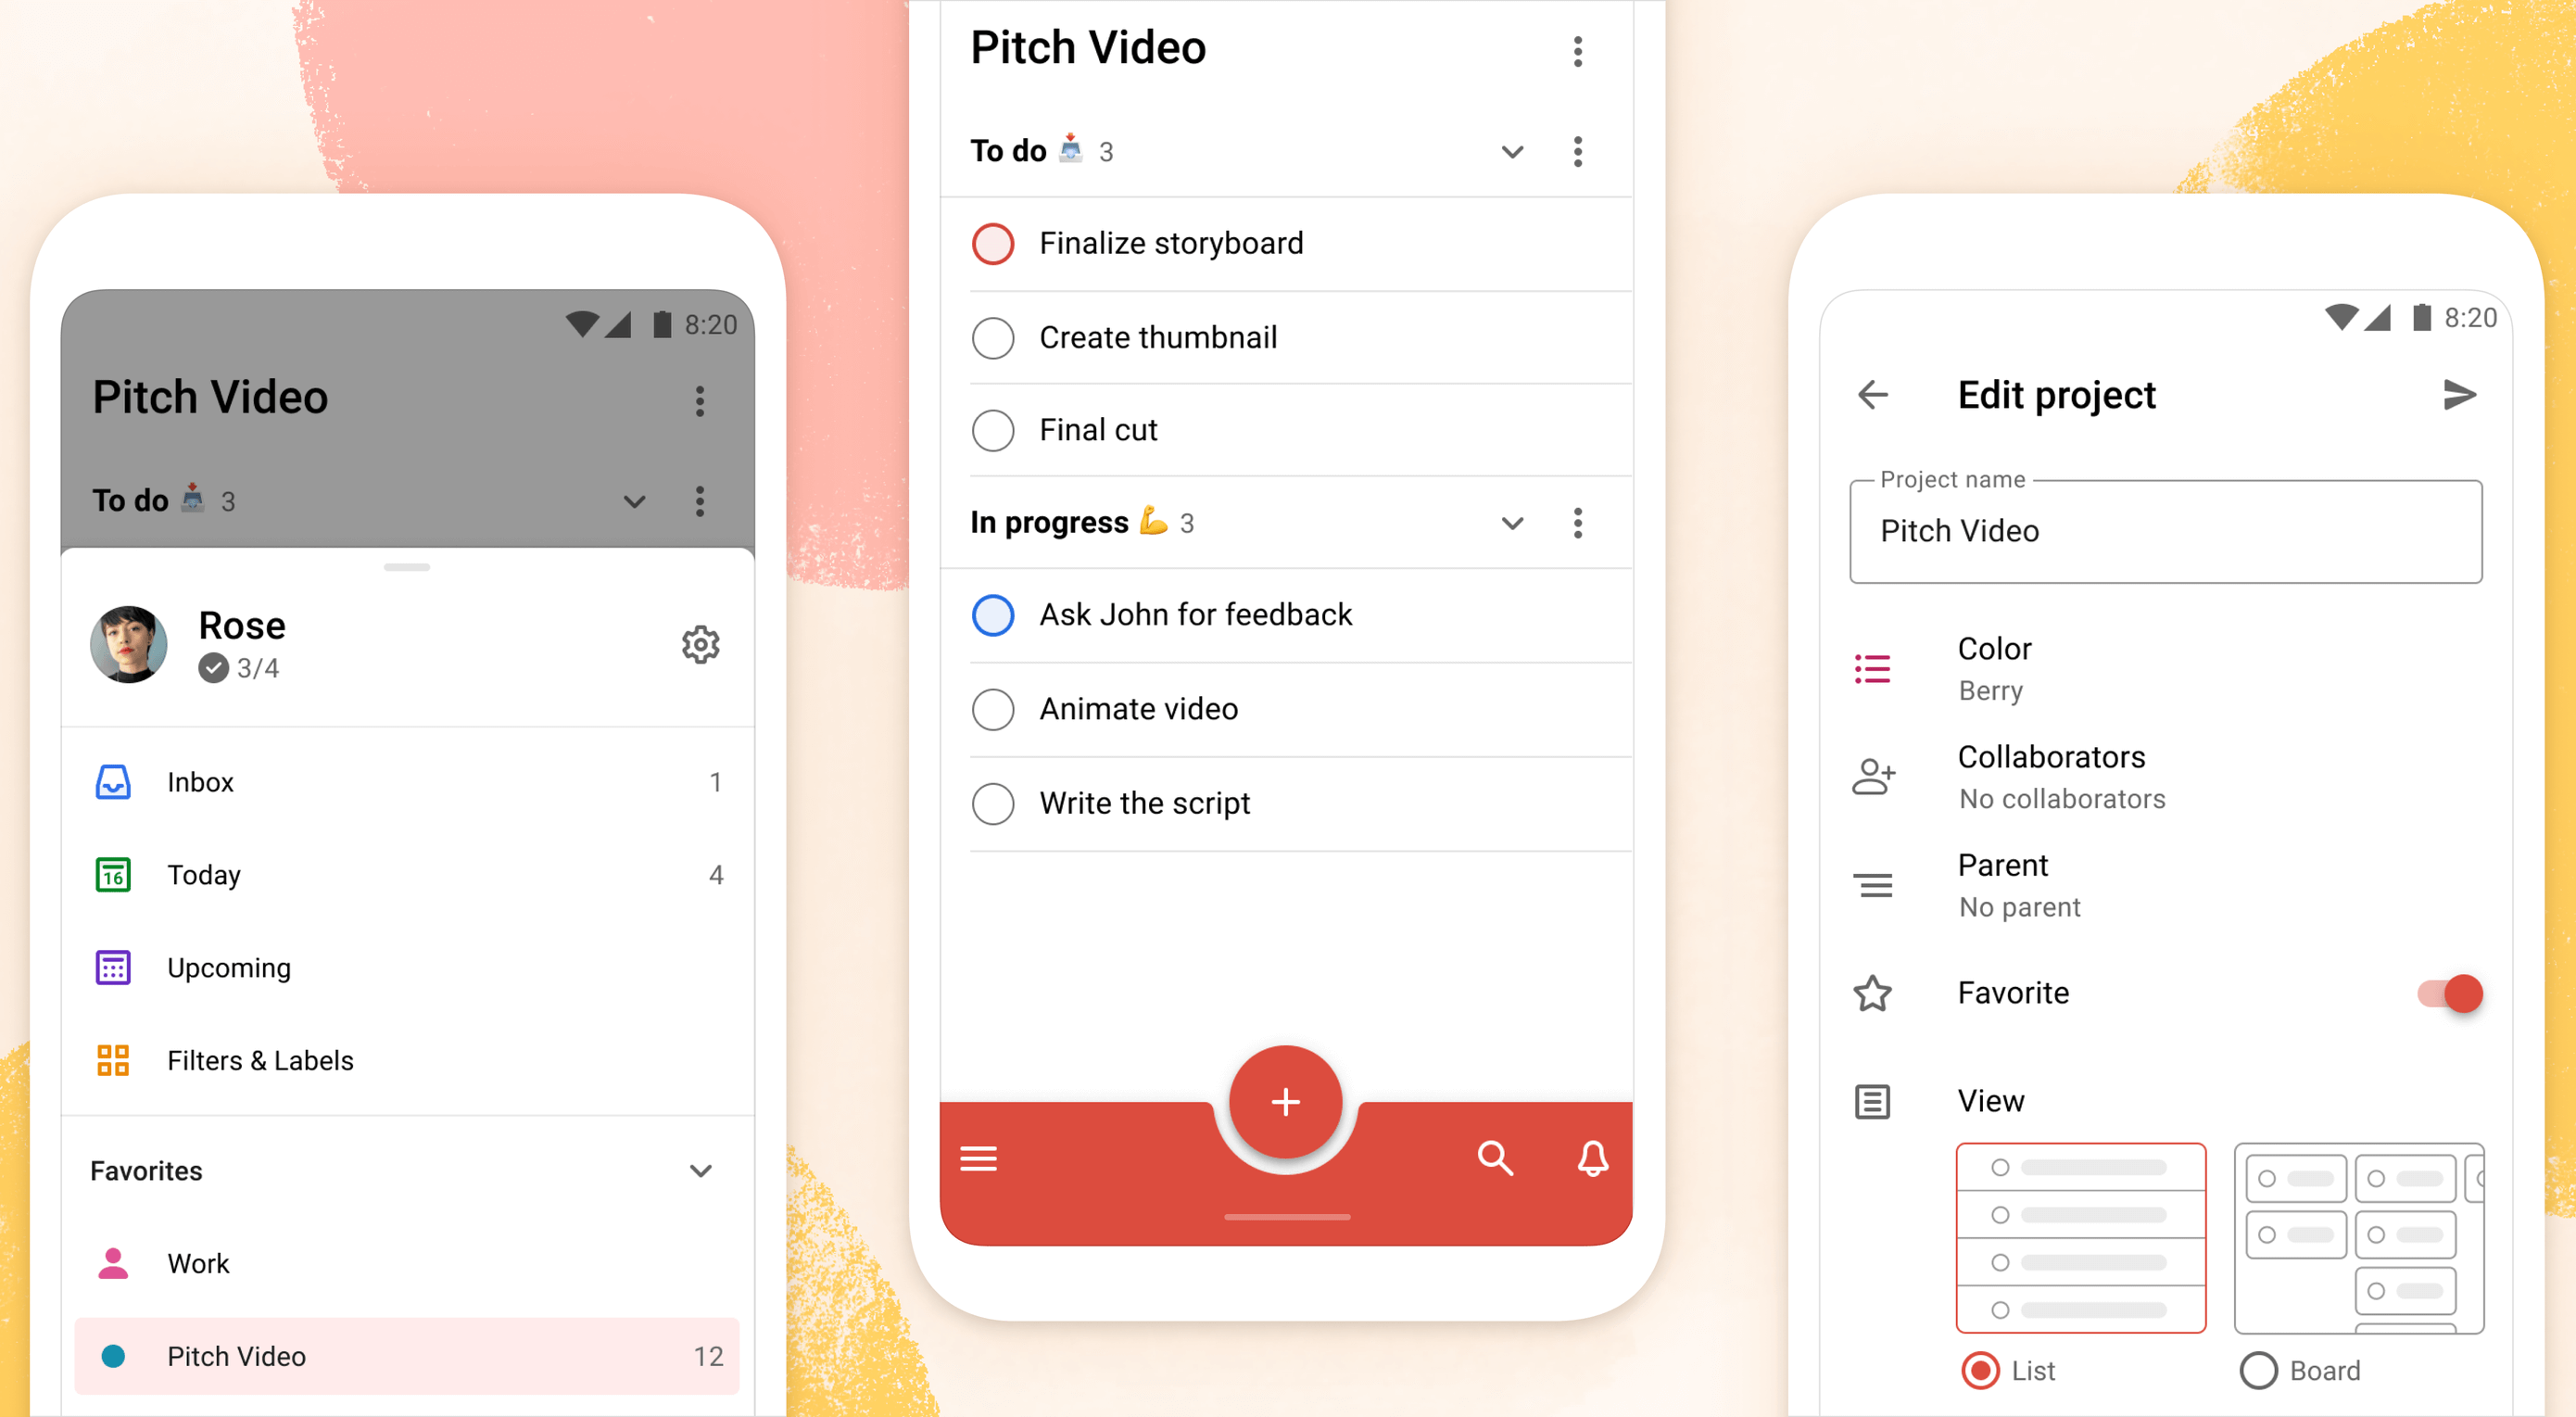
Core screens from different areas of the app were chosen to demonstrate how the components could be applied. We chose to mock up the Todoist project view, navigation drawer menu, project view edit screen, settings, and project detail view, among others. These screens gave us a good overview of how buttons, forms, drawers, lists, and other components would work together and in different states; selected, pressed, disabled, etc.

During the project, we were transitioning our Doist design system to Figma and started creating our first components in the new Doist Product Android Library. We started by using some components from the Material Design UI kit – Components library from the official Google Figma resource file and added them to our Doist design system. We then continued to build up the Product Android Library file with our Todoist-specific components such as task list & board views, detail views, sheets, colors, typography, etc.

We continued by documenting color and typography changes that were based on the Material Design guidelines. The design team opted to implement a new Design Token framework that would share the same values between our design system and the development implementation. The development team would output the values they had in the current implementation and the design team would analyze which values were needed and which could be merged, changed, or deleted. This informed the new Design Token color and typography system which we then documented and discussed with the team to implement. Later in the project, we were happy to see a similar token system introduced by Material 3 in the latest guidelines which validated our thinking and principles behind the new design system.

The design documentation expanded to hold other edge-case mockups that could sit alongside the design system. We documented different responsive screen experiences between phones and tablets against the previous implementation. Additional sections were created to document the motion that should be used for certain components and screens by referencing existing Material Design guidelines examples or prototyping custom motion in Principle and After Effects. The design spec also touched on haptic feedback that should appear on touch targets, how dark mode should work across the new components, documenting Todoist themes within the new design language, and more.

Design Implementation

At Doist, the benefit of the squad is that cross-team collaboration is built into the make-up of the team. Designers, developers, support, and product managers work together in a squad to deliver the project. This close collaboration from the start is key to bridging the gap between scope, estimations, design, development, and delivery. The squad discussed their findings on a daily basis and came up with the best plan of action together.

Designers started by creating components in Figma and shared them with developers in Dropbox Paper. We used screenshots to document the current implementation next to the new designs and linked to the default Google Material Design components. This allowed the team to compare all references in one place. Developers shared their feedback, adjustments would be brainstormed together as the designs were iterated.

Designers on the project would share their work in progress on a weekly basis with the rest of the design team in a design review Twist thread. Here details about the designs were discussed, alternatives mocked up and bigger picture plans made. Design reviews brought up topics like FAB (Floating Action Button) placement, theme options, accent color usage on components, consistency with other platforms, navigation options, and shadow elevation. After thorough discussions and alternative mockups were presented, the design team aimed to find the right balance between Material Design and Todoist brand guidelines. The development team, also part of the design reviews, gave their feedback on the solution and raised technical complexities early on.

Eventually, the design was stabilized and consistencies updated across components and mockups. The design spec was kept up to date so the development team could always review the latest designs in Figma.

Testing

As soon as the development process started, the Android team provided early screenshots and videos in Twist threads while they were implementing the design spec. This practice allowed us to review the app implementation early and often. Designers could review the development work and share feedback in Twist, which resulted in getting the implementation to a high quality. Alongside Twist discussions, the team set up a Todoist project to track ongoing issues and fix bugs. Designers logged new issues, developers would solve them and share the new implementation for designers to review.

When the team had the first stable version of the Android app, we shared it internally at Doist to get more insight and feedback. Other Doisters could access the redesign via a feature flag that could be turned on in the app settings and test the new version for however long they wanted. The feature flag system allowed people to give us early feedback on the design decisions we made and report bugs. Feedback was submitted by the wider team through a dedicated Twist thread and designers and developers could discuss how best to address the feedback during the active project implementation.

After we refined the app implementation further and addressed early feedback we opened up the app update to our beta users. Here users had access to the new Android redesign and were able to give us feedback. Our support team gathered feedback and shared it with us in a dedicated Twist thread. The squad aimed to analyze every comment and looked for patterns where we could make tweaks and improvements to the user experience.

As part of these tweaks, we made changes to how the bottom bar and navigation drawer worked. Some users reported frustrations with the way the new bottom navigation and menu drawer worked. In its first implementation, the drawer was half raised when opened and had to be swiped up to be raised again to see the full content list. This was an issue for some users as it was slower to get to the content below the list. So we decided to fully raise the drawer by default when opening. We also made it easier to open the navigation drawer by sliding up from the bottom app bar. This was a small shortcut but it enabled users to get to their content faster.

Material You

While we were in the testing phase and about to wrap up the project, Google unveiled Material You, and sometime later the Material 3 Guidelines were published. With the newly announced resources, we went back to study the latest guidelines and references we could find to see where the Todoist Android app redesign fits in and which adjustments we might need to make now or in the future.

Dynamic Color was a big new feature that was announced as part of the Material You update. As Todoist supports many different themes the Material You Dynamic Color feature seemed like a good fit for our product. We decided to prioritize this feature and implement Dynamic Color light and dark themes as part of our Todoist theme settings options.

To implement Dynamic Color, the development team started off by creating a demo prototype that utilized the Dynamic Color system and showcased how we could select from a range of color choices that the system defined based on the wallpaper choice. From there, we tried to incorporate system behavior in our design mockups. We designed a range of different color mockups and components to see which ones could fit with which components. We then came up with a color system that worked for the Todoist app and the new themes. These new Dynamic Color themes would sit alongside our current theme options in the Todoist app settings. From here users could choose between Dynamic Color Light and Dark themes.

Along with Dynamic Color, the team also created a customizable bottom app bar, allowing users to set up the app in a way that’s most convenient to their workflow. The location of the Dynamic Add Button can be changed to the center, left, or right corner of the screen. The order of the Menu, Search, and Notification buttons can be rearranged to best fit the ergonomics of the user’s dominant (left or right) hand and optimize their navigation patterns.

Launch

As critical beta feedback was addressed and stability tweaks were made, the squad felt ready to release the new Todoist Android app to the public. The team logged the issues that could not immediately be addressed for future reviews and updates.

The design and marketing team readied the launch by creating What’s New banner artwork and copy that are displayed within the app when launching the update. The Doist marketing team also created release notes and shared the app update announcements on our social channels. The brand and product design team worked together to create custom image assets and copy that summarised the project work in a simple and beautiful way.

What’s Next: Material 3

After a successful launch of the redesigned Todoist for Android app, Google contacted Doist to announce that Todoist was selected as the Material Design Award 2021 winner in the Large Screen category. The team was excited to be recognized for their hard work and it felt like we achieved the goal we had set out to accomplish.

Internally, designers and developers continued to study and discuss the Material 3 updates. The design team started exploring mockups and design changes inspired by Material 3 and Google’s Workspace app updates. Some of our current Todoist explorations include changing the FAB styling, updating the app bar, further removing elevation shadows, and more. Here is a preview of what a future Todoist update could look like.

We hope these insights into Doist’s design process and collaboration practices have sparked your interest. Thank you for reading and stay tuned for future design updates!

Takeaways

  • Study the Material guidelines, Material Design winners, Material studies, and Google Workspace apps to make informed design decisions when designing your next product or app update.
  • Evaluate which Material Design components and practices are right for you and implement them into your product.
  • Carefully balance the Material Design guidelines with your brand guidelines to create a unique and consistent experience between your product and the platform it lives on.
  • Collaborate with your Android developers early and often to ship app updates efficiently and increase the design implementation quality.
  • Use design components and build a design system along with practical mockups to create an efficient design spec.
  • Consider how the latest Android features fit into your product and which have the most impact on your users before deciding to implement them.
  • Test and review builds with your internal team and external beta users to get valuable feedback and make adjustments before releasing them to the public.
  • Create announcement artwork to showcase your latest app or feature update along with a clear description to share in-app and on social media.

Source

The post Case Study: Redesigning Todoist for Android first appeared on Webdesigner Depot.

Source de l’article sur Webdesignerdepot

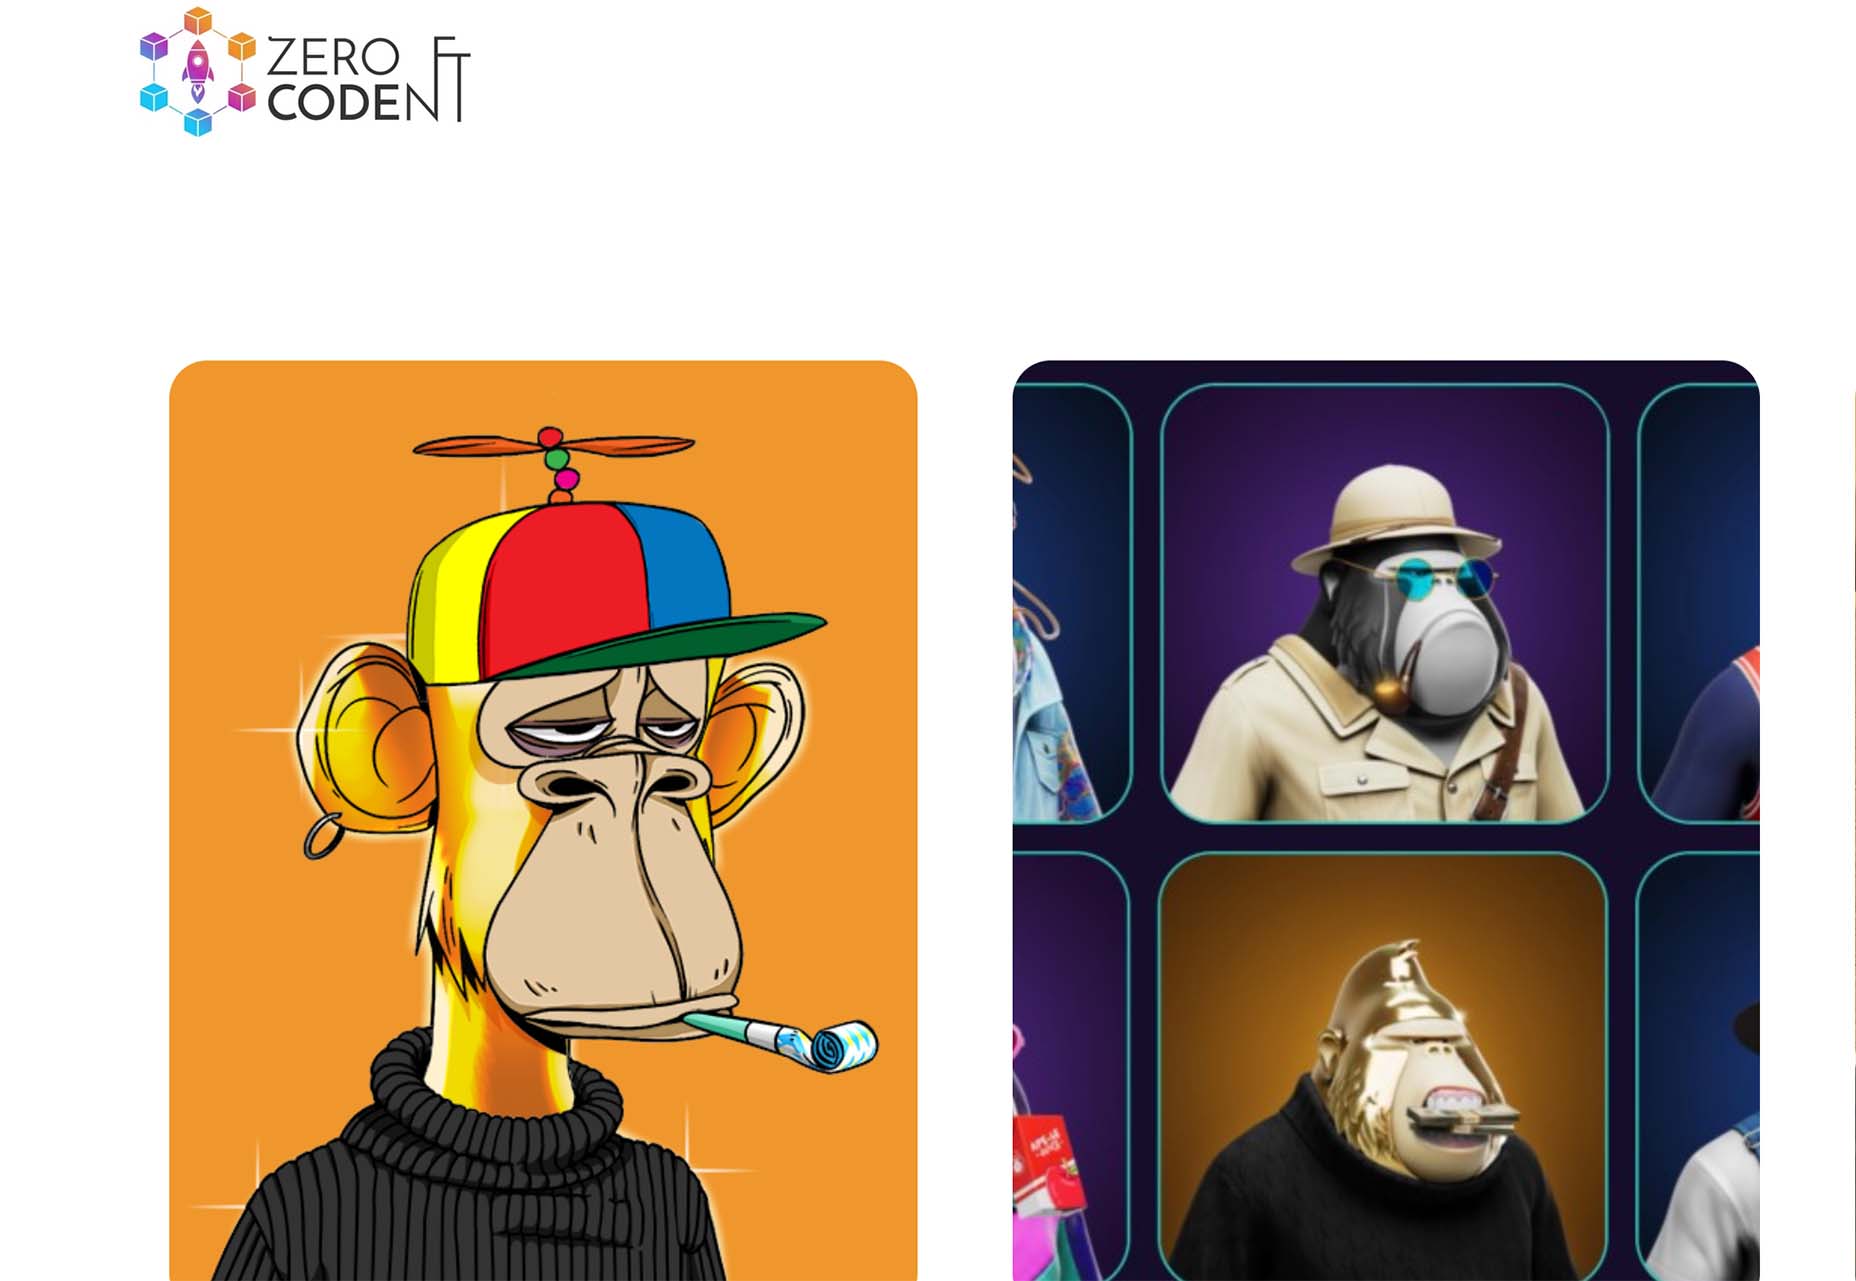
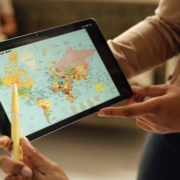
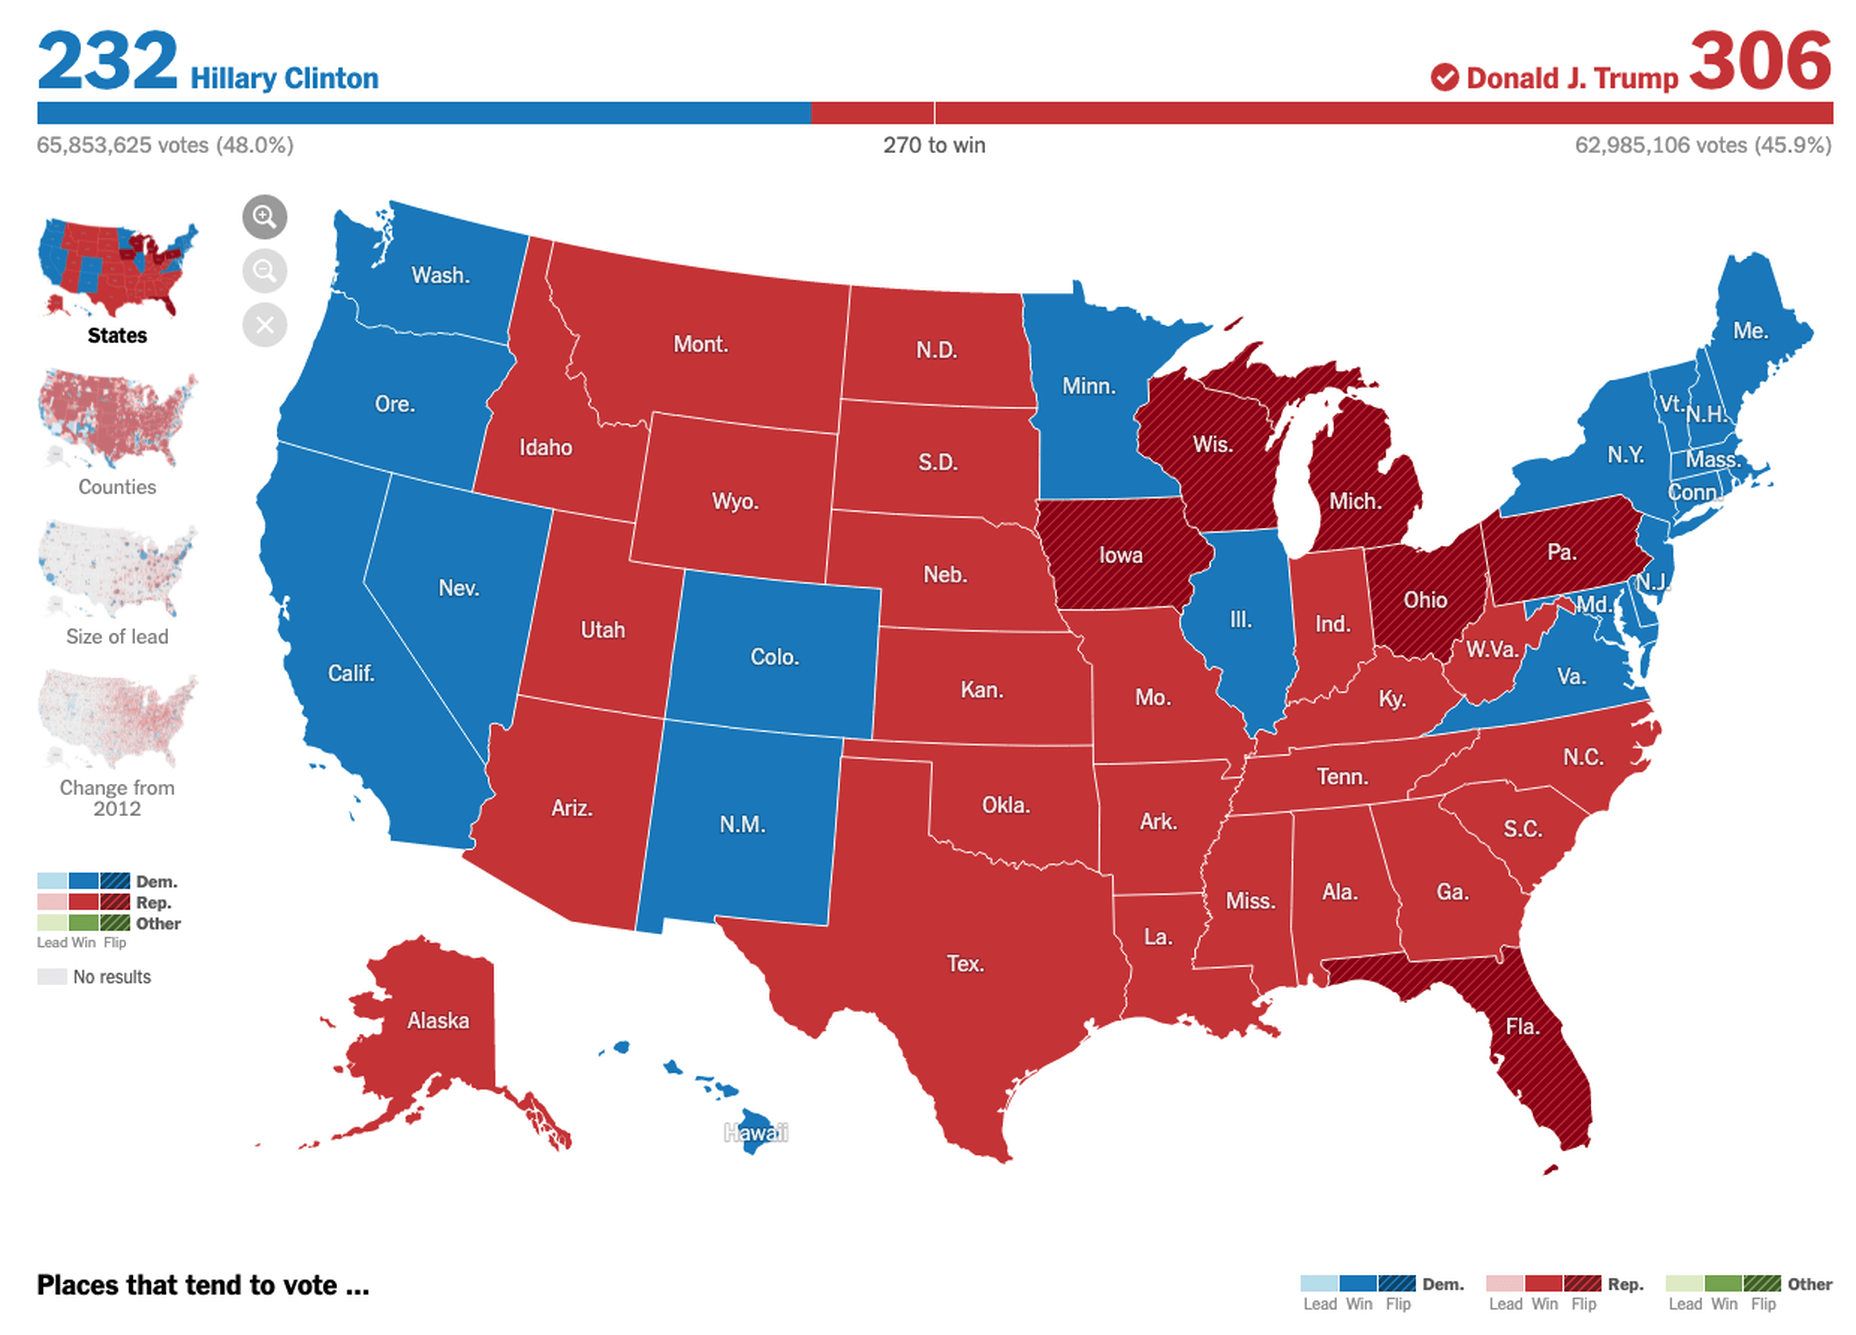
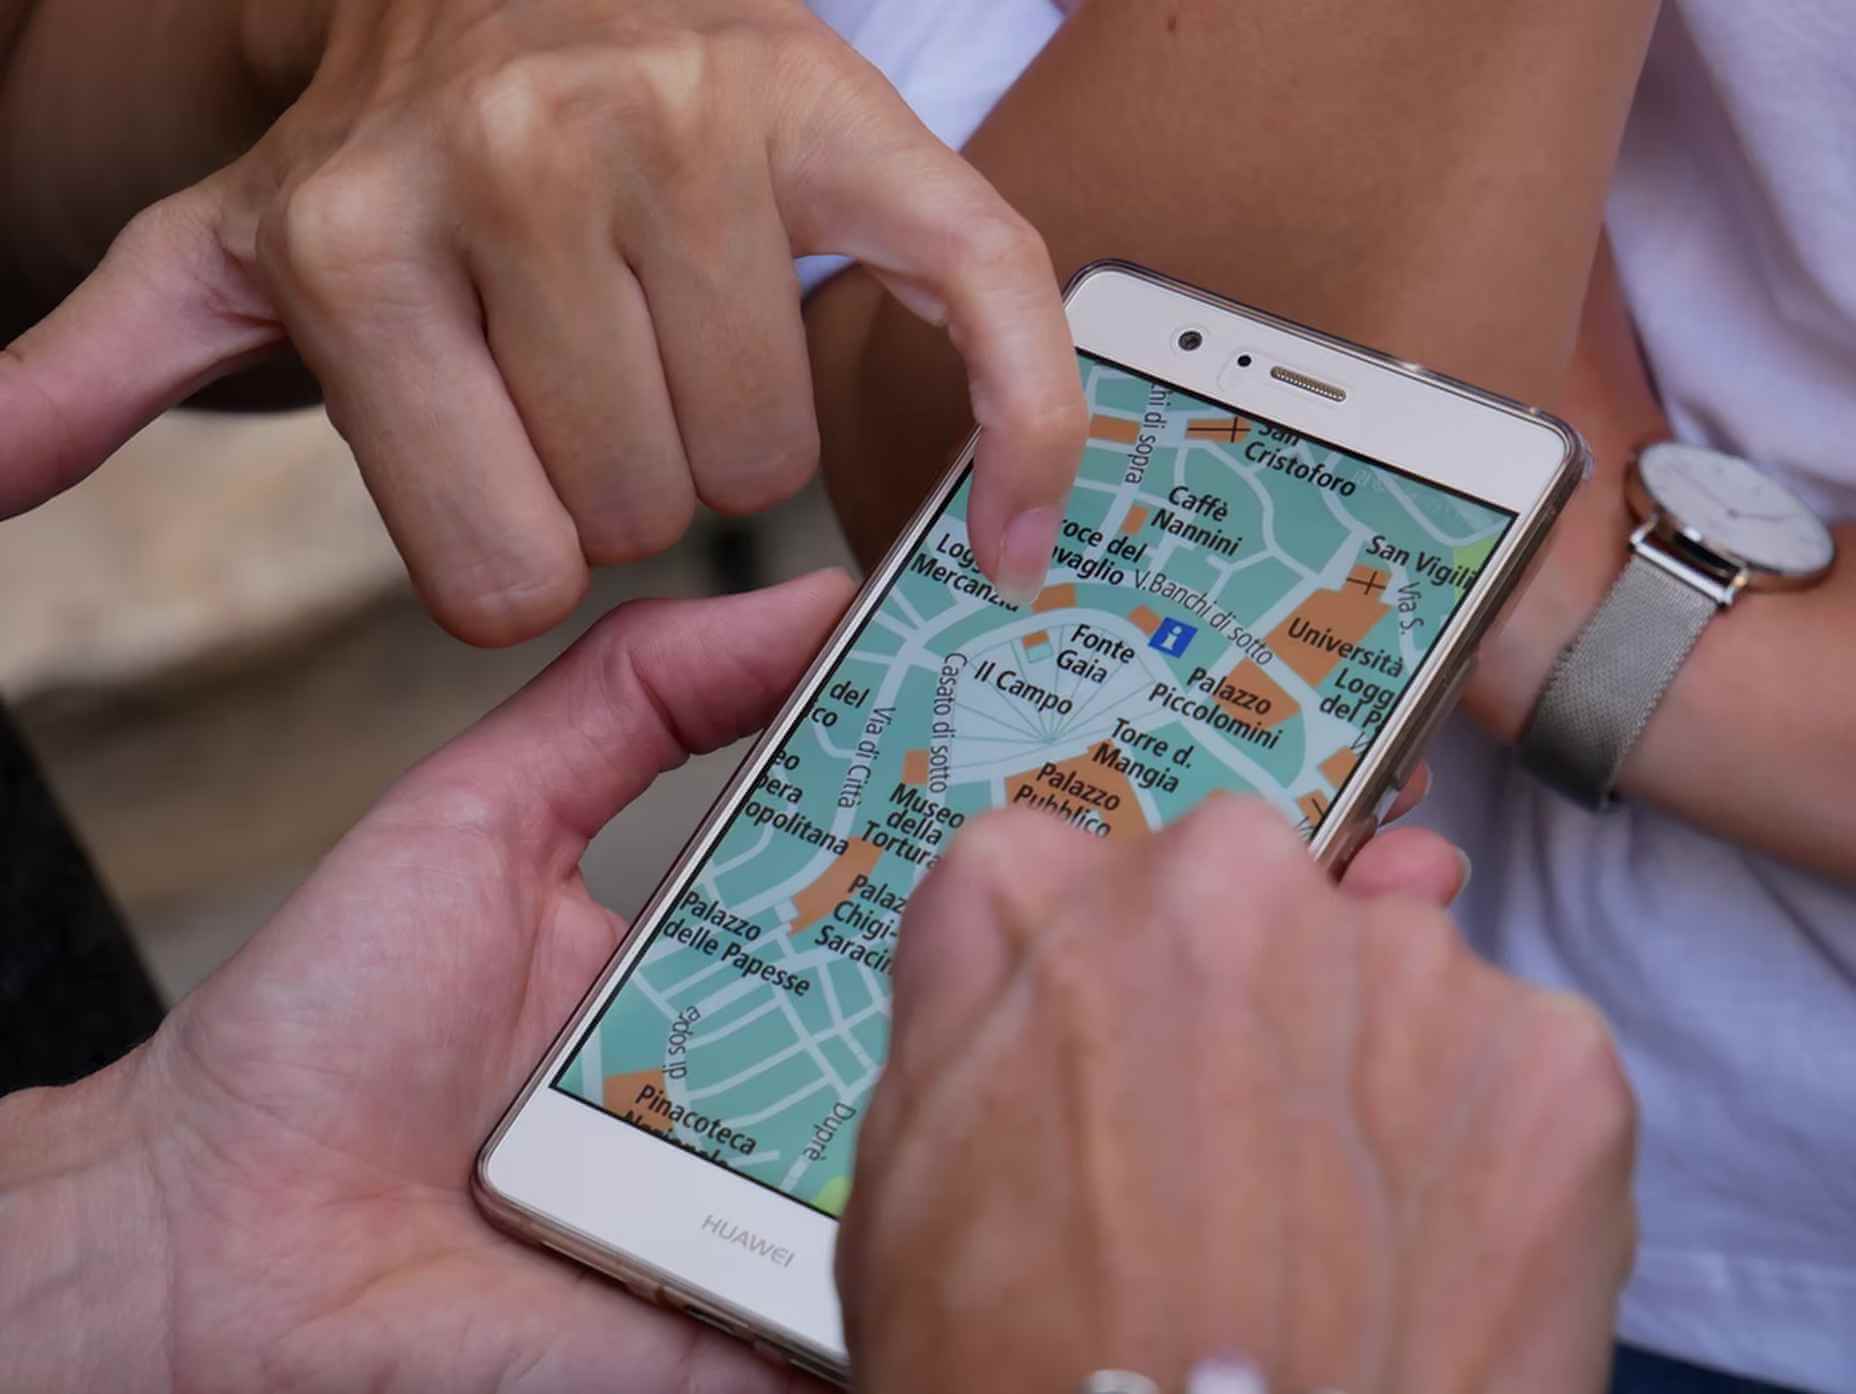
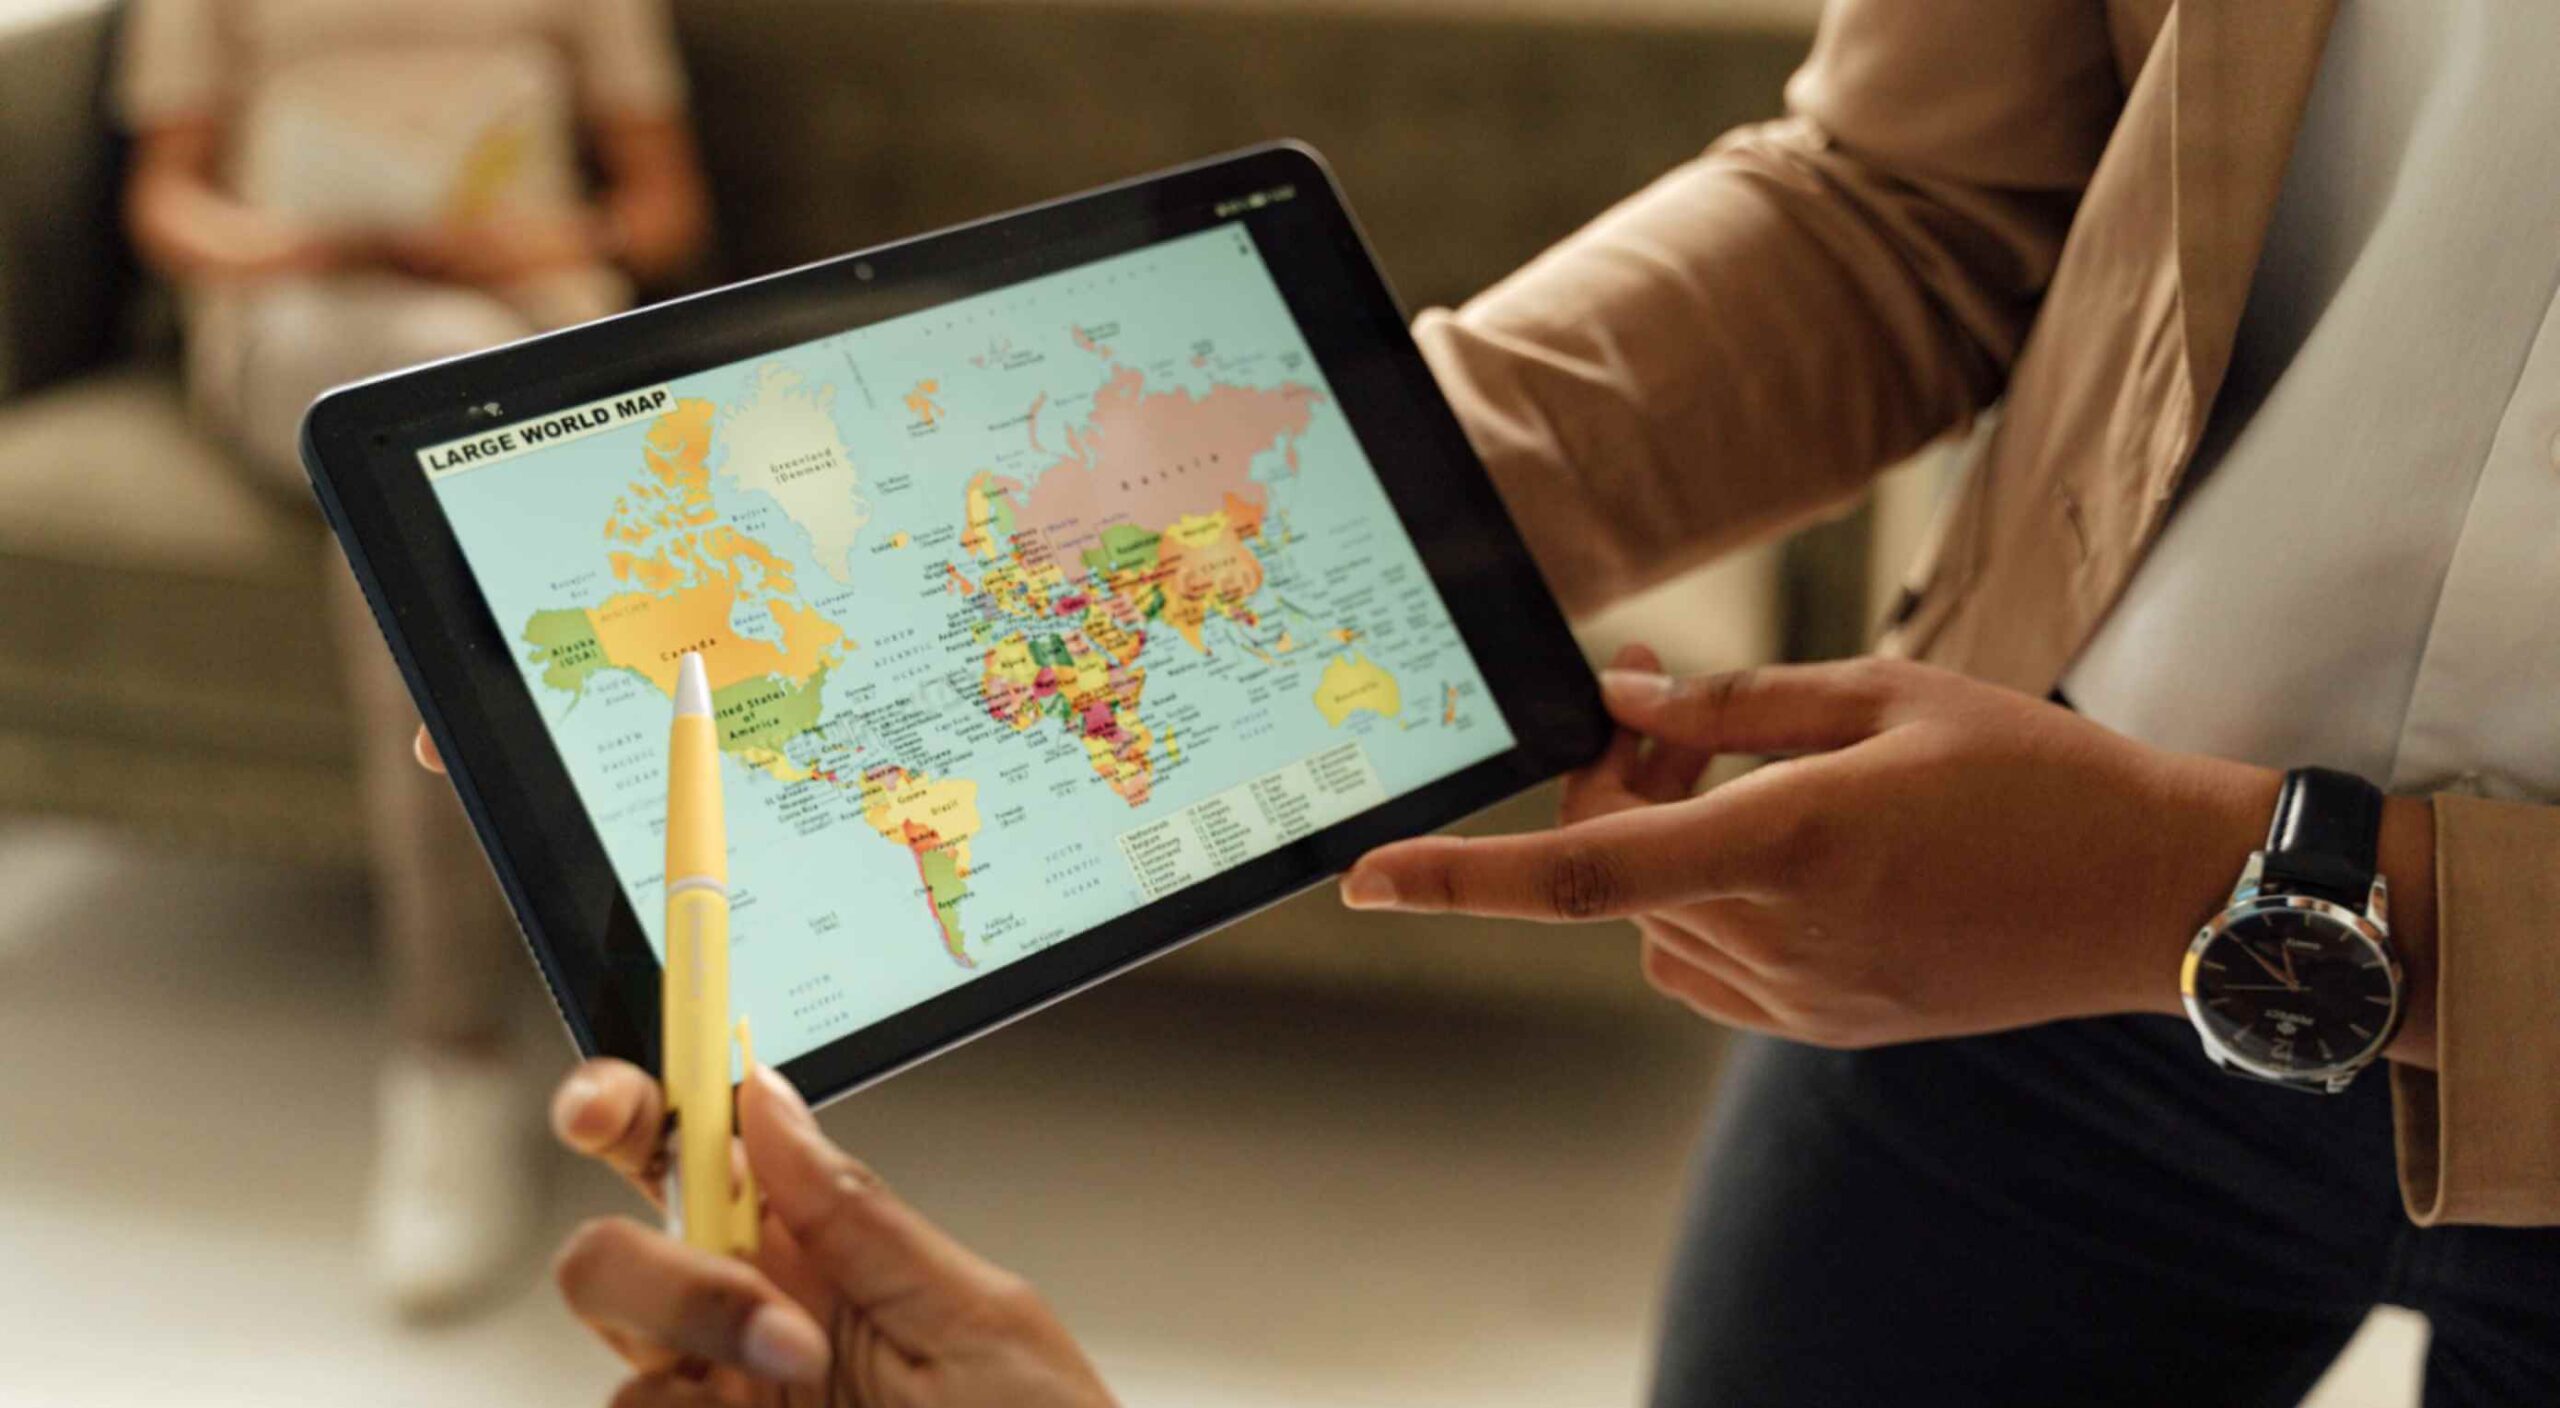
Maps are a fascinating method for delivering content. At their best, they can create an intuitive way of presenting information and interacting with it. This is the advantage that digital maps, through mobile apps and websites, have over print maps and images where no interactivity is possible.

But it’s important to understand that more data ≠ better experiences. We all now have so much data available to us through multiple services that, arguably, the greatest challenge isn’t sourcing information but filtering it out. We can only handle so much information input before we become overloaded. This issue risks being omnipresent with maps. There are so many potential points of interest on a map that it’s essential to be clear about what needs to be exposed to users.

Also, UX design, map design, and user interface are all critical. While maps can be a powerful way of drawing people in, if end-users feel that you didn’t even consider the visual design, they’ll ‘bounce off’ your site or app in moments.

Common Use Cases

When are maps useful, and what problems do they solve? Let’s dive right into the most common use cases for maps used in web design.

Navigation and Direction

Like Google Maps shows, navigation and direction are arguably the classic case study for interactive maps. You are in one place and need to get to another. You can enter your destination, your current location, and the map will present suggestions for getting there. You can select the method of travel and adjust desired departure or arrival times. But you need to understand first what functionality your users need. How these options are exposed to users is a critical piece of UX design.

Also, if users are searching for options such as somewhere to eat, it’s not so straightforward. Then, how your map handles panning in real-time as users swipe around a city is going to be a big issue.

Showing Relationships and Trends Geographically

This is something that you’ll see in every election in any western country. We’re all used to seeing maps that give us a state-of-play for which state or seat is held by which party. Then, we might see projections based on voter intentions and projected voting swings deriving from that. Then, exit poll data can be projected with the map updated on an ongoing basis until the final result is confirmed.

The capability to do this is essential because if a static map were used, it’d be out of date any time a new poll was released. Also, voting intentions can change over a campaign, so such maps need to be dynamic. Of course, such maps are only as accurate as the available data, as the US 2016 election map showed.

Show Points of Interest

As mentioned previously, there’s a lot of data that can be exposed to map users. However, that doesn’t automatically mean that it should be. Usability is key. For example, when you look at a map, you’ll typically first see key points of interest. Which points of interest are going to be presented to you can vary.

One variant is zoom level. If your map is currently showing an entire city, the level of detail the map presents is deliberately limited. You’ll see districts, large roads, or geographic features such as rivers. If more detailed information were presented, users on mobile devices, in particular, would be overwhelmed. Even at this level, you’ll notice typography differences. These can include the city name being in bold or the names of different areas in capital letters. So the level of detail is coupled with the scale of the map. Zooming in a few notches will expose significant points of interest, such as museums. Zooming in to specific districts will reveal restaurants, coffee shops, and universities. This visual hierarchy is a critical way of managing the exposed level of information.

But information is still being abstracted away. It’s not until you tap on the museum that you’ll see information on opening hours and busy times. This is also typically presented with user photos and reviews. Context is also taken into account, so you’ll start to see local hotels and restaurants. So it’s not just individual points of interest that are important, but the connections between them.

6 Tips For Improving Interactive Maps

What are the challenges of creating effective maps, and how do people address the data overload problem? We’ll answer this question and go over the must-know aspects of map creation.

1. Ensure Security and Brand Trust

GDPR or General Data Protection Regulation. This is a critically important European law that extends a wide range of legal protection to European citizens regarding personal data. It’s not possible here to cover the full extent of the law, but here are some quick key points:

  • Consent is required for the processing of personal data; it cannot be assumed
  • You need to have a retention policy for information that’s capable of identifying people

Be aware that the latter doesn’t just cover commercial purposes. Research students have to submit GDPR forms that address what kind of data they’re sourcing and how they’ll be retaining it.

But the most crucial context is commercial. If a business suffers a data breach, it can be fined up to 20 million euros or 4% of annual worldwide turnover in the preceding financial year, whichever is greater. Therefore, any business storing data that could identify their customers will need to assess risk and compliance. Remember: it’s 4% of worldwide turnover, not EU turnover.

Also, anything of your business that you expose to your customers or users is an extension of your brand. Therefore, you need to assess your maps for brand compliance too. If you have primary brand colors and your map doesn’t abide by them, that’s a very poor look. Source the color hex codes directly from your brand team and involve them in design.

2. Use the Appropriate Type of Map

It’s also important to consider what type of map is most appropriate for your use case. Think carefully about what your users need, what you’re trying to communicate, what information you need to present, and how best to present it.

For example, points of interest style maps in a tourist app will be way more helpful than heat maps: people want to know where something is, key data like opening hours, and how to get there. A heat map showing the number of visitors to each attraction or area of a city is unlikely to be useful to tourists. However, it could be useful to the attractions themselves to map their visitors by heat map over time. This could help larger museums chart which exhibits are most popular.

Transport for London is charting passenger movement on the London Underground by detecting when a device with Wi-Fi comes into range and then passes out of range. They’re using this to understand overall user journeys and movements within individual stations to better manage disruptions.

3. Avoid Pop-Ups

It should go without saying by now that auto pop-ups are despised. It doesn’t matter what they’re doing or what they’re offering; an unwanted pop-up can only get in the way. The level of impact is even greater on a phone where pop-ups take up even more screen space.

Given this, many users close them without even reading them. So if you’re using pop-ups, don’t kid yourself. You’re likely just irritating users and increasing the likelihood that they’ll ‘bounce off’ or uninstall.

4. Avoid Auto-Geolocation

Auto-geolocation sounds incredibly convenient but can result in some real problems. For example, if there are any bugs with auto-geolocation, you could get false results. If someone connects through public building Wi-Fi, you could get false results. If they’re connecting through a VPN then, unless you get the user’s IP address and check if it’s the exit portal of a VPN, you could get false results.

The problem is most significant with mobile maps. If a map user is looking at a points of interest map, they likely have a specific and immediate use. This means it’s in their best to get the most accurate results possible. So why not just ask them?

Precision and Accuracy

These terms have specific meanings in geolocation. ‘Precision’ is the exactness of the data. ‘Accuracy’ is how closely the information on a map matches the real world. So you want precision and accuracy to be spot on, or data risks losing value. This applies not just to the gathering of data but to the representation of it. For example, if you have street-level data but your maps don’t present individual streets, then any representation of data on that map is likely to have poor accuracy. That map might succeed in abstracting irrelevant information but presenting an imprecise and inaccurate view.

5. Avoid Map Legends as Much as Possible

In many cases, primarily points-of-interest maps, they’re just not needed anymore. An essential part of user experience design isn’t just visual hierarchy but information hierarchy. You can mouse over on a desktop or laptop to get the essentials of a location, e.g., the museum’s name and its opening hours. On a mobile device, you can tap on that location to get the essentials, and you can tap on another location to move on; you don’t even have to press back. Given that, a legend would get in the way. So this simple piece of information design solves information overload issues.

As with all rules, there are exceptions. A good one is a heat map where a density of what’s being measured needs to be communicated. It doesn’t matter what the data is; it just needs to be something where mapping provides greater insight, especially if it informs decision-making. Sales is an excellent example for a national or multinational company. Of course, weather forecasting can make use of literal heat maps.

6. Accessibility Compliance

Not everyone has perfect eyesight. Even if someone has excellent vision, they could still be colorblind (8% of men and 0.5% of women are). Given that, take the W3C’s accessibility standards into account and treat them as a baseline or minimum barrier to entry for compliance. You shouldn’t feel good about the possibility of excluding 8% of your potential audience or customers. Ensure you keep your UX designers involved and don’t shy away from creating senior-friendly web designs.

Put simply: imagine if you could appeal to a new demographic that’s not catered to. If your competitors ignore them, you could give them a real reason to choose you instead by taking some straightforward steps. If your competitors are catering to them, you also need to. If you don’t, you’re just giving potential customers a big reason to ignore you.

Conclusions

The key takeaway is that there’s far more to creating good maps than just good cartography. That can be critical, too, though this may vary depending on the use case.

This will be a team effort because your map will involve data sets, design decisions, and, yes, cartography. You’re going to need to involve brand and IT too. So think about design principles and development methodologies.

First and foremost, what are your users’ needs? If you haven’t done any user research or taken the time to understand the customer journey, are you adding anything or getting in the way? It’s easy to see the department that requested the map as stakeholders, but you should probably view your users as stakeholders too.

This sounds complex, but as you hopefully now appreciate, a map is probably more complicated than you thought.


Featured image via Pexels.

Source

The post The UX of Maps in Web Design first appeared on Webdesigner Depot.

Source de l’article sur Webdesignerdepot

Today, we discuss C# code quality and a variety of errors by the example of CMS DotNetNuke. We’re going to dig into its source code. You’re going to need a cup of coffee…

DotNetNuke

DotNetNuke is an open-source content management system (CMS) written mainly in C#. The source code is available on GitHub. The project is part of the .NET Foundation.

Source de l’article sur DZONE

For everyone having done multithreading and async programming, it’s fairly obvious that the amount of complexity required to (correctly) implement threading and async increases the cognitive requirements to understand the codebase to sometimes unfathomable amounts. Typically, this results in difficult to track down bugs, and over time what we often refer to as « spaghetti code » or « the big ball of mud ». To put this into context, I’d like to put forth a statement in regards to this.

Everyone who (falsely) believes they understand threading and async, don’t understand threading and async!

Source de l’article sur DZONE

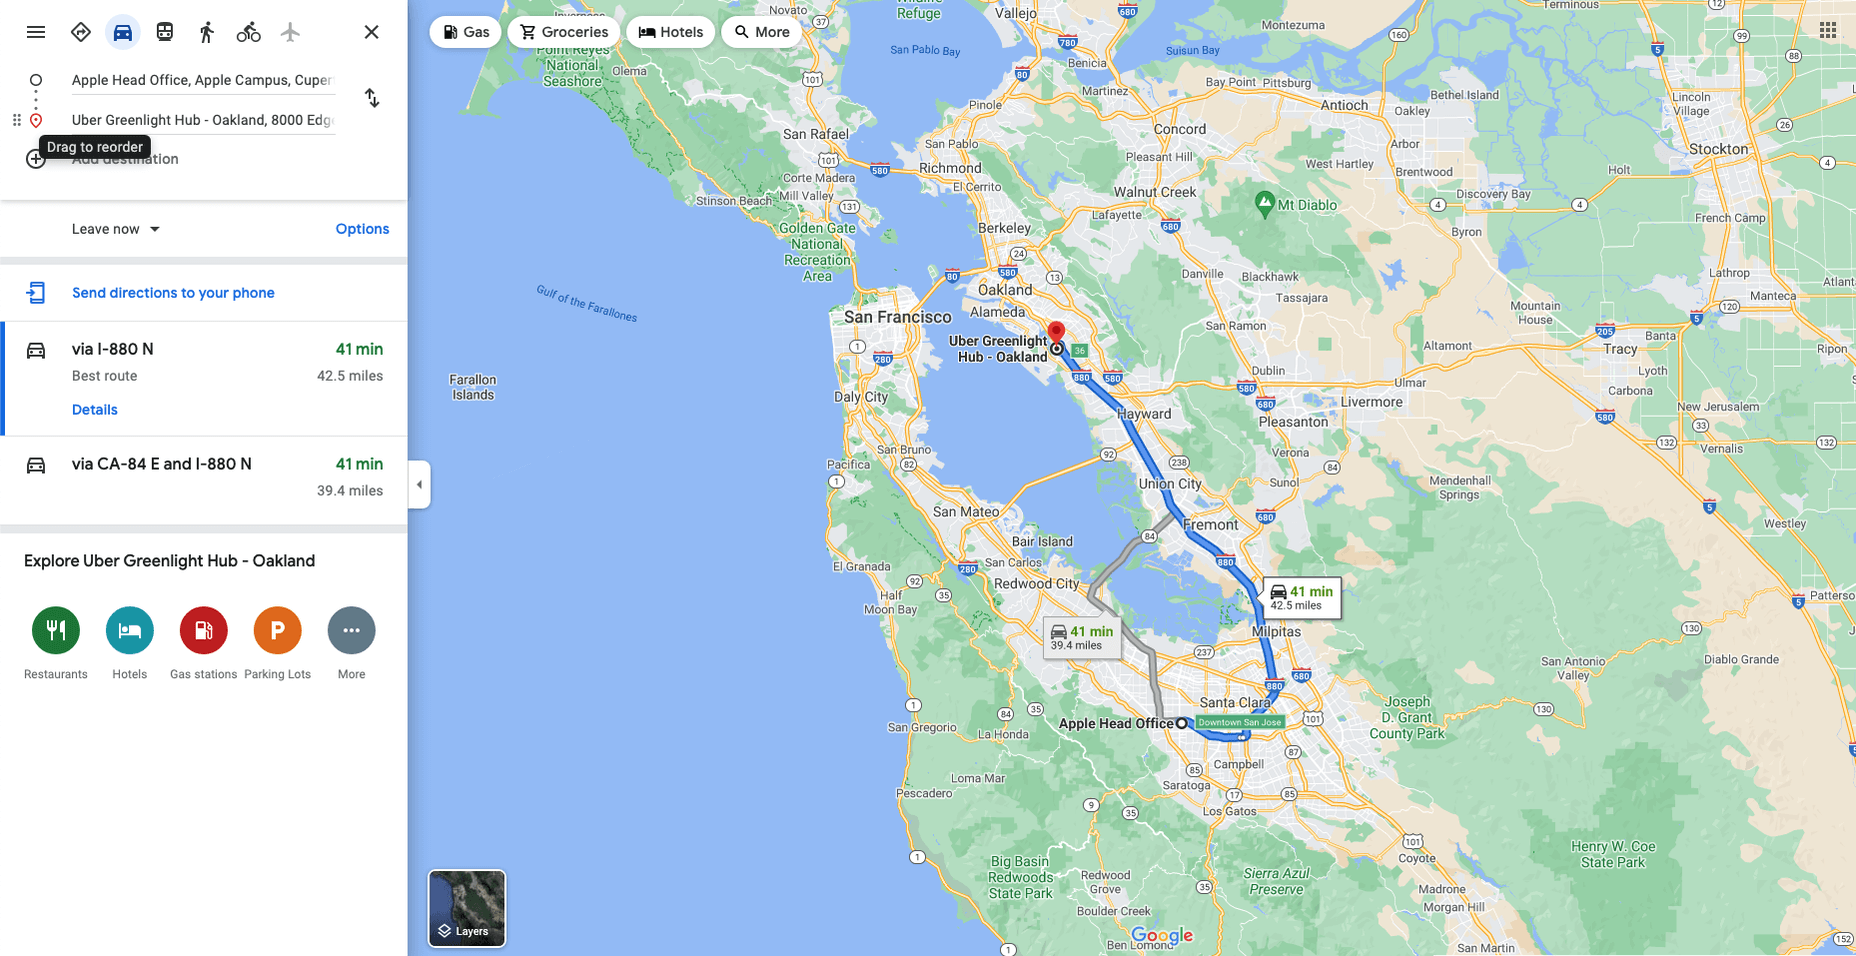
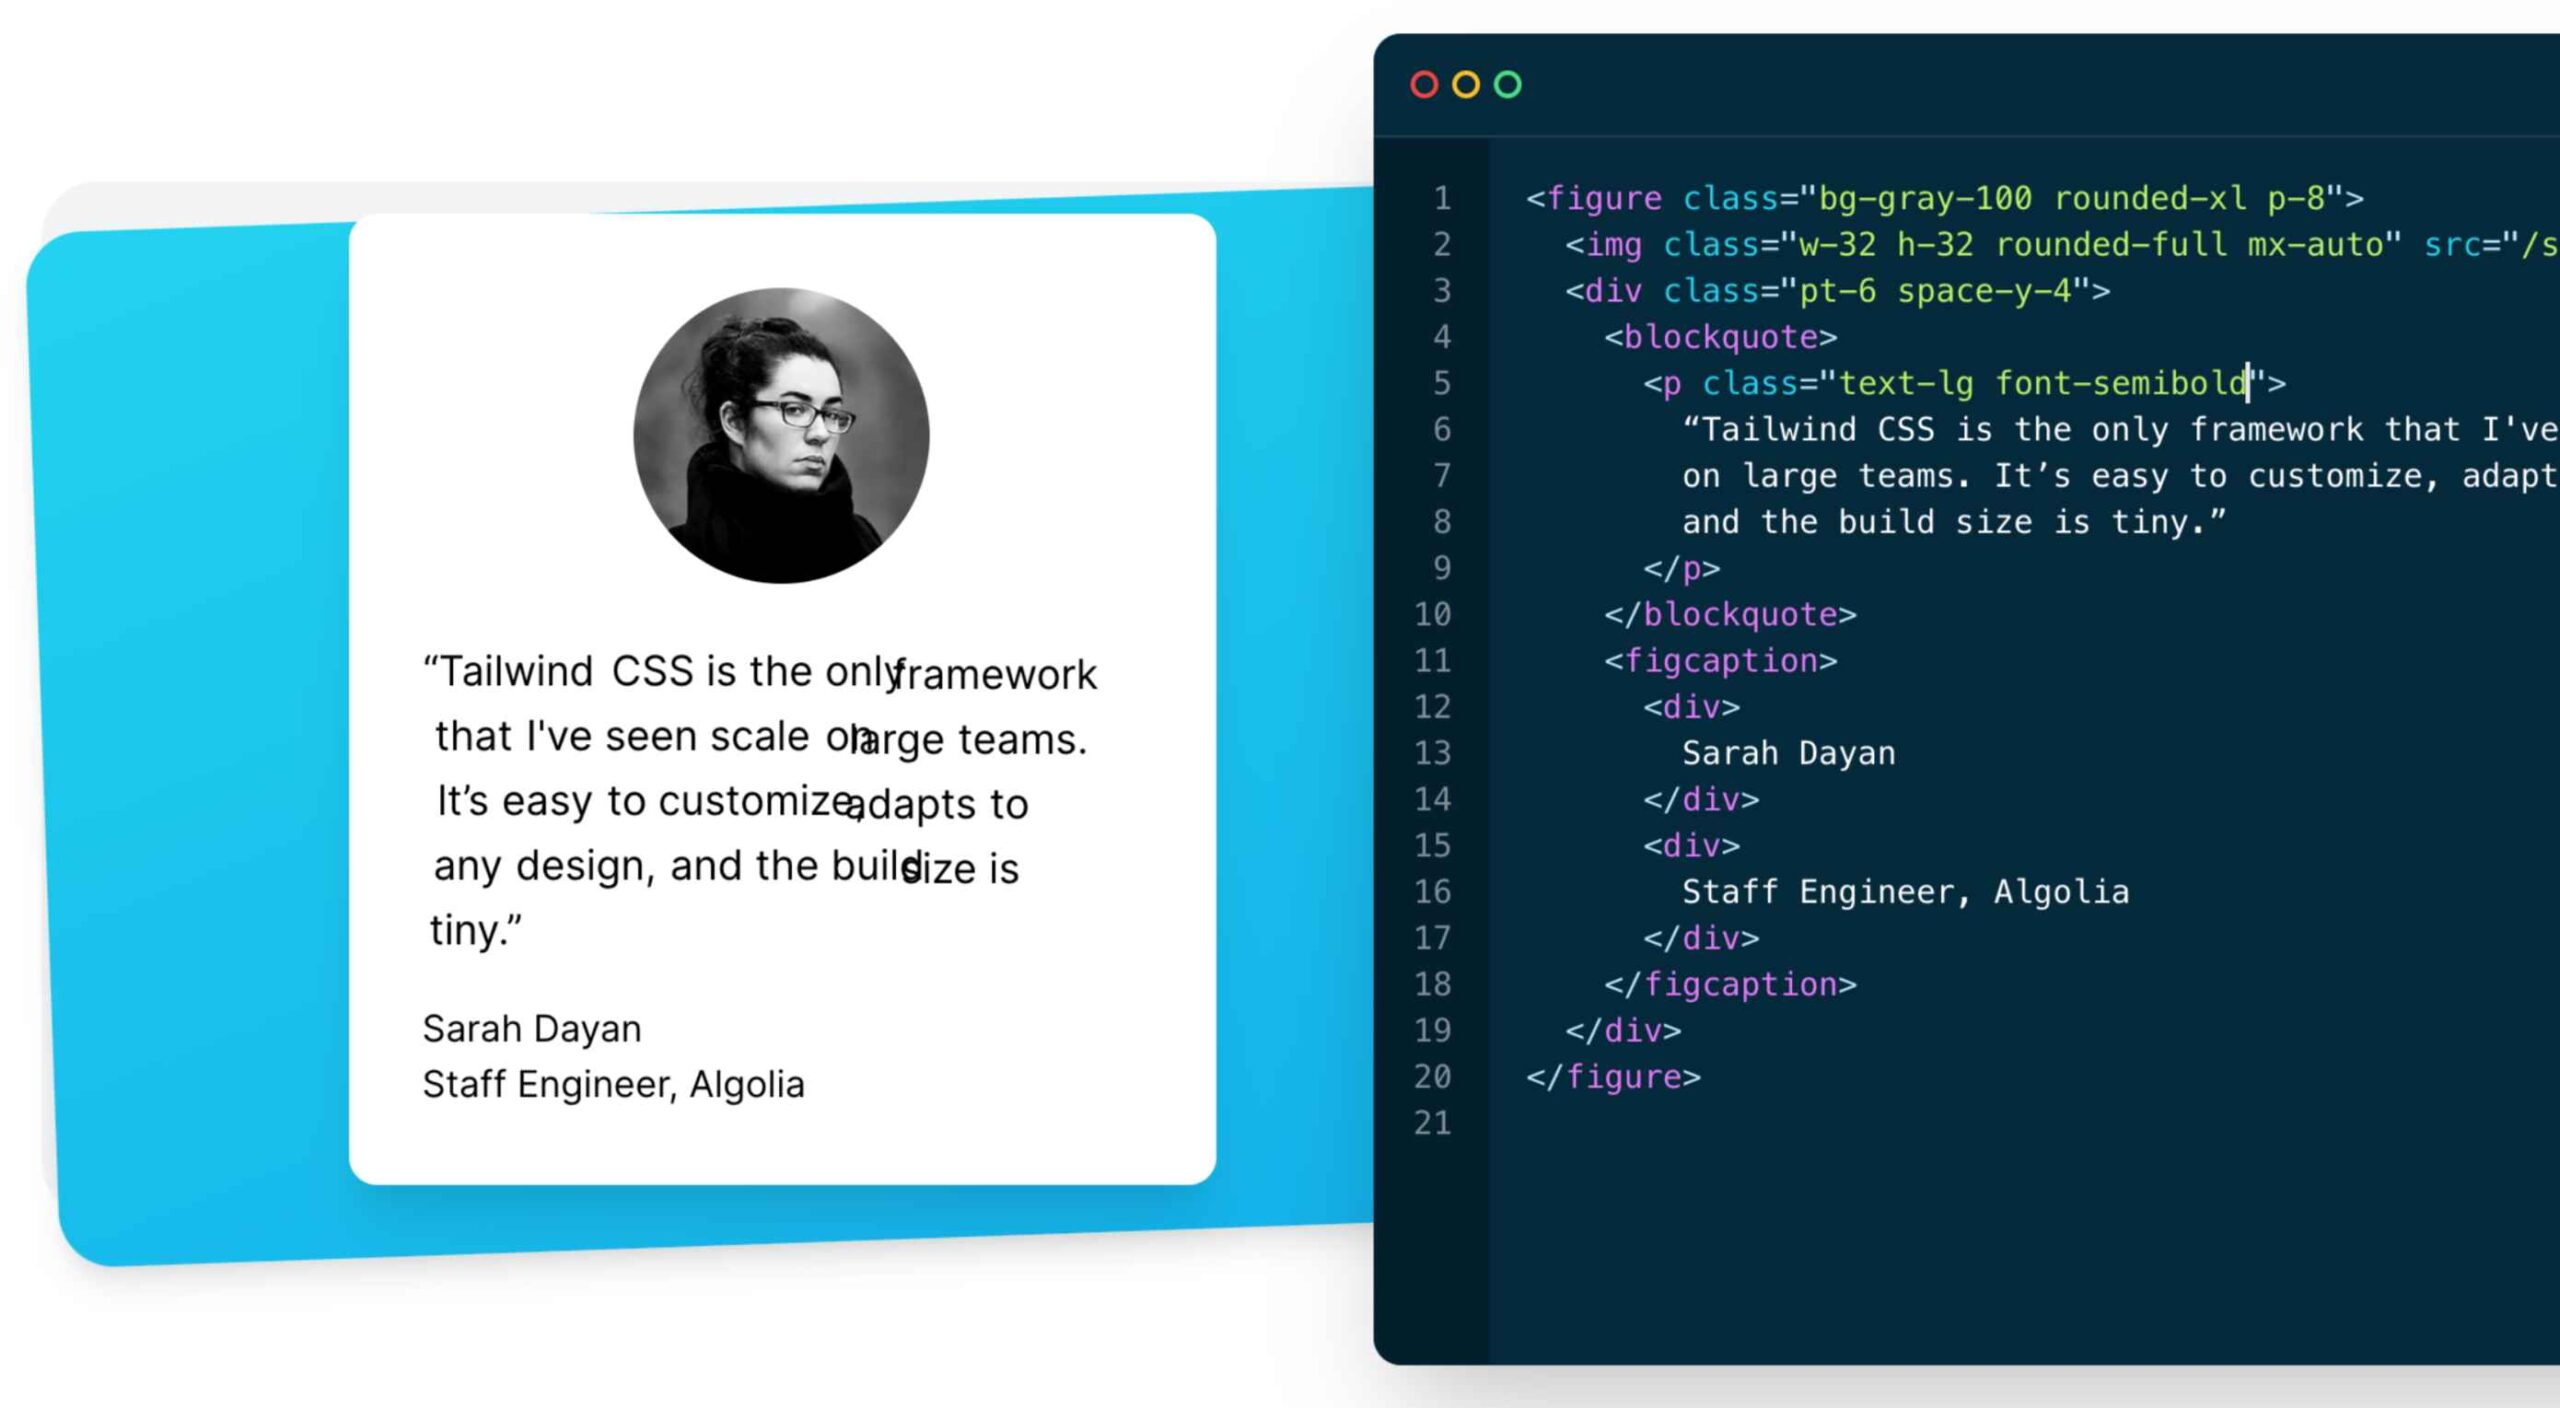
As a utility-first CSS framework, Tailwind has rapidly become popular among developers. With its fast styling process and the freedom it offers when designing a website, it’s really no wonder why.

But how can you make sure this is the right CSS framework for your upcoming development projects? In this blog post, you’ll learn what Tailwind is, and how it differs from other frameworks like Bootstrap, or Foundation.

In addition, we will highlight the main advantages and disadvantages of the framework. By the end, you will be able to make an honest and objective assessment as to whether Tailwind is the right framework for you. So without further ado, let us dive deeper into it. 

What is Tailwind CSS?

First released in May 2019, Tailwind CSS is a front-end CSS framework. It is currently at version 2.2. Since its release, Tailwind has created quite a following. More than 260k developers have used it to enhance their design systems.

Stats like these make Tailwind one of the most popular CSS frameworks on the market, and all in less than two years. There are many reasons for this. Primarily, because its features make it the ideal choice for a wide variety of projects. Tellingly, most developers prefer it to create React projects.

The main difference between Tailwind and its competitors is that it gives developers complete control over the styling of a web application. So, is it the right CSS framework for you? To answer this question, let us take a look at Tailwind’s advantages and disadvantages.

Tailwind CSS: Pros and Cons

Tailwind CSS: Advantages

1. Control Over Styling

Tailwind is a unique CSS framework when it comes to styling web applications, meaning that Tailwind does not have a default theme that you have to use like other CSS frameworks.

For example, you can give each project a different look even if you use the same elements (color palette, size, etc.). Therefore, it’s one of the few CSS frameworks that is not opinionated on how you should style your project. 

2. Faster CSS Styling Process

There is no faster framework than Tailwind when it comes to styling HTML. As a result, you can easily create good-looking layouts by styling elements directly. This is possible because Tailwind offers thousands of built-in classes that do not require you to create designs from scratch.

Therefore, you do not have to write CSS rules yourself. These CSS classes are the main reason why building and styling with Tailwind is so fast. 

3. Responsiveness and Security 

With Tailwind’s pre-built classes, you can design the layout directly in an HTML file. This makes it a very responsive, mobile-friendly CSS framework. Apart from that, Tailwind has proven to be a stable framework since its initial release.

The framework was developed by top-notch engineers, which is why bugs and breaks are rare. 

4. Additional Features 

Tailwind CSS works in the front end of a website. For this reason, it is reasonable for developers to demand ultimate responsiveness. Well, Tailwind provides the ability to create responsive themes for your web applications and remove all unused CSS classes. With PurgeCSS, Tailwind helps you keep your final CSS as small as possible.

Tailwind CSS: Disadvantages

1. Styling and HTML are Mixed

Because you do not have to write CSS rules yourself, Tailwind works differently than most CSS frameworks. While this is great for those unfamiliar with CSS, it also means that Tailwind mixes style rules in with your HTML files.

This goes against the principle of the “separation of concerns.” Many developers prefer to separate page structure and style, claiming that classes make the Tailwind markup process verbose. 

2. It Takes Time to Learn 

Because of the built-in classes, Tailwind CSS is quite learning-intensive. Even for experienced developers, it can be a challenge to learn how to use and fully utilize the pre-built classes. But, of course, as with any other development task, practice makes perfect.

However, if you are confident and quick when it comes to writing CSS classes, Tailwind may not be the best choice for you. Even if that’s true, Tailwind generally makes CSS styling faster in the long run.  

3.  Lack of Important Components

Unlike Bulma and Bootstrap, Tailwind does not have many significant styling components. Unfortunately, this means you have to manually add features like headers, buttons, and navigation bars for web apps.

This is not a significant drawback, as experienced developers can implement these features quickly. However, you will need to spend some time doing so. 

4. Documentation 

Although Tailwind CSS has made great strides when it comes to adding guides and video tutorials, it still lags behind competitors like Bootstrap. Of course, you can always contact the developers if you have a problem.

However, keep in mind that this may take some time. For this reason, you may need to customize the framework to your needs manually.

Is Tailwind Worth Trying?

In a few words, working with Tailwind is quite different from other CSS frameworks. We have identified its main advantages and disadvantages. Based on these features, we can easily say that Tailwind is:

  • An excellent solution for developers familiar with CSS who want to speed up the creation and design process in the long run.
  • Not such a good idea if you are not familiar with CSS or do not want to spend time learning a new CSS framework. 

It becomes clear that it all depends on your personal needs and preferences. However, if saving time on CSS styling is a priority for you, you should definitely give Tailwind a try.

Regardless of whether you choose to use Tailwind or not, it’s evident that many developers use it for good reasons. Since it offers a faster styling process and is a responsive and stable framework, it’s here to stay.

Tailwind can help you save time and change the way you design websites, and so taking the time to test it out is worthwhile.

Source

The post The Pros and Cons of Tailwind CSS first appeared on Webdesigner Depot.


Source de l’article sur Webdesignerdepot

The best way to protect your Java code from avoidable bugs is to use static code analysis tools that can help you find and fix problematic code before it reaches production. Let’s look at some popular static code analysis tools that can be used to test code from a number of different angles.

DeepSource

DeepSource delivers what is probably the best static code analysis you can find for Java. The DeepSource Java analyzer detects 190+ code quality issues, including performance bugs, security risks, bug risks, and anti-patterns. Currently, It supports Gradle Java projects, and in the future, DeepSource will add support for Maven and Android too. DeepSource is also working on bringing Autofix support to the Java analyzer, which will let developers fix issues without writing a single code line.

Source de l’article sur DZONE

I am an « automation fundamentalist ». What I mean by that, is that I will go through large amounts of pain to avoid having to manually type code if I am able to have my computer do it automatically for me. The reasons are fairly self evident, because all bugs originates from a human being having written code at some point in time. Hence, if I can completely avoid manually writing code, the argument is that I can create 100% perfect software systems, that won’t even in theory be allowed to contain bugs of any kind. This idea extends to writing Unit Tests too.

Therefor, I created the ability to automatically generate Unit Tests in Magic. To understand how, watch the following video, where I demonstrate how I invoke an HTTP REST endpoint, for then to persist the invocation, allowing me to « replay » it later. The idea of course, is that being able to replay an HTTP invocation, can help me sanity check my system further down the road, as I modify it for whatever reasons I have to modify it.

Source de l’article sur DZONE

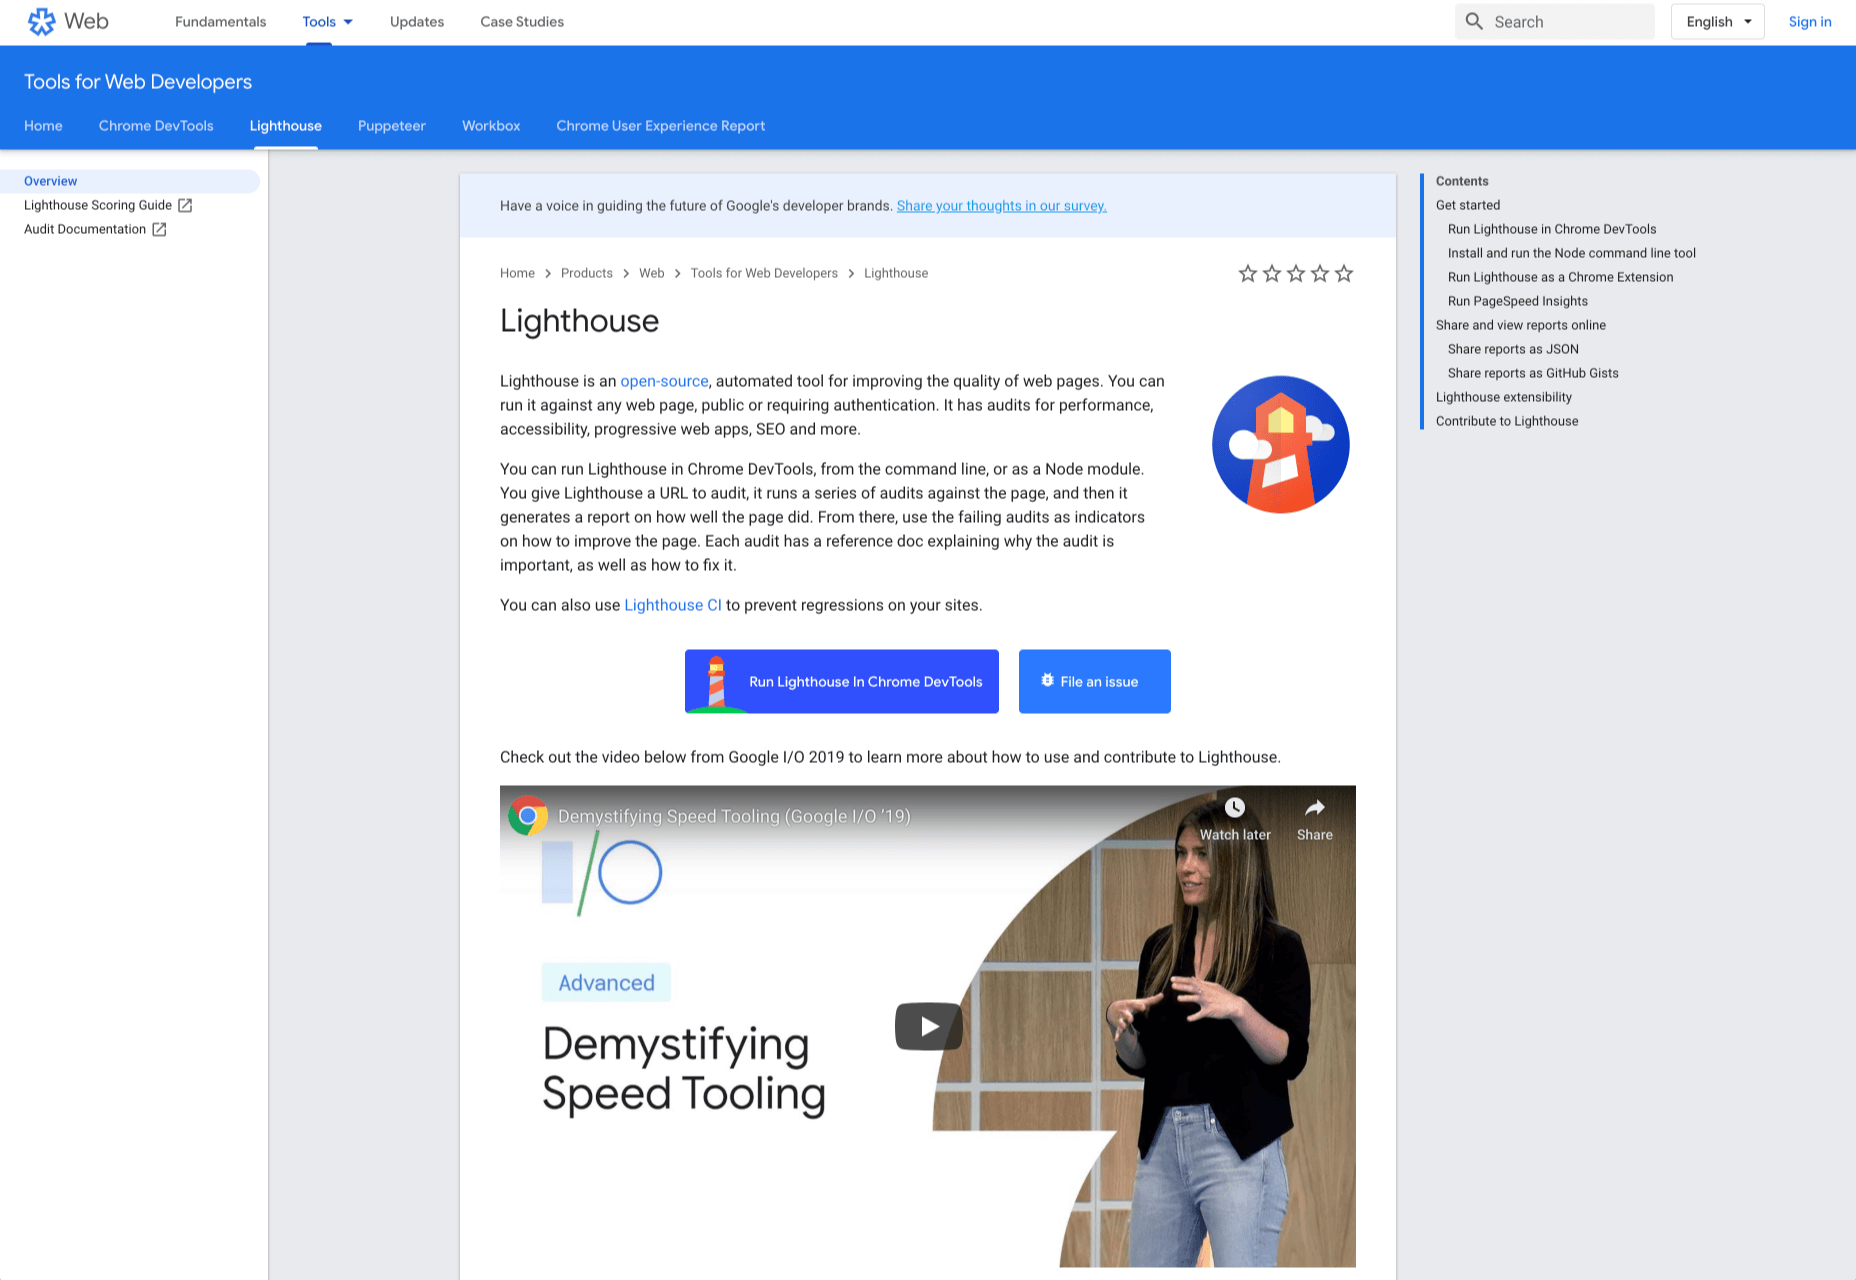
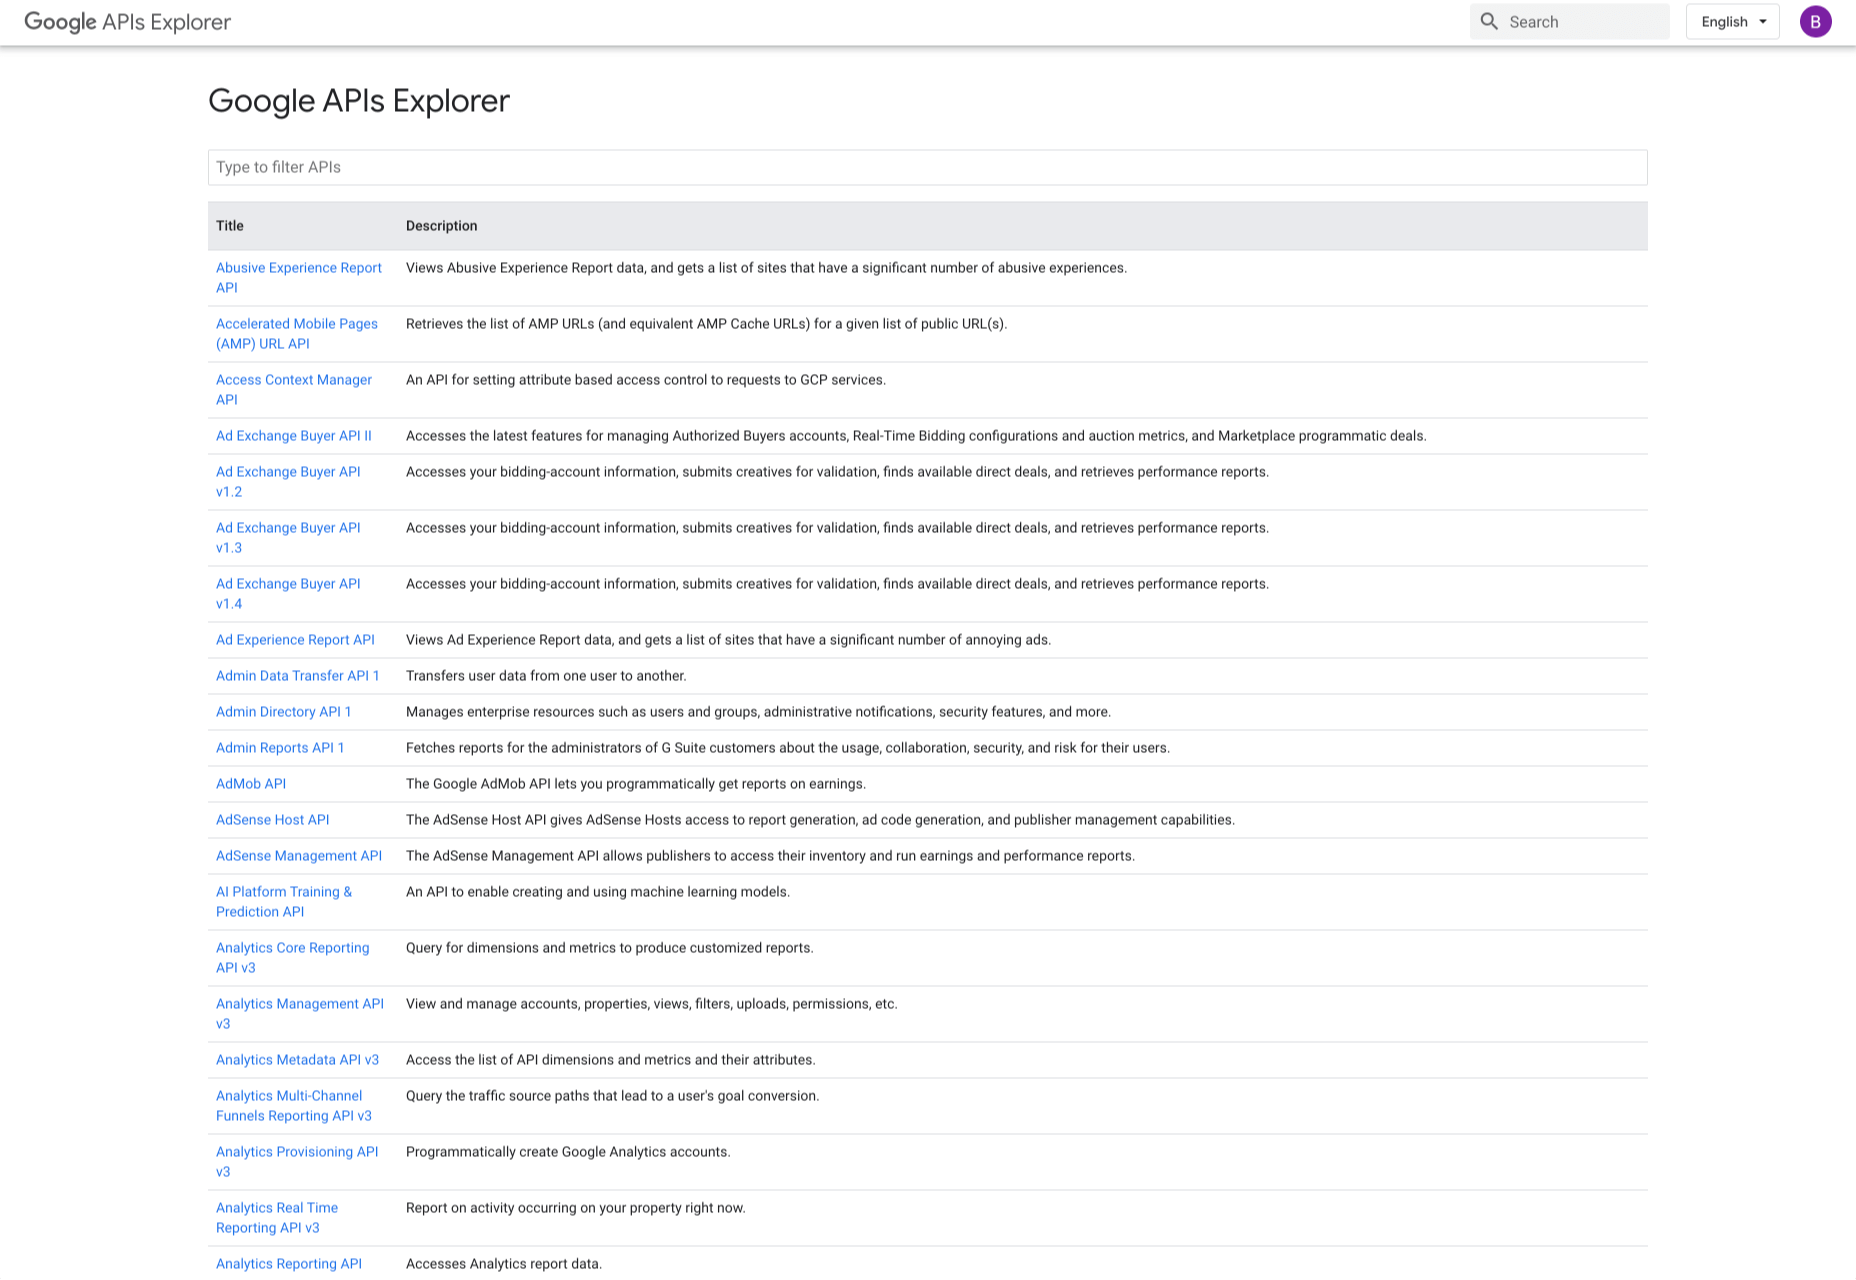
Google resembles an iceberg: there’s the part above the water we can see and use everyday; there’s also the part beneath the water, that we don’t see and know little about.

While many of us are concerned about the aspects of Google we don’t see — the parts that threaten our privacy, or monopolize the web — there’s no denying that Google offers some amazing products and tools, many of them free, all from the convenience of a single login.

Today we’re going to take a look at 12 tools from Google that really do bring something positive to the table.

1. Polymer

Polymer is an open-source JavaScript library from Google for building web applications using Web Components. The platform comes with a ton of libraries and tools to help designers and developers unlock the web’s potential by taking advantage of features like HTTP/2, Web Components, and Service Workers. 

The main feature of Polymer is Web Components. With Web Components, you can share custom elements to any site, work seamlessly with any browser’s built-in elements, and effectively use frameworks of all kinds. Products like LitElement (a simple base class for creating fast, lightweight web components) and PWA Starter Kit make Polymer easy to use. If you like, you can build your app entirely out of Web Components.

2. Lighthouse

Google Lighthouse is an open-source, automated tool for improving the quality of web pages. The software allows you to audit web pages for performance, SEO, accessibility, and more. You can run Lighthouse using ChromeDevTools, directly from the command line, or as a Node module. 

To use Lighthouse in Google Chrome, just go to the URL you want to audit (you can audit any URL on the web), open ChromeDevTools, and click the Audits tab. After you have run the audit, Lighthouse will give you an in-depth report on the web page. 

With these reports, you will see which parts of your web page you need to optimize. Each report has a reference doc that explains why that audit is important and also shows you the steps you can take to fix it. 

You can also use Lighthouse CL to prevent regression on your sites. Using Lighthouse Viewer, you can view and share reports online. You can also share reports as JSON or GitHub Gists. 

Lighthouse also comes with a feature called Stack Packs that allows Lighthouse to detect what platform a site is built on. It also displays specific stack-based recommendations.

3. Google Analytics

Google Analytics is the gold standard of analytics services. Google analytics can be installed on your site for free with a small amount of JavaScript and allows you to see all kinds of details about your site visitors, like what browser they’re using, and where they’re from.

By using Google Analytics you can make decisions about your site based on science, and therefore be somewhat confident that the decisions you make will result in the outcome you are expecting.

4. Flutter

Flutter is Google’s UI toolkit for building natively compiled applications for mobile, web, and desktop from a single codebase. The toolkit is open source and free to use. The best part of Flutter is that it works with existing code. 

The toolkit has a layered architecture that allows for full customization, which results in fast rendering and flexible designs. It also comes with fully-customizable widgets that allow you to build native interfaces in minutes. With these widgets, you will be able to add platform features such as scrolling, navigation, icons, and fonts to provide a full native performance on both iOS and Android.

Flutter also has a feature called hot reload that allows you to easily build UIs, add new features, and fix bugs faster. You can also compile Flutter code to native ARM machine code using Dart native compilers. 

5. Google API Explorer

Google has a huge library of APIs that are available to developers but finding these APIs can be difficult. Google API Explorer makes it easy for developers to locate any API. On the Google API Explorer web page, you will see a complete list of the entire API library. You can easily scroll through the list or use the search box to filter through the API list. 

The best part of Google API Explorer is that each link to a reference page comes with more details on how to use the API. API Explorer is an excellent way to try out methods in the Monitoring API without having to write any code.

6. Puppeteer

Puppeteer is a project from the Google Chrome team. The platform enables web developers to control a Chrome (or any other Chrome DevTools Protocol based browser) and execute common actions, much like in a real browser. Puppeteer is also a Node library and it provides a high-level API for working with headless Chrome. It is also a useful tool for scraping, testing, and automating web pages. 

Here are some things you can do with Puppeteer: generate screenshots and PDFs of pages, UI testing, test Chrome Extensions, automate form submission, generate pre-rendered content, and crawl Single-Page Applications. 

7. Codelabs

Google Developer Codelabs is a handy tool for beginner developers and even advanced developers who want to improve their knowledge. Codelabs provide a guided, tutorial, hands-on coding experience. Codelabs’ site is broken down into several tutorial sessions on different topics. 

With the tutorials on Codelabs, you can learn how to build applications from scratch. Some of the tutorial categories include Augmented reality, TensorFlow, Analytics, Virtual Analytics, G Suite, Search, Google Compute Engine, and Google APIs on iOS. 

8. Color Tool

Color Tool makes it easy for web designers to create, share, and apply colors to their UI. It also measures the accessibility level for any color combination before exporting to the palette. The tool comes with 6 user interfaces and offers over 250 colors to choose from. 

The tool is also very easy to use. All you need to do is pick a color and apply it to the primary color scheme; switch to the secondary color scheme, and pick another color. You can also switch to Custom to pick your own colors. After you have selected all your colors, use the Accessibility feature to check if all is good before exporting it to your palette. 

9. Workbox

Workbox is a set of JavaScript libraries and Node modules. The JavaScript libraries make it easy to add offline support to web apps. The Node modules make it easy to cache assets and offer other features to help users build Progressive Web Apps. Some of these features include pre-caching, runtime caching, request routing, background sync, debugging, and greater flexibility than sw-precache and sw-toolbox. 

With Workbox, you can add a quick rule that enables you to cache Google fonts, images, JavaScript, and CSS files. Caching these files will make your web page to run faster and also consume less storage. You can also pre-cache your files in your web app using their CLI, Node module, or webpack plugin. 

10. PageSpeed Insights

PageSpeed Insights is a handy tool from Google Developers that analyzes the content of a web page, then generates suggestions on how to make the page faster. It gives reports on the performance of a web page on both desktop and mobile devices. At the top of the report, PageSpeed Insights provides a score that summarizes the page’s performance. 

11. AMP on Google

AMP pages load faster and also look better than standard HTML pages on mobile devices. AMP on Google allows you to enhance your AMP pages across Google. It is a web component framework that allows you to create user-first websites, ads, emails, and stories. One benefit of AMP is that it allows your web pages to load almost instantly across all devices and platforms hence improving the user’s experience. 

12. Window Resizer

When creating websites, it is important that developers test them for responsive design – this is where Window Resizer comes in. Window Resizer is a Chrome extension that resizes the browser window so that you can test your responsive design on different screen resolutions. The common screen sizes offered are desktop, laptop, and mobile, but you can also add custom screen sizes. 


Featured image via Unsplash.

Source


Source de l’article sur Webdesignerdepot

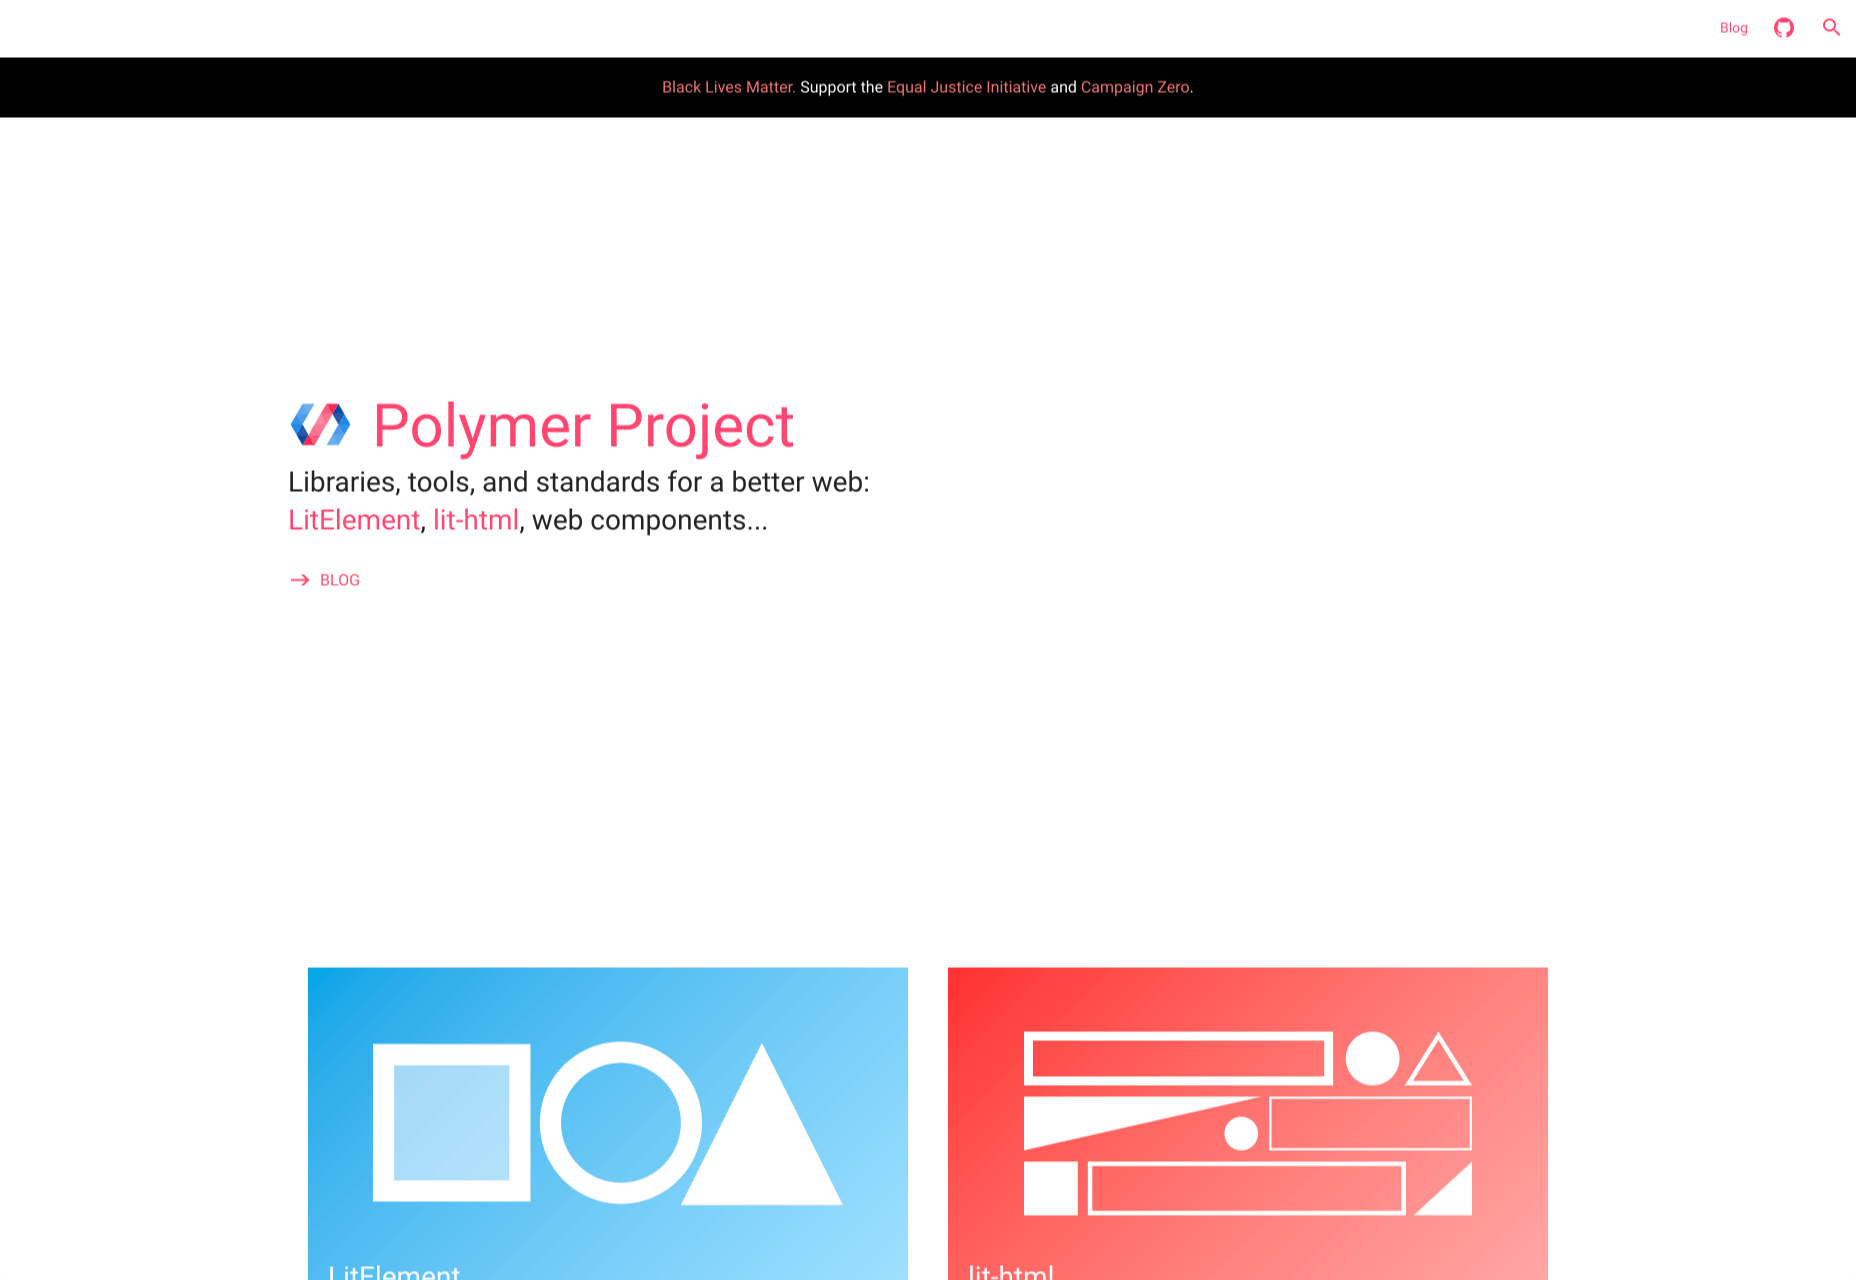
We are gathered here today….

Today I write in memory of Adobe Flash (née Macromedia), something that a bunch of people are actually too young to remember. I write this with love, longing, and a palpable sense of relief that it’s all over. I have come to praise Flash, to curse it, and finally to bury it.

We’ve been hearing about the death of Flash for a long time. We know it’s coming. December 2020 has been announced as the official timeframe for removal, but let’s be real about this: it’s dead. It’s super-dead. It’s people-are-selling-Flash-game-archives-on-Steam dead.

That last bit actually makes me happy, because Flash games were a huge part of my childhood, and the archives must be preserved. Before I’d ever heard of video cards, frames per second, and “git gud”, I was whiling away many an hour on disney.com, cartoonnetwork.com, MiniClip, Kongregate, and other sites, looking for games.

I think we’ve established in my previous work that even as a missionary kid, I did not have a social life.

The Internet itself gave me a way to reach out and see beyond my house, my city, and my world, and it was wonderful. Flash was a part of that era when the Internet felt new, fresh, and loaded with potential. Flash never sent anyone abuse, or death threats. Flash was for silly animations, and games that my parent’s computer could just barely handle, after half an hour of downloading.

I even built my first animated navigation menus in Flash, because I didn’t know any better. At all. But those menus looked exactly like the ones I’d designed in Photoshop, so that’s what mattered to me, young as I was.

That was a part of Flash’s charm, really.

What Flash Got Right

Flash Brought Online Multimedia into the Mainstream

Funny story, JavaScript was only about a year old when Flash was released. While HTML5 and JS are the de-facto technologies for getting things done now, Flash was, for many, the better option at launch. JS had inconsistent support across browsers, and didn’t come with a handy application that would let you draw and animate whatever you wanted.

It was (in part) Flash that opened up a world of online business possibilities, that made people realize the Internet had potential rivalling that of television. It brought a wave of financial and social investment that wouldn’t be seen again until the advent of mainstream social networks like MySpace.

The Internet was already big business, but Flash design became an industry unto itself.

Flash Was Responsive

Yeah, Flash websites could be reliably responsive (and still fancy!) before purely HTML-based sites pulled it off. Of course, it was called by other names back then, names like “Liquid Design”, or “Flex Design”. But you could reliably build a website in Flash, and you knew it would look good on everything from 800×600 monitors, to the devastatingly huge 1024×768 screens.

You know, before those darned kids with their “wide screens” took over. Even then, Flash still looked good, even if a bunch of people suddenly had to stop making their sites with a square-ish aspect ratio.

Flash Was Browser-Agnostic

On top of being pseudo-responsive, the plugin-based Flash player was almost guaranteed to work the same in every major browser. Back in a time when Netscape and Internet Explorer didn’t have anything that remotely resembled feature parity, the ability to guarantee a consistent website experience was to be treasured. When FireFox and Chrome came out, with IE lagging further behind, that didn’t change.

While the CSS Working Group and others fought long and hard for the web to become something usable, Flash skated by on its sheer convenience. If your site was built in Flash, you didn’t have to care which browsers supported the <marquee> tag, or whatever other ill-conceived gimmick was new and trendy.

Flash Popularized Streaming Video

Remember when YouTube had a Flash-based video player? Long before YouTube, pretty much every site with video was using Flash to play videos online. It started with some sites I probably shouldn’t mention around the kids, and then everyone was doing it.

Some of my fondest memories are of watching cartoon clips as a teenager. I’d never gotten to watch Gargoyles or Batman: The Animated Series as a young kid, those experience came via the Internet, and yes… Flash. Flash video players brought me Avatar: The Last Airbender, which never ever had a live action adaptation.

Anyway, my point: Flash made online video streaming happen. If you’ve ever loved a Netflix or Prime original show (bring back The Tick!), you can thank Macromedia.

What Flash Got Wrong

Obviously, not everything was rosy and golden. If it was, we’d have never moved on to bigger, better things. Flash had problems that ultimately killed it, giving me the chance, nay, the responsibility of eulogizing one of the Internet’s most important formative technologies.

Firstly, it was buggy and insecure: This is not necessarily a deal-breaker in the tech world, and Microsoft is doing just fine, thank you. Still, as Flash matured and the code-base expanded, the bugs became more pronounced. The fact that it was prone to myriad security issues made it a hard sell to any company that wanted to make money.

Which is, you know, all of them.

Secondly, it was SEO-unfriendly: Here was a more serious problem, sales-wise. While we’re mostly past the era when everyone and their dog was running a shady SEO company, search engines are still the lifeblood of most online businesses. Having a site that Google can’t index is just a no-go. By the time Google had managed to index SWF files, it was already too late.

Thirdly, its performance steadily got worse: With an expanding set of features and code, the Flash plugin just took more and more resources to run. Pair it with Chrome during that browser’s worst RAM-devouring days, and you have a problem.

Then, while desktops were getting more and more powerful just (I assume) to keep up with Flash, Apple went and introduced the iPhone. Flash. Sucked. On. Mobile. Even the vendors that went out of their way to include a Flash implementation on their smartphones almost never did it well.

It was so much of a hassle that when Apple officially dropped Flash support, the entire world said, “Okay, yeah, that’s fair.”

Side note: Flash always sucked on Linux. I’m just saying.

Ashes to Ashes…

Flash was, for its time, a good thing for the Internet as a whole. We’ve outgrown it now, but it would be reckless of us to ignore the good things it brought to the world. Like the creativity of a million amateur animators, and especially that one cartoon called “End of Ze World”.

Goodbye Flash, you sucked. And you were great. Rest in peace. Rest in pieces. Good riddance. I’ll miss you.


Featured image via Fabio Ballasina and Daniel Korpai.

Source


Source de l’article sur Webdesignerdepot