Articles


What Is Snowflake?

At its core Snowflake is a data platform. It’s not specifically based on any cloud service which means it can run any of the major cloud providers like Amazon Web Services (AWS), Microsoft Azure, Google Cloud Platform (GCP). As a SaaS (Software-as-a-Service) solution, it helps organizations consolidate data from different sources into a central repository for analytics purposes to help solve Business Intelligence use cases.

Once data is loaded into Snowflake, data scientists, engineers, and analysts can use business logic to transform and model that data in a way that makes sense for their company. With Snowflake users can easily query data using simple SQL. This information is then used to power reports and dashboards so business stakeholders can make key decisions based on relevant insights.

Source de l’article sur DZONE


WordPress is by far the world’s most popular CMS. Not only does it dominate the CMS market with a 64% market share, but it also powers 39.6% of all websites. It has taken the internet by storm by democratizing the web for all. Now, anyone can build, manage, and host a successful website without needing a college degree or coding expertise.

However, while WordPress is great at managing many technical aspects, it still can’t do everything for you. Built mostly on PHP, there are often concerns regarding how performant WordPress is. And, with performance impacting everything from bounce rates to SEO rankings to conversions, it’s something that should be on your radar too.

If you don’t know it yet, images are one of the main causes of slow-loading websites. In recent years, WordPress has stepped up its efforts to try and help users with image optimization out-of-the-box.

Still, as we’ll show, it’s not a total solution, and there is still plenty you can do to deliver better experiences on your WordPress website through image optimization.

What is WordPress Image Optimization? Why is it Important?

Simply put, image optimization is anything you do to make images load faster on your website pages. Almost all websites that use images can benefit from some form of image optimization, even those using WordPress.

Why?

Well, performance is a hugely significant factor when it comes to the competitiveness of your website today.

Google has also made performance an increasingly important factor when it comes to SEO rankings. In fact, performance is a direct ranking signal that carries significant weight.

Google’s Page Experience Update that went live in 2021 has been the biggest move in that direction yet. Soon, Google might even use visual indicators in SERP results to distinguish high-performing websites from the rest.

In Google’s own words, “These signals measure how users perceive the experience of interacting with a web page and contribute to our ongoing work to ensure people get the most helpful and enjoyable experiences from the web.”

So, Why Should We Target Images For Performance Optimization?

According to Google, images are the largest contributor to page weight. Google has also singled out image optimization specifically as the factor with the most untapped potential for performance optimization.

This problem isn’t going away soon. According to data by the HTTP Archive, there are roughly 967.5 KB bytes of image data on desktop web pages and 866.3 KB of image data on mobile pages. This is an increase of 16.1% and 38.8%, respectively, over the last five years.

Thanks to popular e-commerce tools like Woocommerce, it’s estimated that up to 28% of all online sales happen on WordPress websites.

And don’t forget, images are both a key part of conveying information to the user and integral to the design of your website. If they take significantly longer to load than your text, for example, it will negatively impact the user experience in a variety of ways.

In summary, optimized images help your WordPress website by:

  • Improving user satisfaction.
  • Improving various traffic metrics, like bounce rates, time-on-page, etc.
  • Boosting your SEO rankings.
  • Contributing to higher conversions (and sales).

How Does Image Optimization in WordPress Work?

WordPress is so popular because it’s a CMS (content management system) that allows anyone to build, design, and manage a website without any coding or advanced technical experience. Advanced features can be installed with just a few clicks, thanks to plugins, and you rarely have to touch the code behind your website unless you want to make some unique modifications.

In short, using a CMS like WordPress shields you from many of the day-to-day technicalities of running a website.

WordPress Image Optimization: What It Can Do

As we mentioned, one of the main reasons WordPress is so popular is because it takes care of many of the technical aspects of running a website. With that in mind, many think that WordPress should also automatically take care of image optimization without them having to get involved at all.

Unfortunately, that’s not really the case.

True, WordPress does offer some built-in image optimization. Whenever you upload an image to WordPress, it currently compresses the quality to about 82% of the original (since v4.5).

In v4.4, WordPress also introduced responsive image syntax using the srcset attribute. This creates four breakpoints for each image you upload according to the default WordPress image sizes:

  • 150px square for thumbnails
  • 300px width for medium images
  • 768px max-width for medium_large images
  • 1024px max-width for large images.

Here you can see an example of the actual responsive syntax code generated by WordPress:

<img loading="lazy" src="https://bleedingcosmos.com/wp-content/uploads/2021/12/33-1024x683.jpg" alt="" class="wp-image-9" width="610" height="406" srcset="https://bleedingcosmos.com/wp-content/uploads/2021/12/33-1024x683.jpg 1024w, https://bleedingcosmos.com/wp-content/uploads/2021/12/33-300x200.jpg 300w, https://bleedingcosmos.com/wp-content/uploads/2021/12/33-768x512.jpg 768w, https://bleedingcosmos.com/wp-content/uploads/2021/12/33-1536x1024.jpg 1536w" sizes="(max-width: 610px) 100vw, 610px">

Depending on the screen size of the device from which a user visits your webpage, WordPress will let the browser pick the most appropriately sized image. For example, the smallest version for mobile displays or the largest for 4K Retina screens, like those of a Mac.

While this may seem impressive, it’s only a fraction of what can be achieved using a proper image optimization solution, as we’ll show later.

Lastly, WordPress implemented HTML native default lazy loading for all images starting with version 5.5.

So, in short, WordPress offers the following image optimization capabilities baked-in:

  • Quality compression (limited)
  • Responsive syntax (up to 4 breakpoints)
  • Lazy loading

WordPress Image Optimization: What it Cannot Do

There are other issues many have with both the implementation of image compression and responsive syntax as it’s used by WordPress. This leads to some users even purposefully deactivating WordPress’ built-in image optimization so they can fully take control of it themselves.

Here are some of the reasons why:

  • WordPress uses a very basic form of quality compression. It does not use advanced technologies like AI and machine learning algorithms to compress images while maintaining maximum visual quality. It’s also lossy compression, so the quality is lost for good. You can clearly see the difference between an original HD image and the compressed version created by WordPress.
  • WordPress only compresses most images by up to 20%, while advanced image optimization tools can reduce all image sizes intelligently by up to 80%.
  • Responsive syntax can provide significant performance improvements over simply uploading a single HD image to be served on all devices and screens. However, it’s still only limited to a set number of breakpoints (typically 3 or 4). Since it’s not dynamic, a whole spectrum of possible image sizes is not created or used.
  • Responsive syntax code is not scalable and can quickly lead to code that’s bloated, messy, and hard to read.
  • WordPress doesn’t accelerate image delivery by automatically caching and serving them via a global CDN, although this can be done using other tools.

Another important optimization feature that WordPress does not have is auto-conversion to next-gen image file formats. Different image formats offer different performance benefits on different devices. Some formats also enable higher levels of compression while maintaining visual fidelity.

Next-gen formats like WebP, AVIF, and JPEG-2000 are considered to be the most optimal formats on compatible devices. For example, until recently, WebP would be the optimal choice on Chrome browsers, while JPEG-4000 would be optimal on Safari browsers.

However, WordPress will simply serve images in the same formats in which they were originally uploaded to all visitors.

How to Measure the Image Performance of a WordPress Website?

As the undisputed king of search engines, we’ll base most of our performance metrics on guidelines established by Google.

Along with its various performance updates, Google has released a number of guidelines for developers as well as the tools to test and improve their websites according to said guidelines.

Google introduced Core Web Vitals as the primary metrics for measuring a web page’s performance and its effect on the user experience. Thus, Core Web Vitals are referred to as “user-centric performance metrics.” They are an attempt to give developers a testable and quantifiable way to measure an elusive and abstract concept such as “user experience.”

Combined with a number of other factors, Core Web Vitals constitute a major part of the overall page experience signal:

You can find a complete introduction to Core Web Vitals here. However, they currently consist of three main metrics:

  • LCP (Largest Contentful Paint): The time it takes the largest above-the-fold element on your page to load. This is typically a full-sized image or hero section.
  • FID (First Input Delay): The delay from the moment a user first interacts with an element on the page until it becomes responsive.
  • CLS (Cumulative Layout Shift): The visual stability with which the elements on a page load.

Here is an illustration of how these metrics are scored:

While these are the three most important metrics to optimize, they are not the only ones. Google still measures other metrics like the FCP (First Contentful Paint), SI (Speed Index), as well as the TTFB (Time to First Byte), TBT (Total Blocking Time), and TTI (Time to Interactive).

A number of these metrics are directly affected by the images used on your web pages. For example, LCP, FCP, and SI are direct indicators of how fast the content of your web page loads and depends on the overall byte size of the page. However, it can also indirectly affect FID by keeping the main thread busy with rendering large amounts of image content or the perceived CLS by delaying the time it takes large images to load.

These metrics apply to all websites, whether they are custom-made or built using a CMS like WordPress.

When using tools like Lighthouse or PageSpeed Insights, you’ll also get scored based on other flags Google deems important. Some of them are specific to images, such as properly sizing images and serving images in next-gen formats.

If you only use built-in WordPress image optimization, you’ll get flagged for the following opportunities for improvement:

Some of the audits it will pass, however, are deferring offscreen images (lazy loading) and efficiently coding images (due to compression):

A Better Way to Optimize WordPress Images: ImageEngine

Billions of websites are all vying for prime real estate on Google SERPs, as well as the attention of an increasingly fussy internet-using public. Every inch matters when it comes to giving your website a competitive advantage.

So, how can you eliminate those remaining performance flags and deliver highly optimized images that will keep both your visitors and Google happy?

Sure, you could manually optimize images using software like PhotoShop or GIMP. However, that will take you hours for each new batch of images. Plus, you still won’t benefit from any automated adaptive optimization.

A more reasonable solution in today’s fast-paced climate is to use a tool developed specifically for maximum image optimization: an image CDN like ImageEngine.

ImageEngine is an automated, cloud-based image optimization service using device detection as well as intelligent image compression using the power of AI and machine learning. It can reduce image payloads by up to 80% while maintaining visual quality and accelerating delivery around the world thanks to its CDN with geographically dispersed PoPs.

Why is ImageEngine Image Optimization Better Than WordPress?

When making a head-to-head comparison, here are the reasons why ImageEngine can deliver better performance:

  • Device Detection: ImageEngine features built-in device detection. This means it picks up what device a visitor to your website is using and tailors its optimization strategy to what’s best for that specific device.
  • Client hints: By supporting client hints, ImageEngine has access to even more information regarding the device and browser to make better optimization decisions.
  • Next-gen formats: Based on optimal settings, ImageEngine automatically converts and serves images in next-gen formats like WebP, AVIF, JPEG2000, and MP4 (for GIFs).
  • Save data header: When a Chrome user has save-data mode enabled, ImageEngine will automatically compress images more aggressively to save on data transfer.
  • CDN with dedicated edge servers: ImageEngine will automatically cache and serve your optimized image assets using its global CDN. Each edge server has device awareness built-in to bring down latency and accelerate delivery. You can also choose to prioritize specific regions.

So, the key differentiator is that ImageEngine can tailor optimizing images for what’s optimal for each of your visitors. ImageEngine is particularly good at serving mobile visitors thanks to WURFL device detection, which can dynamically resize images according to most devices and screen sizes in use today. As of now, this is a completely unique capability that none of its competitors offer.

It allows for far better and more fine-tuned optimization than WordPress’ across-the-board approach to compression and responsive syntax.

If you want, you could turn off WordPress responsive syntax and compression, and you would still experience a performance increase using ImageEngine. However, ImageEngine also plays nice with responsive syntax, so it’s not completely necessary unless you want to serve the highest-fidelity/low-byte-size images possible.

How Does ImageEngine Work with WordPress?

The process ImageEngine uses to integrate with WordPress can be broken down into a few easy steps:

  • Sign up for an ImageEngine account: ImageEngine offers three pricing plans depending on the scale and features you need as well as a no-commitment 30-day free trial.
  • Specify your image origin: This tells ImageEngine where to find the original versions of your images. For a WordPress website, you can just use your domain, e.g., https://mywordpresswebsite.com. ImageEngine will then automatically pull the images you’ve uploaded to your WordPress website.

  • Copy the Delivery Address: After you create an account and specify your image origin, ImageEngine will provide you with a Delivery Address. A Delivery Address is your own unique address that will be used in your <img> tags to point back to the ImageEngine service. Delivery Addresses may be on a shared domain (imgeng.in) or customized using a domain that you own. A Delivery Address typically looks something like {random_string}.cdn.imgeng.in. If your images are uploaded to the default WordPress folder /wp-content/uploads/, you can access your optimized images from ImageEngine simply by changing your website domain. For example, by typing {imageengine_domain}.cdn.imgeng.in/wp-content/uploads/myimage.jpg into your browser, you’ll see the optimized version of that image. Just press the copy button next to the Delivery Address and use it in the next step configuring the plugin.

  • Install the ImageEngine Optimizer CDN plugin: The plugin is completely free and can be installed just like any other plugin from the WordPress repository.
  • Configure and enable ImageEngine Plugin in WordPress: Just go to the plugin under “ImageEngine” in the main navigation menu. Then, copy and paste in your ImageEngine “Delivery Address,” tick the “Enabled” checkbox, and click “Save Changes” to enable ImageEngine:

Now, all ImageEngine basically does is replace your WordPress website domain in image URLs with your new ImageEngine Delivery Address. This makes it a simple, lightweight, and non-interfering plugin that works great with most other plugins and themes. It also doesn’t add unnecessary complexity or weight to your WordPress website pages.

ImageEngine vs Built-in WordPress Image Optimization

So, now let’s get down to business by testing the performance improvement you can expect from using ImageEngine to optimize your image assets.

To do this test, we set up a basic WordPress page containing a number of high-quality images. I then used PageSpeed Insights and the Lighthouse Performance Calculator to get the performance scores before and after using ImageEngine.

Importantly, we conducted this test from a mobile-first perspective. Not only has mobile internet traffic surpassed desktop traffic globally, but Google themselves have committed to mobile-first indexing as a result.

Here is a PageSpeed score using the Lighthouse calculator for WordPress with no image optimization:

As we can see, both Core Web Vitals and other important metrics were flagged as “needs improvement.” Specifically, the LCP, FCP, and TBT. In this case, both the LCP and FCP were a high-res featured image at the top of the page.

If we go to the opportunities for improvement highlighted by PageSpeed, we see where the issues come from. We could still save as much as 4.2s of loading time by properly resizing images and a further 2.7s by serving them in next-gen formats:

So, now let’s see how much ImageEngine can improve on that.

The same test run on my WordPress website using ImageEngine got the following results:

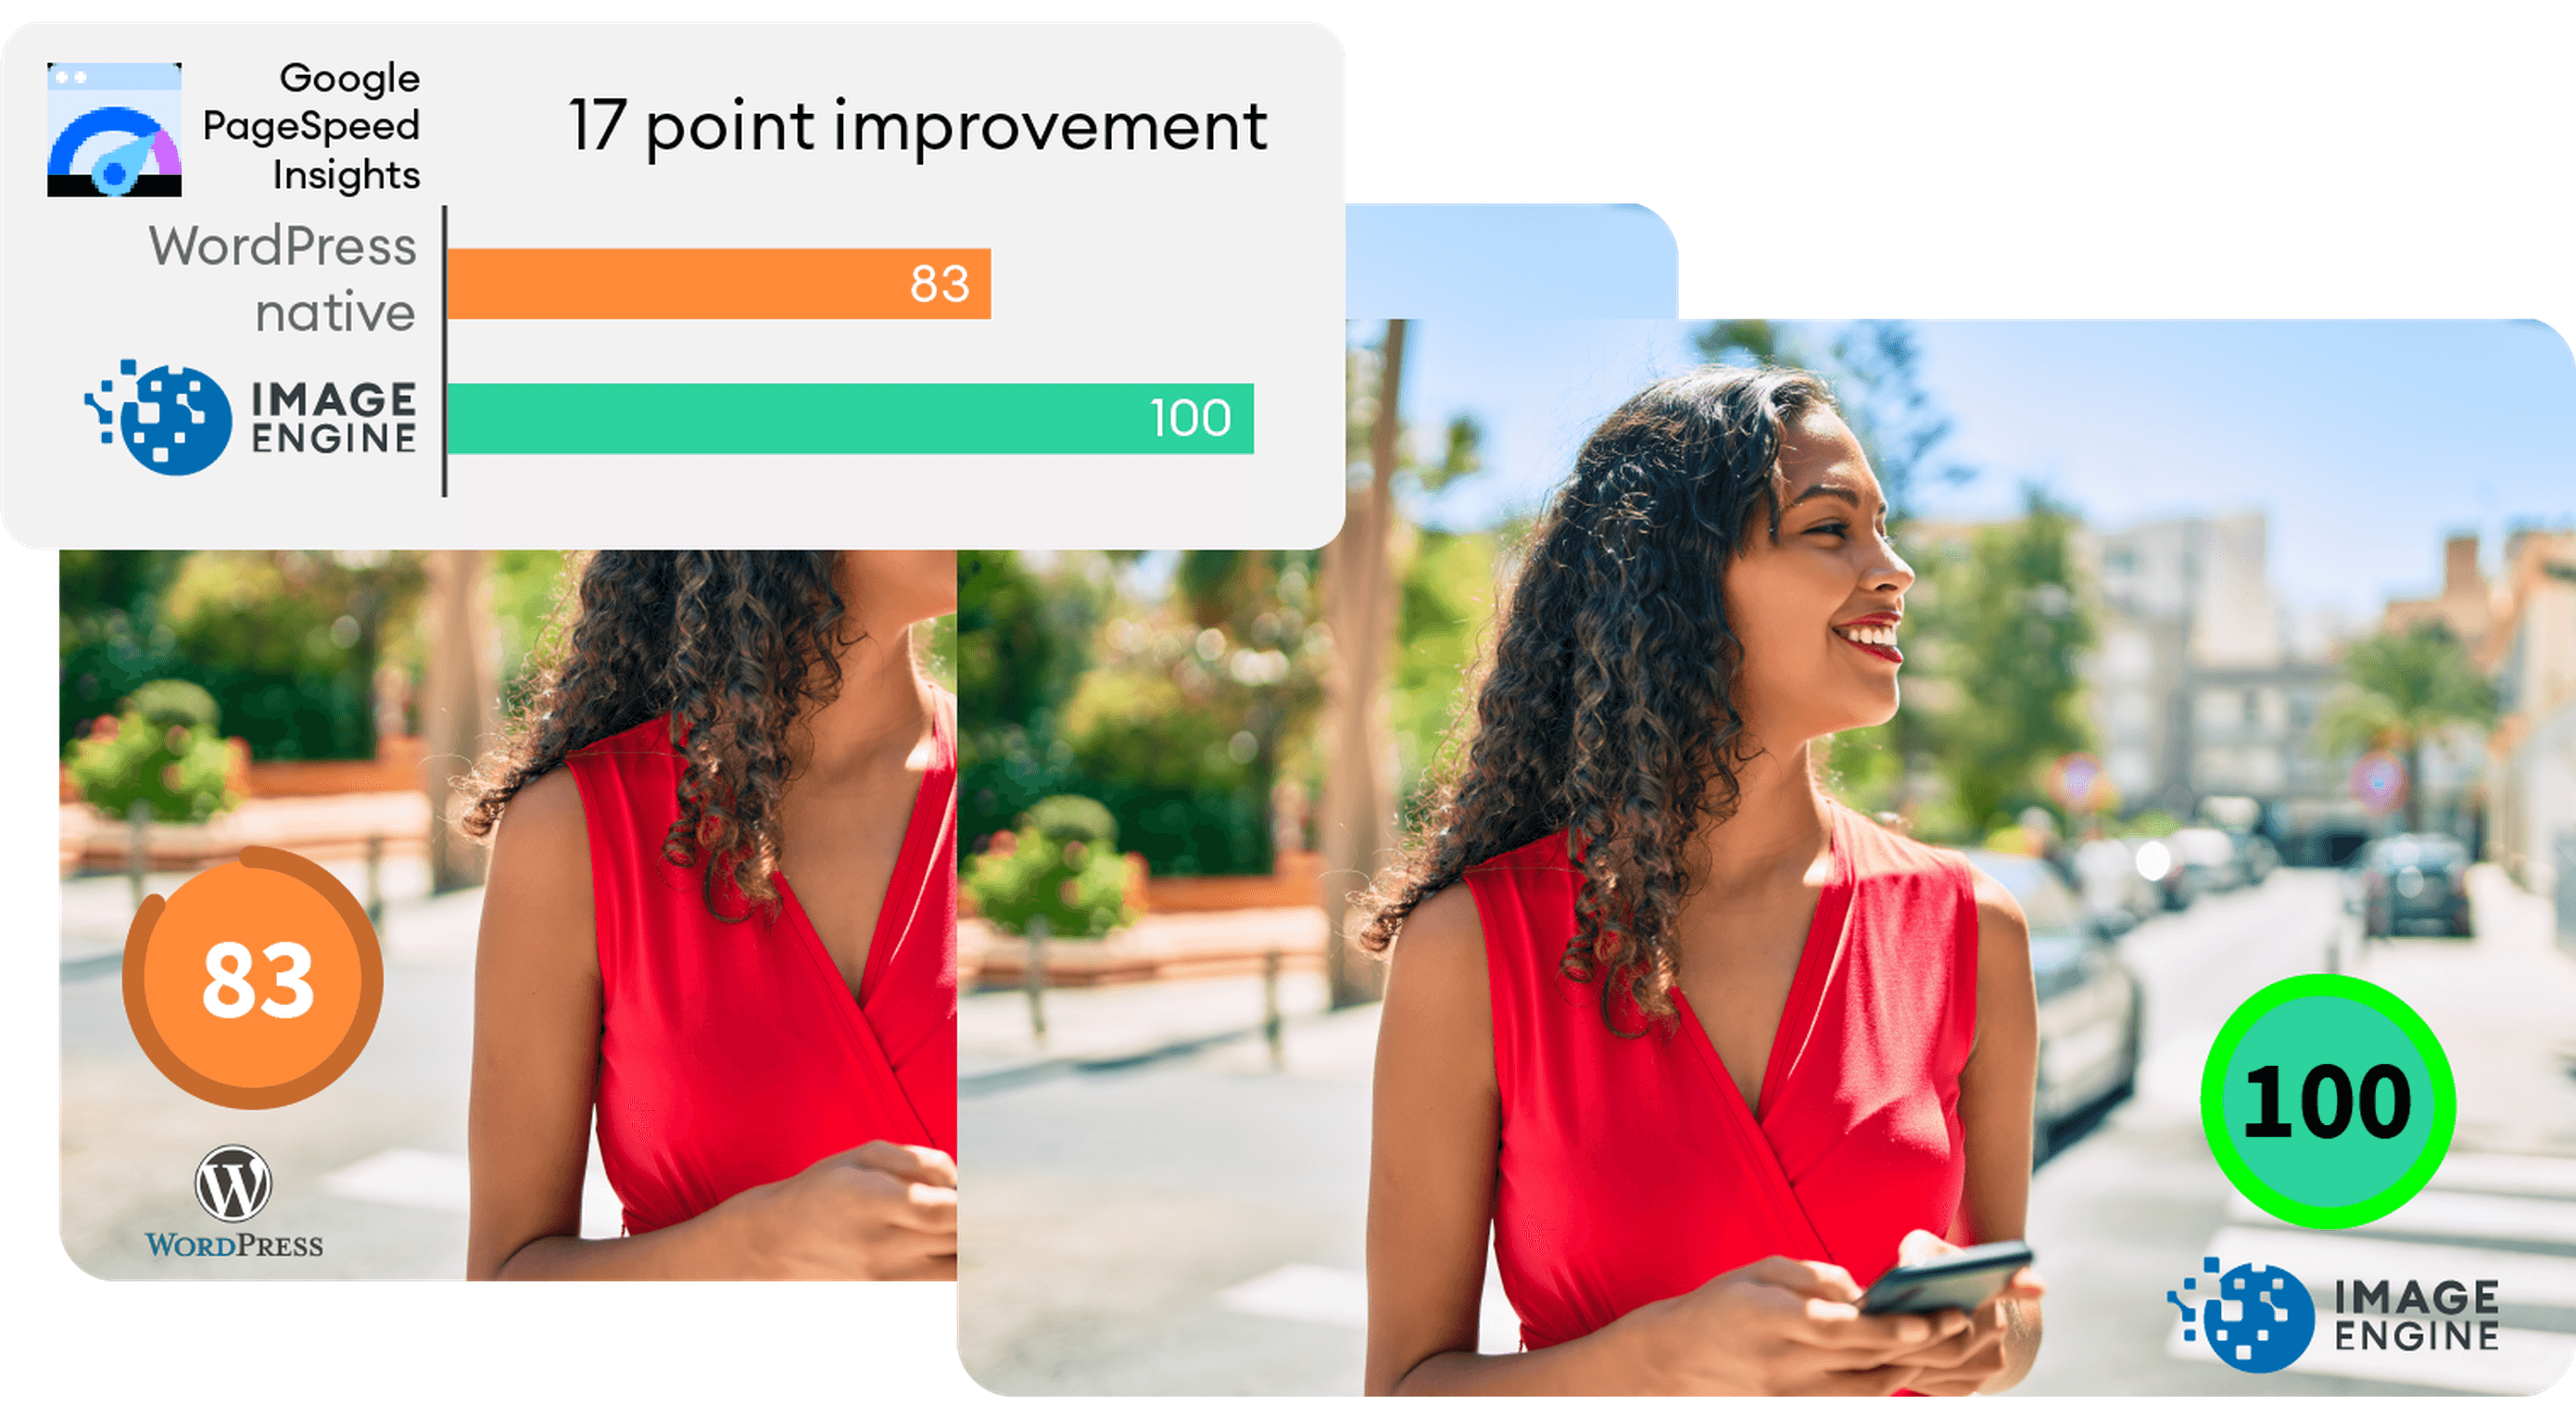
As you can see, we now have a 100 PageSpeed score. I saved roughly 2.5s on the SI (~86%) as well as roughly 1.7s on the LCP (~60%). There was also a slight improvement in the FCP.

Not only will you enjoy a stronger page experience signal from Google, but this represents a tangible difference to visitors regarding the speed with which your website loads. That difference will lead to lower bounce rates, increased user satisfaction, and more conversions.

There was also a 53% overall reduction in the total image payload. This is impressive, considering that it’s on top of WordPress’ built-in compression and responsive syntax.

Conclusion

So, as someone with a WordPress website, what can you take away from this?

Well, first of all, WordPress does feature some basic image optimization. And while not perfect, it should help you offer reasonable levels of performance, even if you use a lot of image content.

However, the caveat is that WordPress applies aggressive, across-the-board compression, which will lead to a noticeable reduction in visual quality. If you use WordPress for any type of website where premium quality images are important, this is a concern — for example, as a photography portfolio, exhibition, or image marketplace like Shutterstock.

By using ImageEngine, you can reduce image payloads and accelerate delivery even further without compromising too harshly on visual quality. What’s more, ImageEngine’s adaptive image optimization technology will provide greater improvements to more of your visitors, regardless of what device(s) they use to browse the web.

Whether or not you still want to use WordPress’ built-in optimizations, ImageEngine will deliver significant improvements to your user experience, traffic metrics, and even conversions.

Plus, true to the spirit of WordPress, it’s extremely simple to set up without any advanced configuration. Just sign up for ImageEngine in 3 easy steps, install the plugin, integrate ImageEngine by copy/pasting your image domain, and you’re good to go.


[ This is a sponsored post on behalf of ImageEngine ]

Source

The post WordPress Website Analysis: Before & After ImageEngine first appeared on Webdesigner Depot.

Source de l’article sur Webdesignerdepot

You’ve heard of the supply chain, but what about the software supply chain? 

Unlike the standard supply chain that you often hear about in the news, this week’s episode of Dev Interrupted dives into the supply chain responsible for holding together the systems that companies, orgs and governments depend upon. 

Source de l’article sur DZONE

The importance of scientific research cannot be overstated. User research is crucial to the success of any UX design, and this article will explain all the reasons why.

But first, we will explore what UX research is and how it can give you valuable tools. Then we will analyze why user research is an ongoing, dynamic process.

By the end of this 5-minute read, you will know every efficient research method (qualitative and quantitative) and how to choose the right one(s) for a new or existing UX project.

What is UX Research?

In a few words, we could say that UX research is about observation techniques, feedback methods, and analysis of the whole user experience of a project. As in any scientific research, UX research analyzes how users think and what their motivations and needs are.

The research methods of UX can be divided into two main types: quantitative and qualitative.

Quantitative Research Methods

These methods are all about statistics and focus on numbers, percentages, and mathematical observations. UX designers later transform such numerical data into useful statistics that you can use in UX designs.

To be precise, there are numerous data collection platforms that UX designers use like Google Analytics, Google Data Studio, etc.

Qualitative Research Methods

Qualitative research aims to understand people’s needs and motivations through observation. This includes numerous methods: from interviews and usability testing to ethnographic and field studies.

In general, qualitative research is crucial for us UX designers because it is easier to analyze than quantitative and we can use it quickly in our projects.

Why is UX Research an Ongoing Process?

Suppose you are about to create a UX wireframe. The process is pretty simple. You start with research, proceed with sketching, then prototype and build. But how many times have you gone back to the previous step of the process?

A UX design is completely dynamic and rarely finished. For this reason, UX research should be viewed as an ongoing process. When I stopped worrying about going through this loop over and over again, I immediately became a better UX designer.

Why Should You Invest in UX Research? 

There are many reasons why you should always conduct UX research before you start sketching and prototyping a wireframe:

  1. Stay relevant: Via UX research, you will ensure that you understand what your users need and tailor your product accordingly.
  2. Improve user experience: With comprehensive UX research, you’ll be one step closer to delivering a great user experience.
  3. Clarify your projects: With UX research, you can quickly identify the features you need to prioritize.
  4. Improve revenue, performance, and credibility: When you successfully use UX research, you can boost the ROI (Return on Investment).

9 Effective UX Research Methods  

It becomes clear that UX research is very important to the success of any UX project. All successful approaches derive from three basic foundations: Observation, understanding, and analysis.

So let us take a look at the most popular and effective qualitative and quantitative research methods.

Interviews 

UX designers can conduct one-on-one interviews to communicate with users and analyze the context of the project. This is a very effective UX research method. You just need to set your goals.

  • Difficulty: Medium/Low
  • Cost: Average
  • Phase: Predesign, During Design Phase

Surveys And Questionnaires

This is a very effective approach if you want to gather valuable information quickly. There are many tools like PandaDoc and Wufoo that allow you to create engaging questionnaires and surveys.

  • Difficulty: Low
  • Cost: Low
  • Phase: Predesign, Post Design Phase

Usability Tests

Usability testing is an essential method if you want to test your product in terms of user experience. It can be applied during or after the creation of an app, site, etc.

  • Difficulty: Medium
  • Cost: Average
  • Phase: During Design Phase

A/B Tests

A/B testing is by far the best way to overcome a dilemma. If you do not know which element to choose, all you have to do is organize an A/B test and show each version to a number of users. Based on their feedback, you can then decide which version is the best.

  • Difficulty: Low
  • Cost: Low
  • Phase: During Design Phase

Card Sorts 

With card sorts, you can help your users by providing them with some product content categories (labeled card sets). This is a very cheap and easy way to understand what your users prefer and how they interact with the content you have just designed.

  • Difficulty: Medium
  • Cost: Average
  • Phase: During Design Phase

Competitive Analysis

Analyzing what your competitors are doing differently is critical to the initial stages of a UX design. This will help you identify their strengths and weaknesses and optimize your product.

  • Difficulty: Medium
  • Cost: Average
  • Phase: Predesign

Persona And Scenario Building 

Creating a user persona and a specific scenario for your project is critical. First, you need to build a user persona by integrating the motives, needs, and goals of your target audience.

Then, you can create a scenario that leverages all of this valuable information to deliver a top-notch user experience.

  • Difficulty: Medium
  • Cost: Average
  • Phase: Predesign

Field Studies 

Although a field study is a very effective UX research method, it is also expensive and difficult to conduct. However, there is nothing like field research when it comes to obtaining real-life data.

  • Difficulty: High
  • Cost: High
  • Phase: Predesign, During Design Phase

Tree Tests

Tree testing is a UX research method that you can apply to your designs during or after the construction phase. The process is fairly simple: you provide users with a text-only version of your product and ask them to complete certain tasks. This tactic is a great way to validate your product’s architecture.

  • Difficulty: High
  • Cost: High
  • Phase: During and Post Design Phase

How to Choose the Right UX Research Method?

Good planning is the most important thing for us UX designers. If you know exactly what the UX problem is, you can solve it quickly.

The methods analyzed above are just some of the research tactics used by UX designers. Choosing the right user research method for a project is not easy. To do so, you should first define your goals.

Source

The post How to Get Started With UX Research first appeared on Webdesigner Depot.

Source de l’article sur Webdesignerdepot
Picture a dark office, blinds drawn. Picture a UX designer smoking a cigar. See the light filtered through the smoke whipped to fog by a spinning ceiling fan. Watch as the UX designer sits at a desk and considers the website.

The UX designer has devised a series of tests to determine if a green button is better than a red button. One of them involves tipping a tortoise onto its back. He looks the website over carefully and says, “Describe in single words, only the good things that come to mind about your mother.”

The website pauses, sweating under pressure, then replies, “Let me tell you about my mother…”

BLAM! The website pulls the trigger of an unseen gun, and the UX designer collapses, leaving the project to be rebuilt from scratch in Material by Harrison Ford, with overuse of Post-its delegated to Edward James Olmos.

Who Does UX Testing Actually Serve?

In the past’s bleak dystopian future (1982’s Blade Runner was set in 2019) no one benefitted from asking the wrong questions. And little has changed.

Designing any test to verify UX is fraught with as many complications as administering the test. Questions are skewed by bias, conscious or otherwise, and competing agendas. Even with something as apparently simple as a split test, the potential for distortion is immense.

When planned by a designer, a UX test offers little benefit to a client; the benefit is to the designer, who can then say their ideas are validated (or not).

Imagine hiring a developer to code a website, only to discover that the developer didn’t know CSS and expected to be paid to learn it before completing the work. You would hire someone else because that developer isn’t qualified.

From a client’s perspective, a UX designer should know, through experience, whether a green button is better than a red button. Designing an elaborate test to split-test the button color serves little purpose other than indemnifying the designer against mistakes.

The ROI of UX Testing

It’s widely accepted that there is substantial ROI (Return On Investment) from UX testing. We’ve all heard apocryphal stories about sites that split-tested their checkout and improved retention by 5%.

I’m going to go out on a limb and say that without user testing, that site could have improved its checkout retention by 4.9% simply by hiring a competent, experienced designer. But what about the remaining 0.1%? Well, for most sites, 0.1% represents very little profit. And the cost of recovering it via testing far exceeds the benefits.

When a company the size of Amazon, Netflix, Spotify, or Google split tests a website, it can afford to allocate $25k for user testing because it stands to gain 0.1%, and that represents far more than $25k. To meet the same 0.1% improvement, a small business has to design and run the same tests, incurring the same costs. But in the case of a small business, $25k could eat up all of its profits.

UX testing almost always works. But it is only profitable at scale.

If a good UI designer with a grounding in UX can improve checkout retention by 4.9%, tripling the project budget for just 0.1% more is a tough sell. Bluntly, that $25k is better spent on advertising.

What UX Designers Can Learn From Psychiatry

We all have the tendency to think we’re unique. It’s a survival trait attributed to our prehistoric brain. That belief in uniqueness is particularly strong in highly competitive people. We all think our site, our side-project, our approach are original. And we’re all wrong.

When a psychiatrist sits down with a patient, they have two immediate goals: categorize that patient into an established diagnosis, and assess the severity of the condition. It may be that the patient is depressed or anxious or even suffering from a potentially more debilitating condition like schizophrenia. What the psychiatrist is not trying to do, is define a new illness.

Occasionally — perhaps once per decade — a genuinely unusual patient will present themselves, and a new form of illness is considered. New treatments are found and tested. These treatments are rarely developed on behalf of individual patients; doctors work with grants from governments, medical schools, or the pharmaceutical industry and publish their results.

The vast majority of websites face similar problems. They deal with similar demographics, work within a similar culture, and deal with similar technology. As such, they can be categorized in the same manner a psychiatrist categorizes patients.

The key to delivering successful UX solutions is not UX testing in individual cases, but rather UX research, examining similar projects, and cribbing their solutions. If you categorize a project accurately, you’ll find a solution readily available.

Replacing User Testing With UX Best Practices

Your client doesn’t need to pay for UX testing to benefit from it. Enterprise sites, government sites, and even personal projects will test UX patterns. Sites like Shopify or Stripe will user-test their checkout processes at scale and enable companies to benefit from the results by adopting their platforms.

If you’re currently testing designs for small business, one of two things is true: either you’re wasting your client’s money investigating a problem someone else has already solved, or you’re designing something so original that it has no precedent (and you probably shouldn’t be).

Designers should be opinionated. Designers should know UX best practices and how they apply to a range of scenarios. Designers should be capable of making an educated guess. Designers should be self-validating.

Once or twice in your career, you may find a legitimate need to test something. However, the vast majority of the time, the correct answer is to tip the tortoise back onto its feet and choose whichever color button has the higher contrast.

Featured image: Still of Brion James in Blade Runner. Copyright Warner Bros. Entertainment

Source

The post The Case Against UX Testing first appeared on Webdesigner Depot.

Source de l’article sur Webdesignerdepot

There was a point at which I was very close to losing my business, and I didn’t realize how close.

I wasn’t always a good planner, and I didn’t plan to start an agency. One day I was a freelance graphic designer, my job list grew, I hired some help, and suddenly I was managing a team.

There isn’t a guidebook for new business owners, you have to learn on the job, and there’s no one-size-fits-all approach. We expanded rapidly from two to four people, then seven, and suddenly we hit 16 employees in just 18 months. It was pretty scary and felt like driving on the freeway without brakes. A client shared a story that they were turning over $20m, and the owner was only taking home $30k. It felt like where I was headed. At that point, I could easily have lost it all.

I took a hard look at the numbers and realized that we were barely breaking even, let alone profitable. That needed to change to stabilize the business and regain control of my operations. The change wasn’t easy, and there were some hard lessons, but 11 years later, with a strong local team and 40+ awards for our work, I’m thankful for that wake-up call.

There are other people in my position struggling with the same issues I faced, so I’d like to share the four key things I did that helped turn things around and move us from surviving to thriving.

1. Don’t Diversify Your Services

I wanted to do it all, and as the business owner, it was hard to turn down a new client. Our instincts are to help, and declining opportunities feels wrong. In our industry, digital agencies, especially web design agencies, try to cover all bases from marketing, SEO, adwords, design, photography, and coding. Everyone wants to be a one-stop shop for clients. I used to be that person: I would wash your car and shine your shoes if I could.

Do not give in to that fear.

When you’re a generalist, you spread yourself too thin. I know: a decade ago, we were offering dozens of services outside of the web design realm: packaging, branding, copywriting, sticker design, SEO, hosting, analytics, you name it, we provided it. We used over seven different CMS for our projects. If a client wanted it, we tried to offer it, no matter how unsuitable it was for us.

On the surface, we fulfilled our projects, and our clients were always thrilled with the results. But below the surface, our operations were dissolving into a mess. Our eyes weren’t on the prize; we were always chasing after each little job for cash. It took too much time to learn new skills. When I looked at our timesheets and deducted the unbillable hours, our projects would hardly break even.

What hurt us even further is that with diversifying, we had to manage multiple workflows, software, and systems: Sketch, Illustrator, Photoshop, WordPress, Joomla, Drupal, Google Analytics, Final Cut Pro, etc. It was expensive with minimal return. It was like an Olympic swimmer signing up for a swimming-diving-ice-skating club when their passion is swimming.

So I took a step back. I boiled it down to what we enjoyed and excelled at. Ask yourself: for what do you want to be known? For us, it was psychology-driven, conversion-focused web design. This was the service our team had the most skills in and collectively could give the best value to our clients. Once I’d figured that out, it was easy to eliminate those other services and specialize.

You can niche down by service or industry and be the specialist in what you offer.

2. Know Your Numbers

The first red flag that my business was in trouble was when I said to my accountant, “I feel like my business is doing great.” He replied, “I don’t care how you feel. The facts are in the numbers. Show me your accounts, and I’ll tell you if you’re actually doing well.” As an intuition-driven guy, it was a real eye-opener; I’d only ever relied on gut instinct.

At one point, we had a ton of work coming in, so I hired a few juniors to help the rest of the team. The team grew to 16, and the vibes in the studio were great, but the numbers weren’t. Instead of increasing efficiency, projects took 40 hours longer than they should have done. Why? The seniors and mid-level designers were taking time out to train the juniors! Reassessing the team showed me I needed to hire experienced staff, so projects ran on time and budget. It was a hard decision but a necessary one to keep us afloat.

The crucial numbers for any design agency are your timesheets, where bottlenecks lie, how much you’re spending, how long a project takes; these determine your actual margins. Setting up quantitative software like Toggl, Gantt, and Asana were a game-changer for us. They gave our project management real purpose and potential. Knowing the average hours our primary type of project took made it easy to give clients realistic deadlines, anticipate the need for fresh hiring, and know when our plates were full. You do not want to bite off more than you can chew.

3. Become The Best Fit For Your Target Market

You can’t please everyone, and frankly, you shouldn’t be trying to. One type of bait won’t attract every kind of fish. First, identify the type of fish you want to catch, the pond where this type of fish lives, and finally, bait your hook with something that type of fish can’t resist.

Your sales team should be able to identify them instantly, and all you then need to do is streamline your team, process, and systems towards being the best fit for them.

4. Double Down On Marketing That Works

There are many different marketing avenues you can go down, but go down too many, and it becomes a tangled web of confused messaging.

Remember, just because your competitors are doing it does not mean it’s the most effective approach for your target market.

There are really only inbound and outbound types of strategies, and it’s a great idea to list out the pros and cons (and the ROI of each) concerning your target market. Or, you can approach marketing based on your existing skillset — for example, if you detest being in front of a camera and don’t want to do video marketing, then just don’t do it.

Identify what works for you, and then be consistent. Consistency is the secret to a successful marketing strategy.

Source

The post How I Saved My Design Agency & Tripled My Profits first appeared on Webdesigner Depot.

Source de l’article sur Webdesignerdepot

Paris, le 10 janvier 2022 – Gémo se dote aujourd’hui de nouvelles solutions technologiques centrées sur la data, avec l’offre de migration RISE with SAP. Objectif : développer une approche omnicanale de pointe, conjuguant parfaitement ses lieux de ventes physiques et son commerce en ligne. Le maillage de ses entrepôts et de ses magasins représente en effet un atout clé pour l’enseigne familiale du groupe Eram, qui entame, grâce à SAP S/4HANA, une stratégie d’accélération de sa transformation numérique pour en faire un véritable levier de croissance.

SAP, Google Cloud et delaware, trois acteurs au service de la simplification

SAP, fidèle à ses ambitions, démontre une fois de plus sa capacité à apporter tous les outils nécessaires pour s’adapter aux évolutions du marché et notamment à celui du prêt-à-porter. Fort de son expertise de leader des logiciels de gestion d’entreprise sur de multiples industries, SAP a en effet toutes les cartes en main pour accompagner Gémo dans le challenge que l’enseigne souhaite relever à horizon 2025.

Le choix de Google Cloud s’inscrit dans une logique de capital technologique. A travers cette migration dans le cloud, réfléchie, progressive et déterminée, Gémo souhaite valoriser la stratégie de big data déjà engagée avec Google. Pouvoir intégrer parfaitement les données SAP, tout en bénéficiant de la sécurité, de la flexibilité, des capacités d’analyses et de la résilience de l’infrastructure, a été décisif dans la sélection de Google Cloud.

Pour intégrer SAP S/4 HANA et ses modules spécialisés, Gémo s’adosse à un acteur local et international reconnu sur le marché SAP. delaware, est un expert de l’intégration SAP dans l’industrie du retail / fashion et est notamment présent à Nantes près du siège de Gémo. Il a su démontrer la valeur ajoutée de la solution SAP pour Gémo et déployer les équipes d’experts nécessaires pour accompagner cette transformation.

Avec 440 magasins, 4 000 collaborateurs et plus de 12 000 références produits, l’enseigne Gémo habille aujourd’hui 1 français sur 5, et ambitionne d’entrer dans le top 5 des acteurs du marché de l’équipement de la personne. La modernisation des outils, basée sur un cœur SAP, doit permettre de répondre aux ambitions de croissance omnicanale, en France et à l’international, en intégrant de nouveaux modèles de business.

Une transformation numérique engagée pour soutenir la croissance à venir

Les technologies proposées aujourd’hui par l’offre « Business Transformation as a Service » de RISE with SAP ont été bâties dans le but de soutenir cette croissance et d’apporter les solutions innovantes afin :

  • d’accélérer le Time To Market de l’ensemble des projets : les distributeurs producteurs se doivent d’être rapides pour répondre immédiatement aux demandes des consommateurs ;
  • de tenir les engagements dans le taux de service ;
  • de personnaliser l’expérience client ;
  • d’assurer la fluidité et l’efficacité de la chaîne d’approvisionnement et de distribution ;
  • d’apporter le meilleur sur la disponibilité des collections selon les saisons et sur la centralisation de l’offre ;
  • et de garantir la pérennité de l’entreprise et préserver sa rentabilité.

« L’accompagnement de la stratégie de transformation de Gémo est la raison d’être de ce partenariat  à haute valeur ajoutée avec SAP, Google Cloud et delaware. C’est en effet en trouvant de nouveaux relais de croissance avec une approche omnicanale, en améliorant l’expérience de nos clients et en garantissant l’excellence opérationnelle de nos chaînes logistiques que nous assurerons à notre groupe une place de leader dans le secteur hautement compétitif de l’équipement de la personne en France, et à l’international, pour les prochaines décennies », annonce Philippe Thirache, Directeur Général Gémo.

« Accompagner l’enseigne Gémo dans sa transformation numérique est une grande fierté pour nous aujourd’hui. D’autant que nous avançons avec la même vision, toujours tournée vers le client et avec l’ambition d’améliorer et de simplifier la vie de chacun. Nous avons hâte de constater le fruit de ce nouveau partenariat et de permettre à Gémo de déployer sa stratégie omnicanale.» précise Frédéric Chauviré, Directeur Général SAP France

« Nous sommes fiers d’accompagner une marque comme Gémo et un groupe comme Eram, fleurons de la distribution française, dans leur accélération numérique, et de démontrer notre pertinence technologique dans leur stratégie de croissance, de soutenir l’enrichissement constant de leur expérience et de leur satisfaction client. » explique Anthony Cirot, Directeur général de Google Cloud France.

« Gémo est une entreprise engagée, ancrée sur son territoire, et fait partie des leaders sur son marché. Nous sommes ainsi particulièrement fiers de participer à la transformation de cette enseigne française reconnue. Les experts et la direction de delaware sont mobilisés pour faire de ce projet une réussite à la hauteur des ambitions de Gémo. A travers ce programme et avec le concours du groupe Eram, nous continuerons de favoriser la démarche invest in digital people en faveur de la reconversion professionnelle dans le secteur du numérique » complète Aymeric Fosset, associé delaware.


The post SAP, Google Cloud et delaware accompagnent la marque de prêt-à-porter Gémo dans sa stratégie omnicanale appeared first on SAP France News.

Source de l’article sur sap.com

It’s finally here, the end of season 1 of the podcast is upon us! To celebrate, Santa is bringing something special – entrepreneurship advice for all the would-be founders of the world, ages 1 to 92.

Brian Singer, co-founder & CPO of Nobl9, sits down with Dev Interrupted to help us close out season 1 with a conversation on what it takes to found your own company. Having founded a pair of companies, one of which he sold to Google, Brian has a deep understanding of what it takes to successfully found and scale a startup. More than that, he knows what VCs are looking for. 

Source de l’article sur DZONE

Maps are a fascinating method for delivering content. At their best, they can create an intuitive way of presenting information and interacting with it. This is the advantage that digital maps, through mobile apps and websites, have over print maps and images where no interactivity is possible.

But it’s important to understand that more data ≠ better experiences. We all now have so much data available to us through multiple services that, arguably, the greatest challenge isn’t sourcing information but filtering it out. We can only handle so much information input before we become overloaded. This issue risks being omnipresent with maps. There are so many potential points of interest on a map that it’s essential to be clear about what needs to be exposed to users.

Also, UX design, map design, and user interface are all critical. While maps can be a powerful way of drawing people in, if end-users feel that you didn’t even consider the visual design, they’ll ‘bounce off’ your site or app in moments.

Common Use Cases

When are maps useful, and what problems do they solve? Let’s dive right into the most common use cases for maps used in web design.

Navigation and Direction

Like Google Maps shows, navigation and direction are arguably the classic case study for interactive maps. You are in one place and need to get to another. You can enter your destination, your current location, and the map will present suggestions for getting there. You can select the method of travel and adjust desired departure or arrival times. But you need to understand first what functionality your users need. How these options are exposed to users is a critical piece of UX design.

Also, if users are searching for options such as somewhere to eat, it’s not so straightforward. Then, how your map handles panning in real-time as users swipe around a city is going to be a big issue.

Showing Relationships and Trends Geographically

This is something that you’ll see in every election in any western country. We’re all used to seeing maps that give us a state-of-play for which state or seat is held by which party. Then, we might see projections based on voter intentions and projected voting swings deriving from that. Then, exit poll data can be projected with the map updated on an ongoing basis until the final result is confirmed.

The capability to do this is essential because if a static map were used, it’d be out of date any time a new poll was released. Also, voting intentions can change over a campaign, so such maps need to be dynamic. Of course, such maps are only as accurate as the available data, as the US 2016 election map showed.

Show Points of Interest

As mentioned previously, there’s a lot of data that can be exposed to map users. However, that doesn’t automatically mean that it should be. Usability is key. For example, when you look at a map, you’ll typically first see key points of interest. Which points of interest are going to be presented to you can vary.

One variant is zoom level. If your map is currently showing an entire city, the level of detail the map presents is deliberately limited. You’ll see districts, large roads, or geographic features such as rivers. If more detailed information were presented, users on mobile devices, in particular, would be overwhelmed. Even at this level, you’ll notice typography differences. These can include the city name being in bold or the names of different areas in capital letters. So the level of detail is coupled with the scale of the map. Zooming in a few notches will expose significant points of interest, such as museums. Zooming in to specific districts will reveal restaurants, coffee shops, and universities. This visual hierarchy is a critical way of managing the exposed level of information.

But information is still being abstracted away. It’s not until you tap on the museum that you’ll see information on opening hours and busy times. This is also typically presented with user photos and reviews. Context is also taken into account, so you’ll start to see local hotels and restaurants. So it’s not just individual points of interest that are important, but the connections between them.

6 Tips For Improving Interactive Maps

What are the challenges of creating effective maps, and how do people address the data overload problem? We’ll answer this question and go over the must-know aspects of map creation.

1. Ensure Security and Brand Trust

GDPR or General Data Protection Regulation. This is a critically important European law that extends a wide range of legal protection to European citizens regarding personal data. It’s not possible here to cover the full extent of the law, but here are some quick key points:

  • Consent is required for the processing of personal data; it cannot be assumed
  • You need to have a retention policy for information that’s capable of identifying people

Be aware that the latter doesn’t just cover commercial purposes. Research students have to submit GDPR forms that address what kind of data they’re sourcing and how they’ll be retaining it.

But the most crucial context is commercial. If a business suffers a data breach, it can be fined up to 20 million euros or 4% of annual worldwide turnover in the preceding financial year, whichever is greater. Therefore, any business storing data that could identify their customers will need to assess risk and compliance. Remember: it’s 4% of worldwide turnover, not EU turnover.

Also, anything of your business that you expose to your customers or users is an extension of your brand. Therefore, you need to assess your maps for brand compliance too. If you have primary brand colors and your map doesn’t abide by them, that’s a very poor look. Source the color hex codes directly from your brand team and involve them in design.

2. Use the Appropriate Type of Map

It’s also important to consider what type of map is most appropriate for your use case. Think carefully about what your users need, what you’re trying to communicate, what information you need to present, and how best to present it.

For example, points of interest style maps in a tourist app will be way more helpful than heat maps: people want to know where something is, key data like opening hours, and how to get there. A heat map showing the number of visitors to each attraction or area of a city is unlikely to be useful to tourists. However, it could be useful to the attractions themselves to map their visitors by heat map over time. This could help larger museums chart which exhibits are most popular.

Transport for London is charting passenger movement on the London Underground by detecting when a device with Wi-Fi comes into range and then passes out of range. They’re using this to understand overall user journeys and movements within individual stations to better manage disruptions.

3. Avoid Pop-Ups

It should go without saying by now that auto pop-ups are despised. It doesn’t matter what they’re doing or what they’re offering; an unwanted pop-up can only get in the way. The level of impact is even greater on a phone where pop-ups take up even more screen space.

Given this, many users close them without even reading them. So if you’re using pop-ups, don’t kid yourself. You’re likely just irritating users and increasing the likelihood that they’ll ‘bounce off’ or uninstall.

4. Avoid Auto-Geolocation

Auto-geolocation sounds incredibly convenient but can result in some real problems. For example, if there are any bugs with auto-geolocation, you could get false results. If someone connects through public building Wi-Fi, you could get false results. If they’re connecting through a VPN then, unless you get the user’s IP address and check if it’s the exit portal of a VPN, you could get false results.

The problem is most significant with mobile maps. If a map user is looking at a points of interest map, they likely have a specific and immediate use. This means it’s in their best to get the most accurate results possible. So why not just ask them?

Precision and Accuracy

These terms have specific meanings in geolocation. ‘Precision’ is the exactness of the data. ‘Accuracy’ is how closely the information on a map matches the real world. So you want precision and accuracy to be spot on, or data risks losing value. This applies not just to the gathering of data but to the representation of it. For example, if you have street-level data but your maps don’t present individual streets, then any representation of data on that map is likely to have poor accuracy. That map might succeed in abstracting irrelevant information but presenting an imprecise and inaccurate view.

5. Avoid Map Legends as Much as Possible

In many cases, primarily points-of-interest maps, they’re just not needed anymore. An essential part of user experience design isn’t just visual hierarchy but information hierarchy. You can mouse over on a desktop or laptop to get the essentials of a location, e.g., the museum’s name and its opening hours. On a mobile device, you can tap on that location to get the essentials, and you can tap on another location to move on; you don’t even have to press back. Given that, a legend would get in the way. So this simple piece of information design solves information overload issues.

As with all rules, there are exceptions. A good one is a heat map where a density of what’s being measured needs to be communicated. It doesn’t matter what the data is; it just needs to be something where mapping provides greater insight, especially if it informs decision-making. Sales is an excellent example for a national or multinational company. Of course, weather forecasting can make use of literal heat maps.

6. Accessibility Compliance

Not everyone has perfect eyesight. Even if someone has excellent vision, they could still be colorblind (8% of men and 0.5% of women are). Given that, take the W3C’s accessibility standards into account and treat them as a baseline or minimum barrier to entry for compliance. You shouldn’t feel good about the possibility of excluding 8% of your potential audience or customers. Ensure you keep your UX designers involved and don’t shy away from creating senior-friendly web designs.

Put simply: imagine if you could appeal to a new demographic that’s not catered to. If your competitors ignore them, you could give them a real reason to choose you instead by taking some straightforward steps. If your competitors are catering to them, you also need to. If you don’t, you’re just giving potential customers a big reason to ignore you.

Conclusions

The key takeaway is that there’s far more to creating good maps than just good cartography. That can be critical, too, though this may vary depending on the use case.

This will be a team effort because your map will involve data sets, design decisions, and, yes, cartography. You’re going to need to involve brand and IT too. So think about design principles and development methodologies.

First and foremost, what are your users’ needs? If you haven’t done any user research or taken the time to understand the customer journey, are you adding anything or getting in the way? It’s easy to see the department that requested the map as stakeholders, but you should probably view your users as stakeholders too.

This sounds complex, but as you hopefully now appreciate, a map is probably more complicated than you thought.


Featured image via Pexels.

Source

The post The UX of Maps in Web Design first appeared on Webdesigner Depot.

Source de l’article sur Webdesignerdepot

Every day design fans submit incredible industry stories to our sister-site, Webdesigner News. Our colleagues sift through it, selecting the very best stories from the design, UX, tech, and development worlds and posting them live on the site.

The best way to keep up with the most important stories for web professionals is to subscribe to Webdesigner News or check out the site regularly. However, in case you missed a day this week, here’s a handy compilation of the top curated stories from the last seven days. Enjoy!

Logo Design Trends 2022: The Future of Logos

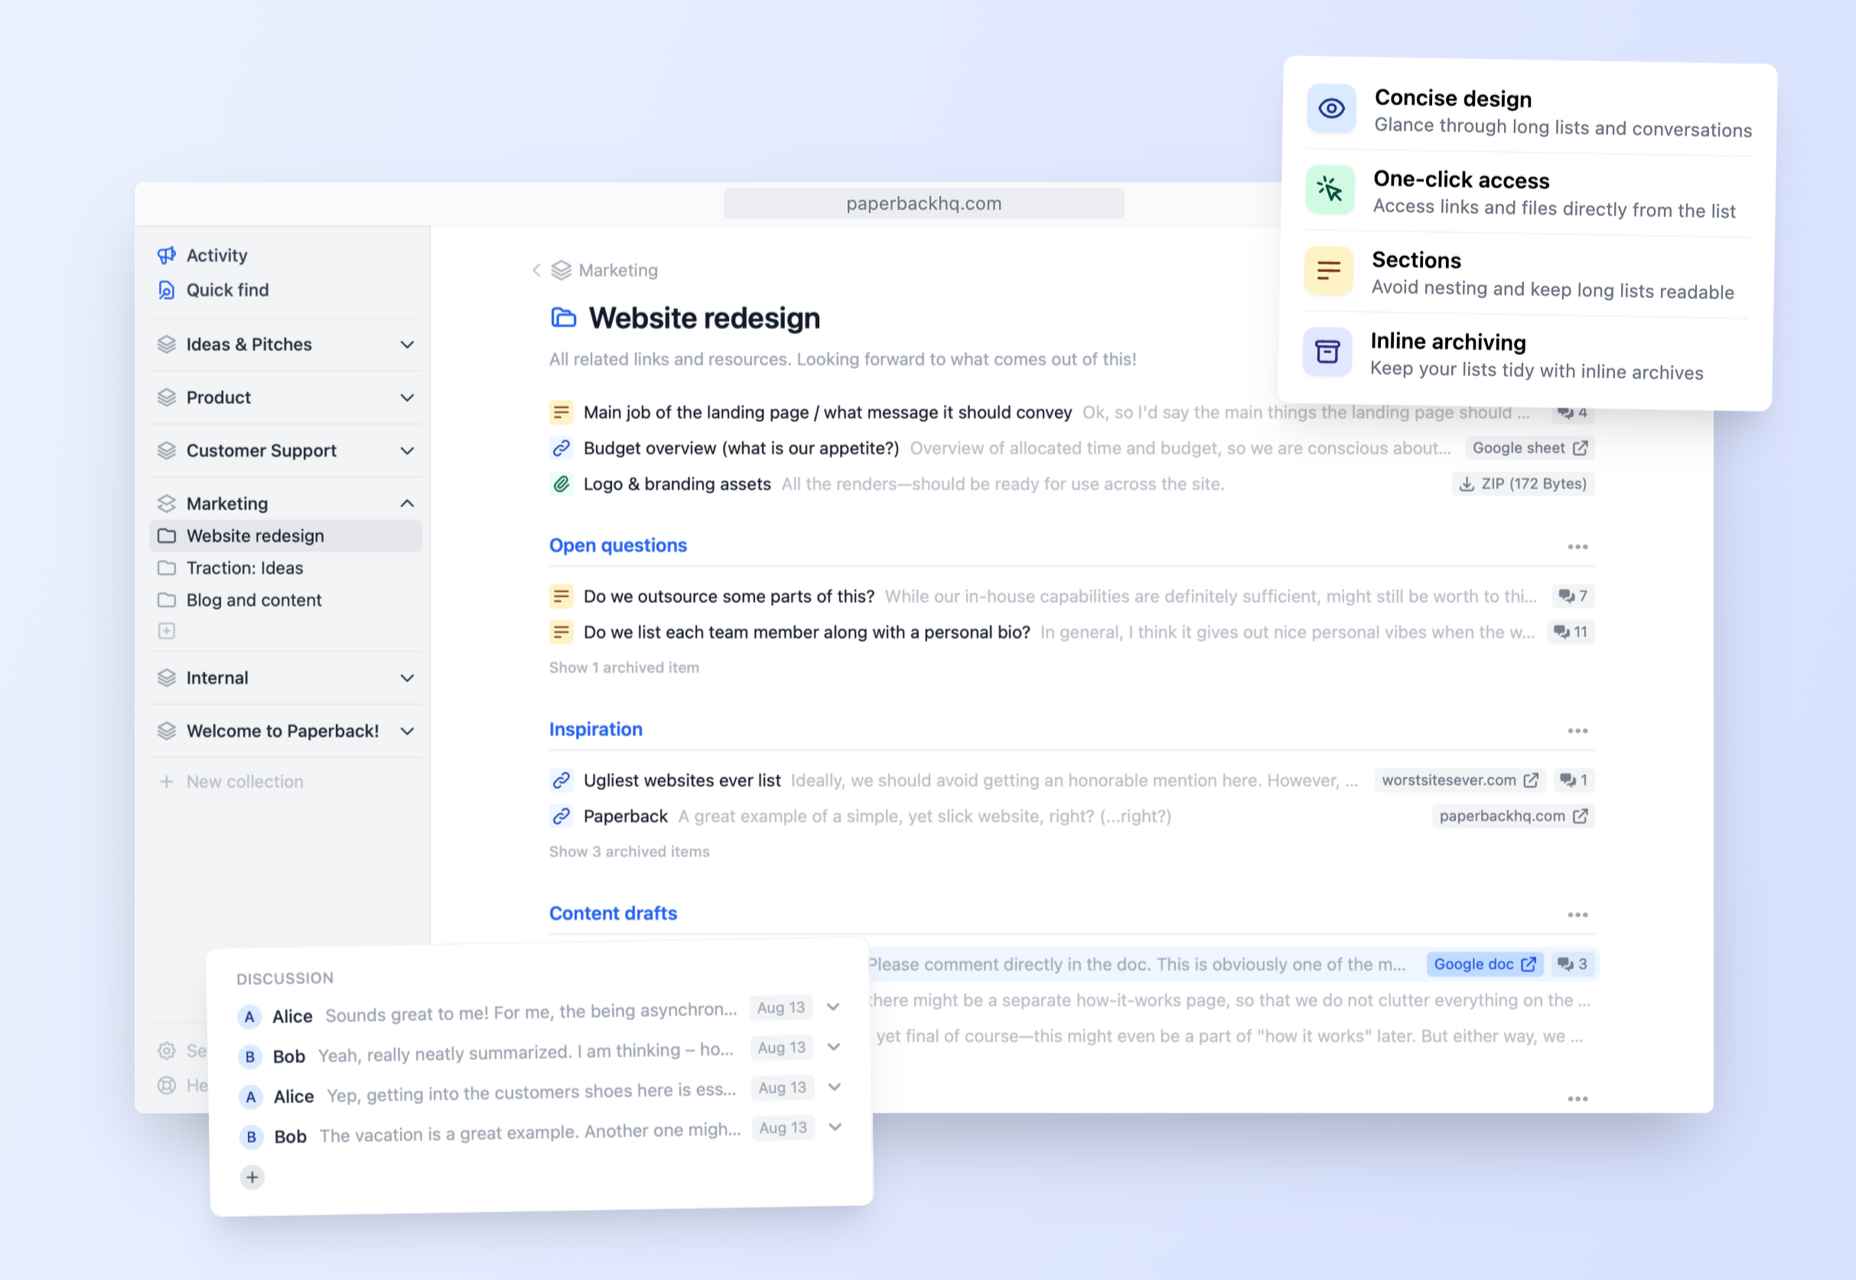
Paperback – Simpler and Tidier Alternative to Wiki Pages

10 Captivating Examples of the Liquid Metal Effect in Web Design

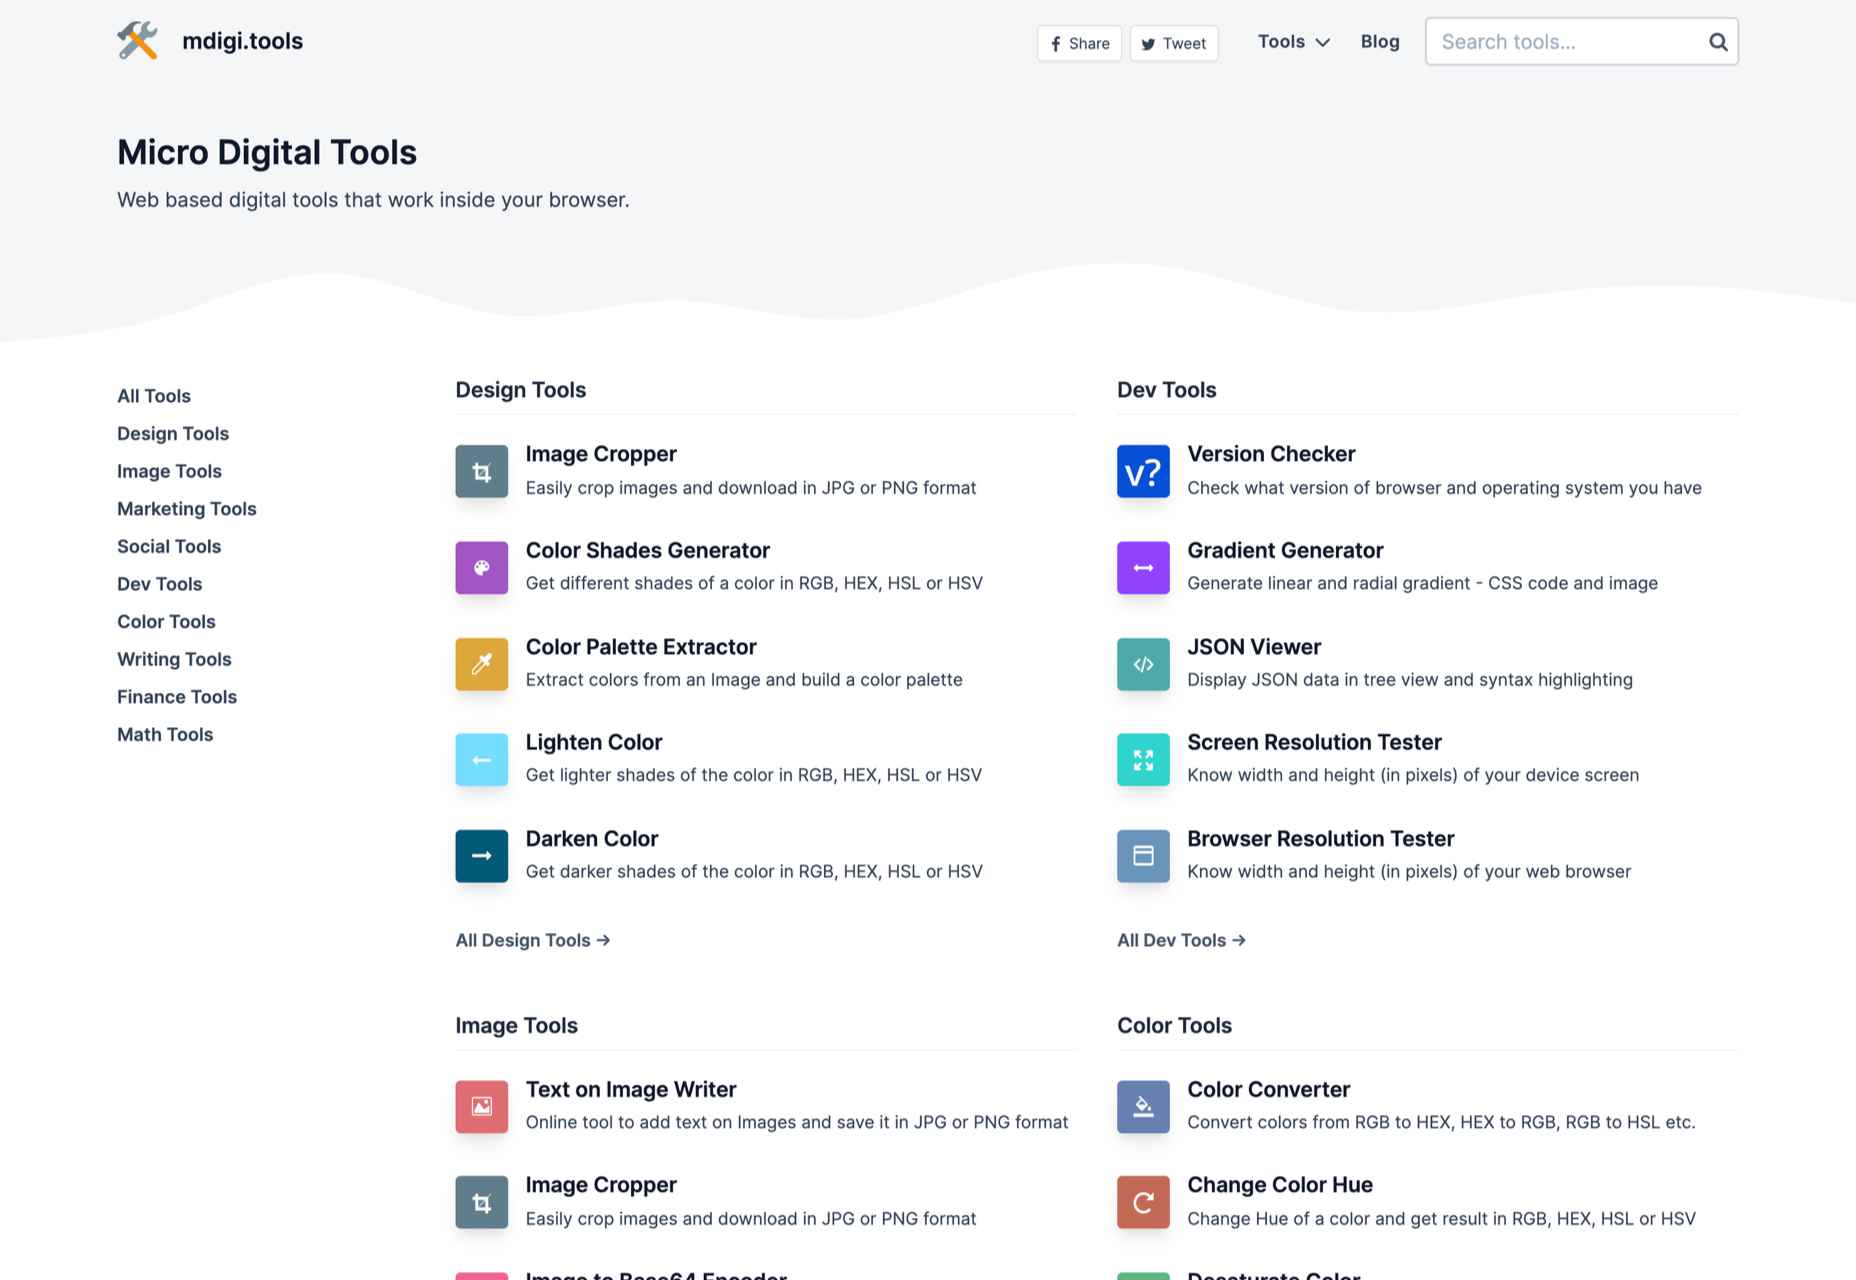
Micro Digital Tools

Master Typography for Free with Google Fonts Knowledge

Windows 11 Officially Shuts Down Firefox’s Default Browser Workaround

40+ Most Notable Big Name Brands That are Using WordPress

Pixel Patterns

Top Web Design and UI Trends for 2022

WordPress 5.9 Delayed Until January 2022

Source

The post Popular Design News of the Week: December 20, 2021 – December 26, 2021 first appeared on Webdesigner Depot.

Source de l’article sur Webdesignerdepot