 Maps are a fascinating method for delivering content. At their best, they can create an intuitive way of presenting information and interacting with it. This is the advantage that digital maps, through mobile apps and websites, have over print maps and images where no interactivity is possible.
But it’s important to understand that more data ≠ better experiences. We all now have so much data available to us through multiple services that, arguably, the greatest challenge isn’t sourcing information but filtering it out. We can only handle so much information input before we become overloaded. This issue risks being omnipresent with maps. There are so many potential points of interest on a map that it’s essential to be clear about what needs to be exposed to users.
Also, UX design, map design, and user interface are all critical. While maps can be a powerful way of drawing people in, if end-users feel that you didn’t even consider the visual design, they’ll ‘bounce off’ your site or app in moments.
Common Use Cases
When are maps useful, and what problems do they solve? Let’s dive right into the most common use cases for maps used in web design.
Navigation and Direction
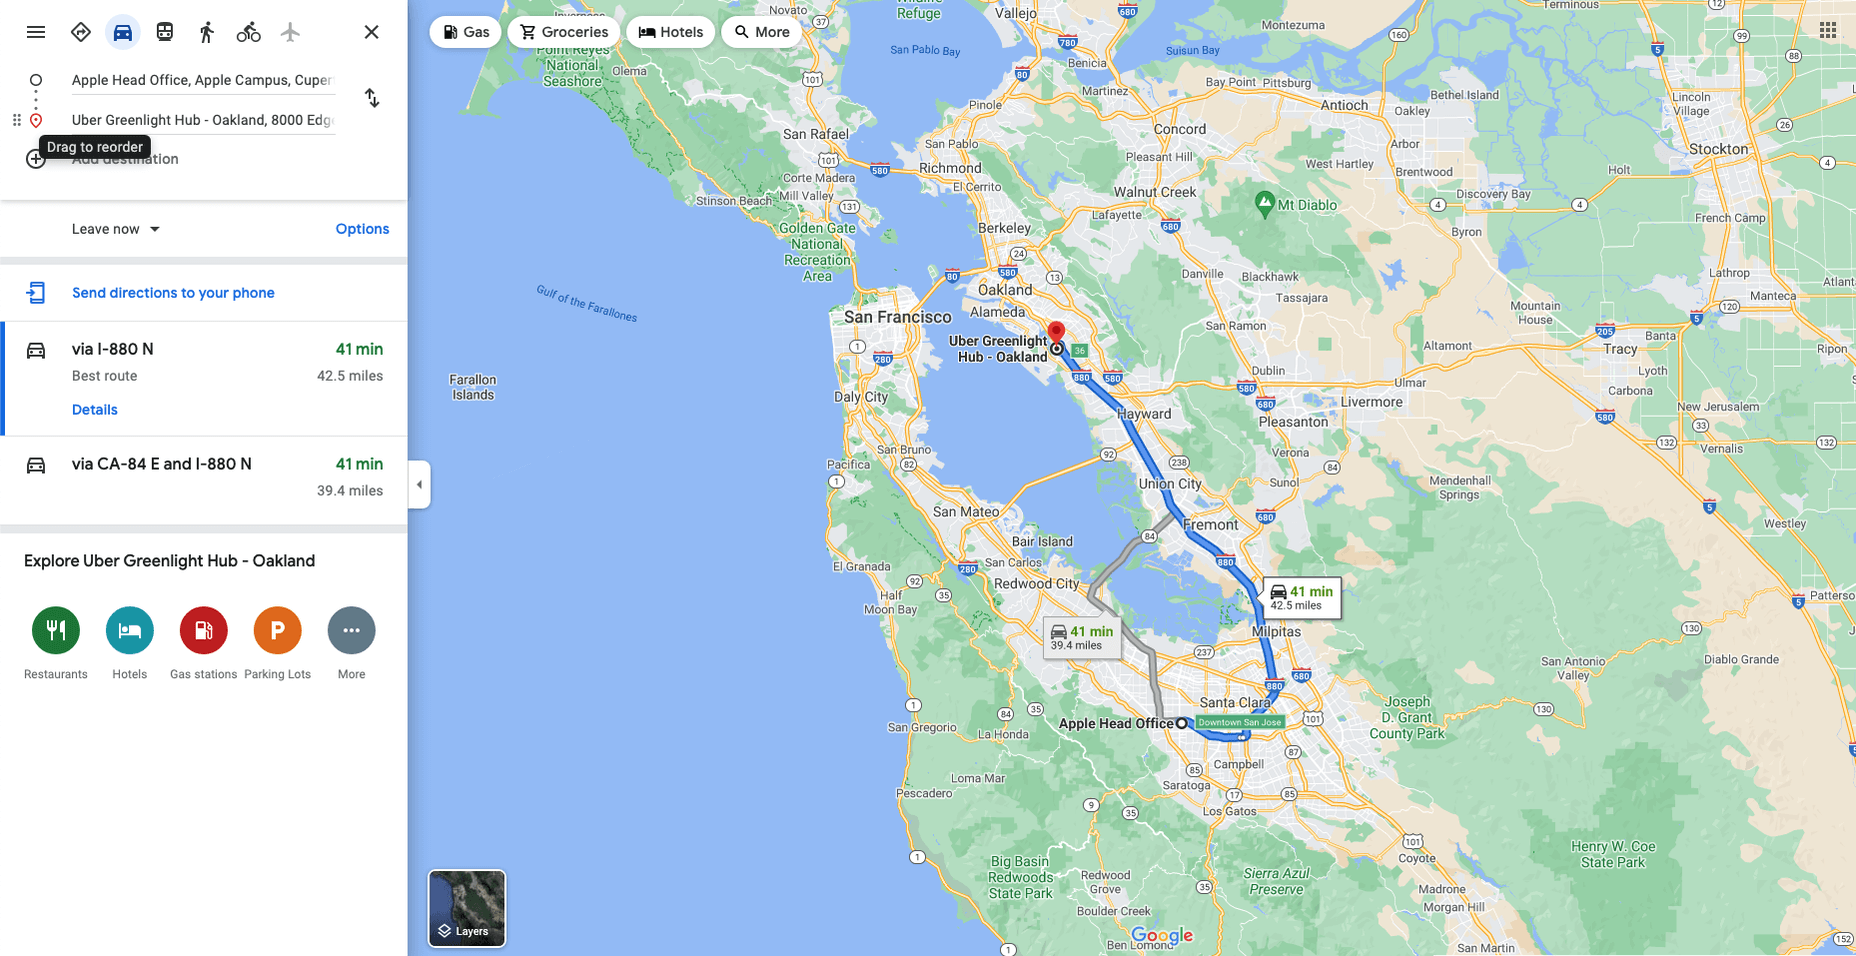
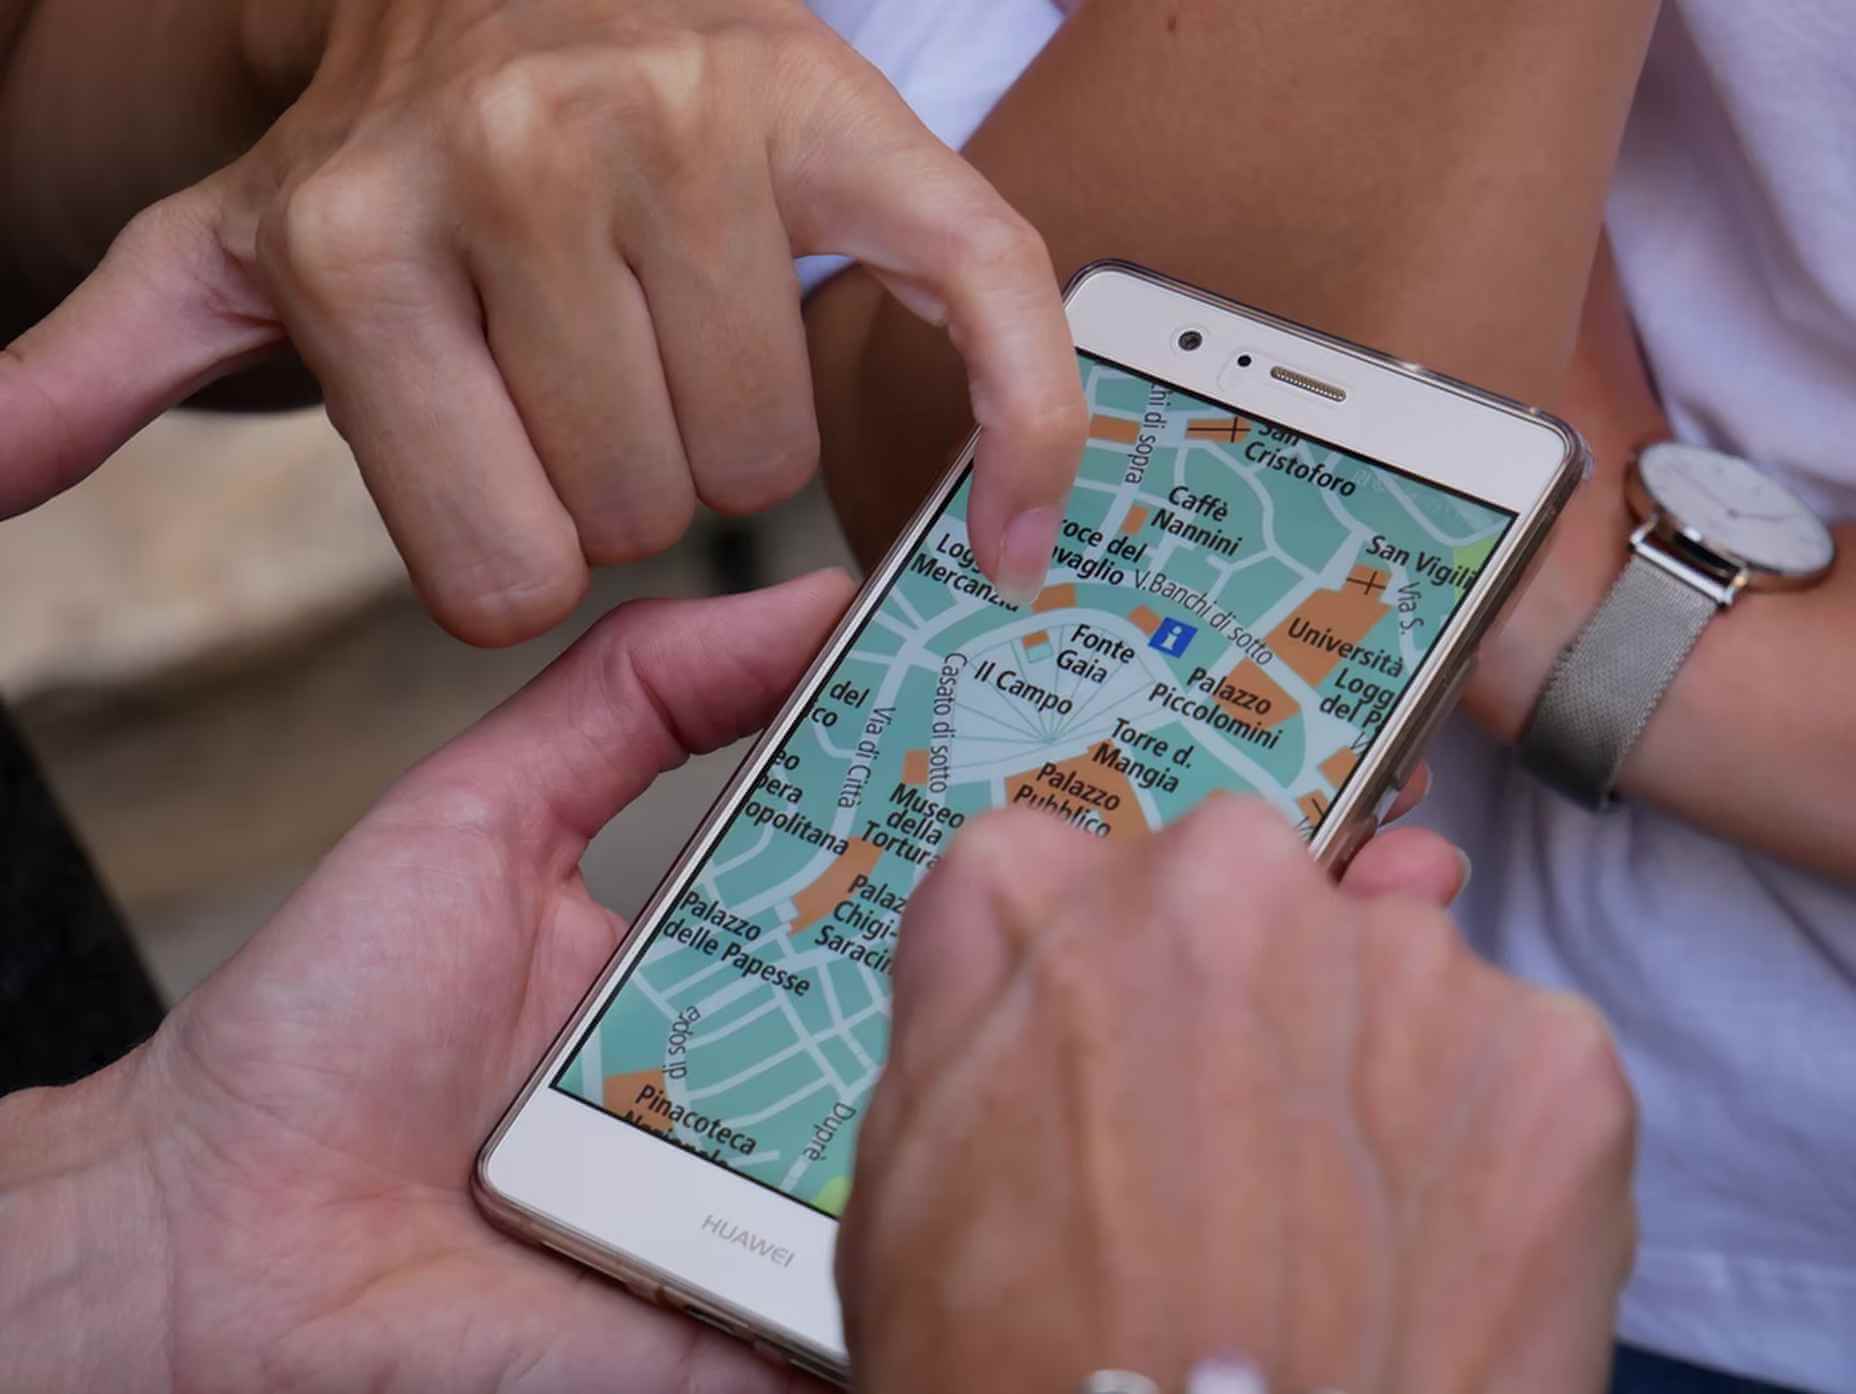
Like Google Maps shows, navigation and direction are arguably the classic case study for interactive maps. You are in one place and need to get to another. You can enter your destination, your current location, and the map will present suggestions for getting there. You can select the method of travel and adjust desired departure or arrival times. But you need to understand first what functionality your users need. How these options are exposed to users is a critical piece of UX design.
Also, if users are searching for options such as somewhere to eat, it’s not so straightforward. Then, how your map handles panning in real-time as users swipe around a city is going to be a big issue.
Showing Relationships and Trends Geographically
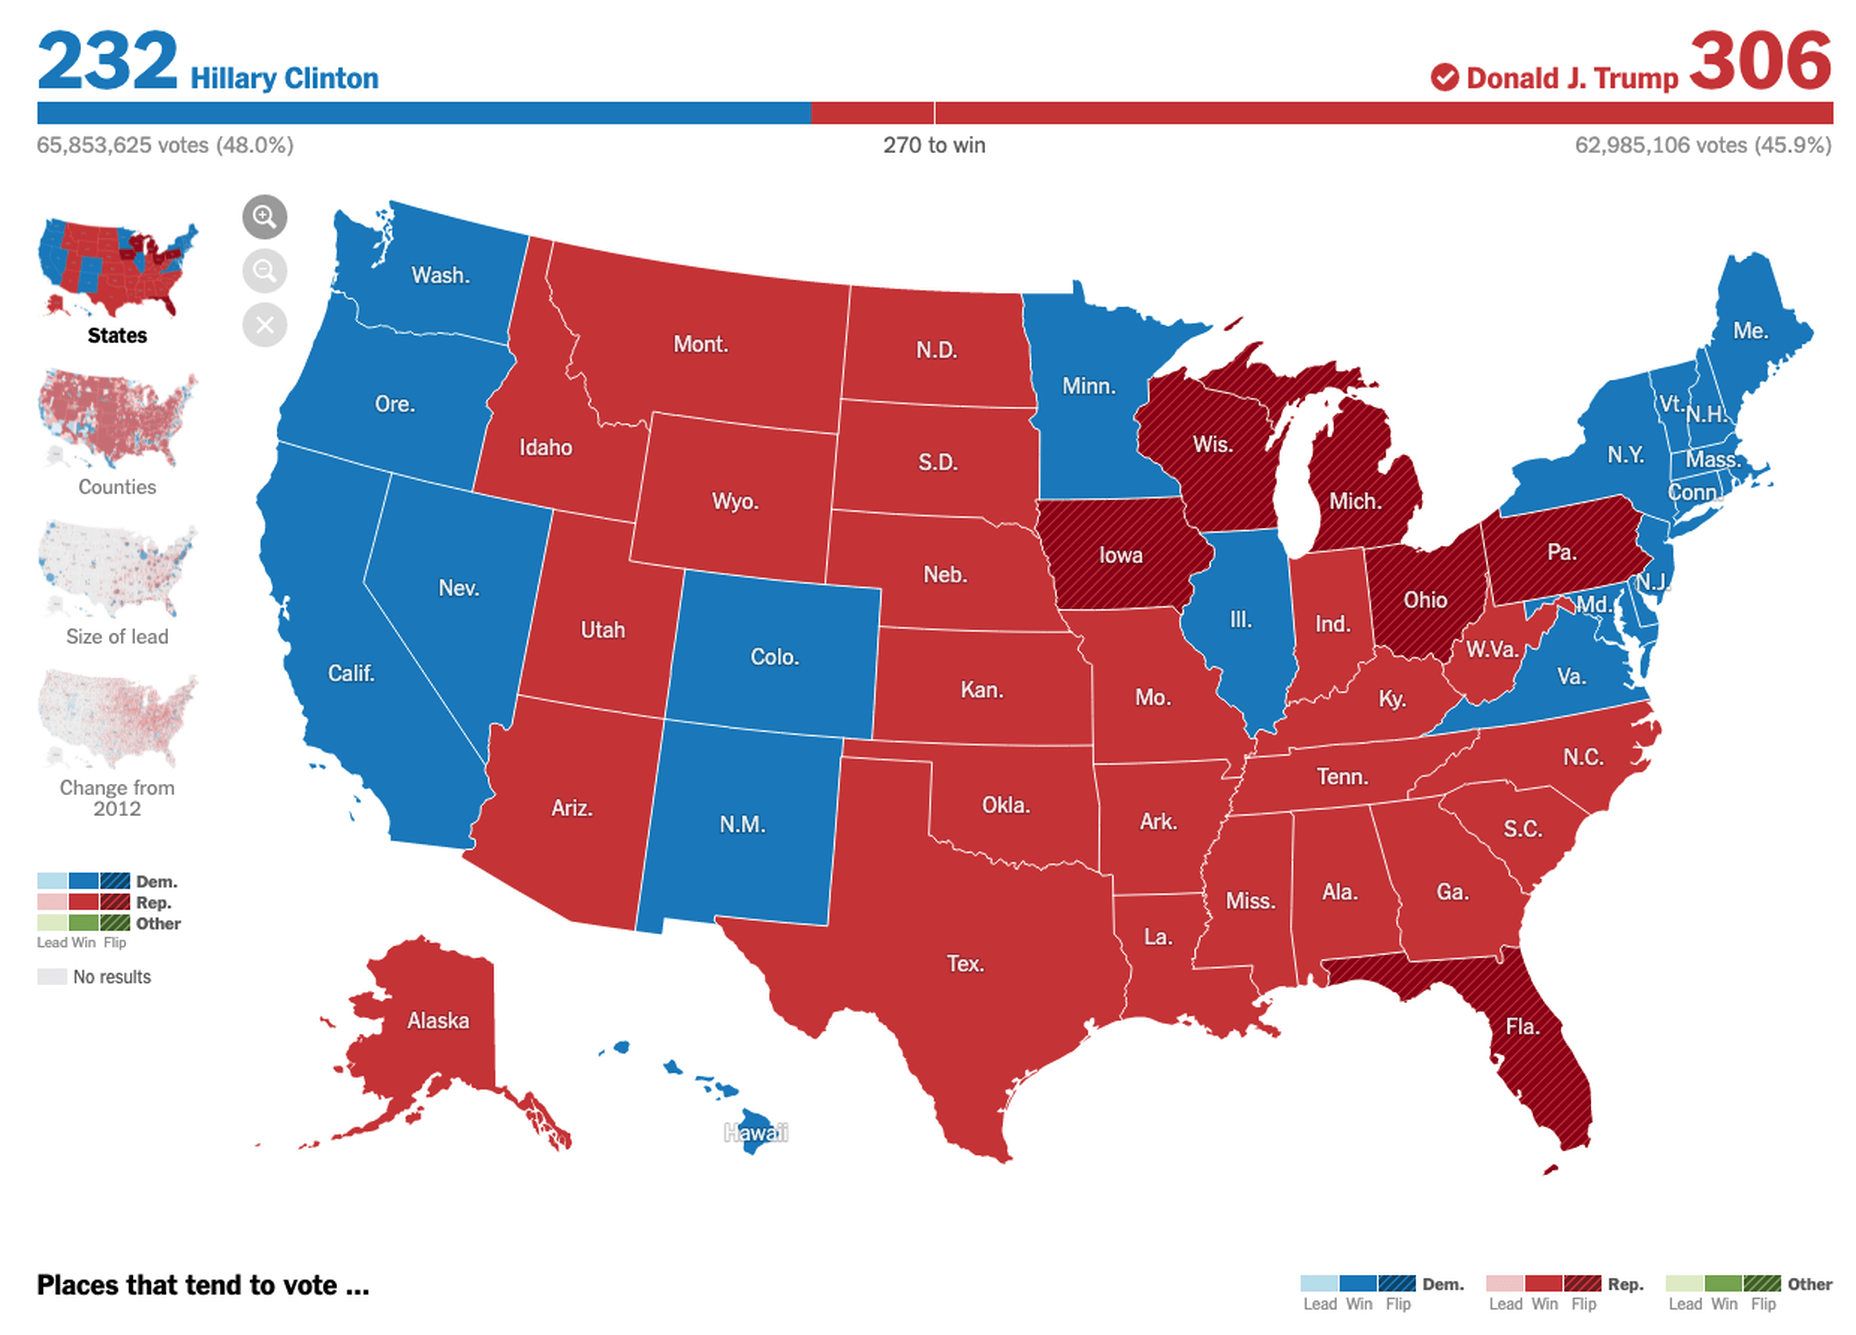
This is something that you’ll see in every election in any western country. We’re all used to seeing maps that give us a state-of-play for which state or seat is held by which party. Then, we might see projections based on voter intentions and projected voting swings deriving from that. Then, exit poll data can be projected with the map updated on an ongoing basis until the final result is confirmed.
The capability to do this is essential because if a static map were used, it’d be out of date any time a new poll was released. Also, voting intentions can change over a campaign, so such maps need to be dynamic. Of course, such maps are only as accurate as the available data, as the US 2016 election map showed.
Show Points of Interest
As mentioned previously, there’s a lot of data that can be exposed to map users. However, that doesn’t automatically mean that it should be. Usability is key. For example, when you look at a map, you’ll typically first see key points of interest. Which points of interest are going to be presented to you can vary.
One variant is zoom level. If your map is currently showing an entire city, the level of detail the map presents is deliberately limited. You’ll see districts, large roads, or geographic features such as rivers. If more detailed information were presented, users on mobile devices, in particular, would be overwhelmed. Even at this level, you’ll notice typography differences. These can include the city name being in bold or the names of different areas in capital letters. So the level of detail is coupled with the scale of the map. Zooming in a few notches will expose significant points of interest, such as museums. Zooming in to specific districts will reveal restaurants, coffee shops, and universities. This visual hierarchy is a critical way of managing the exposed level of information.
But information is still being abstracted away. It’s not until you tap on the museum that you’ll see information on opening hours and busy times. This is also typically presented with user photos and reviews. Context is also taken into account, so you’ll start to see local hotels and restaurants. So it’s not just individual points of interest that are important, but the connections between them.
6 Tips For Improving Interactive Maps
What are the challenges of creating effective maps, and how do people address the data overload problem? We’ll answer this question and go over the must-know aspects of map creation.
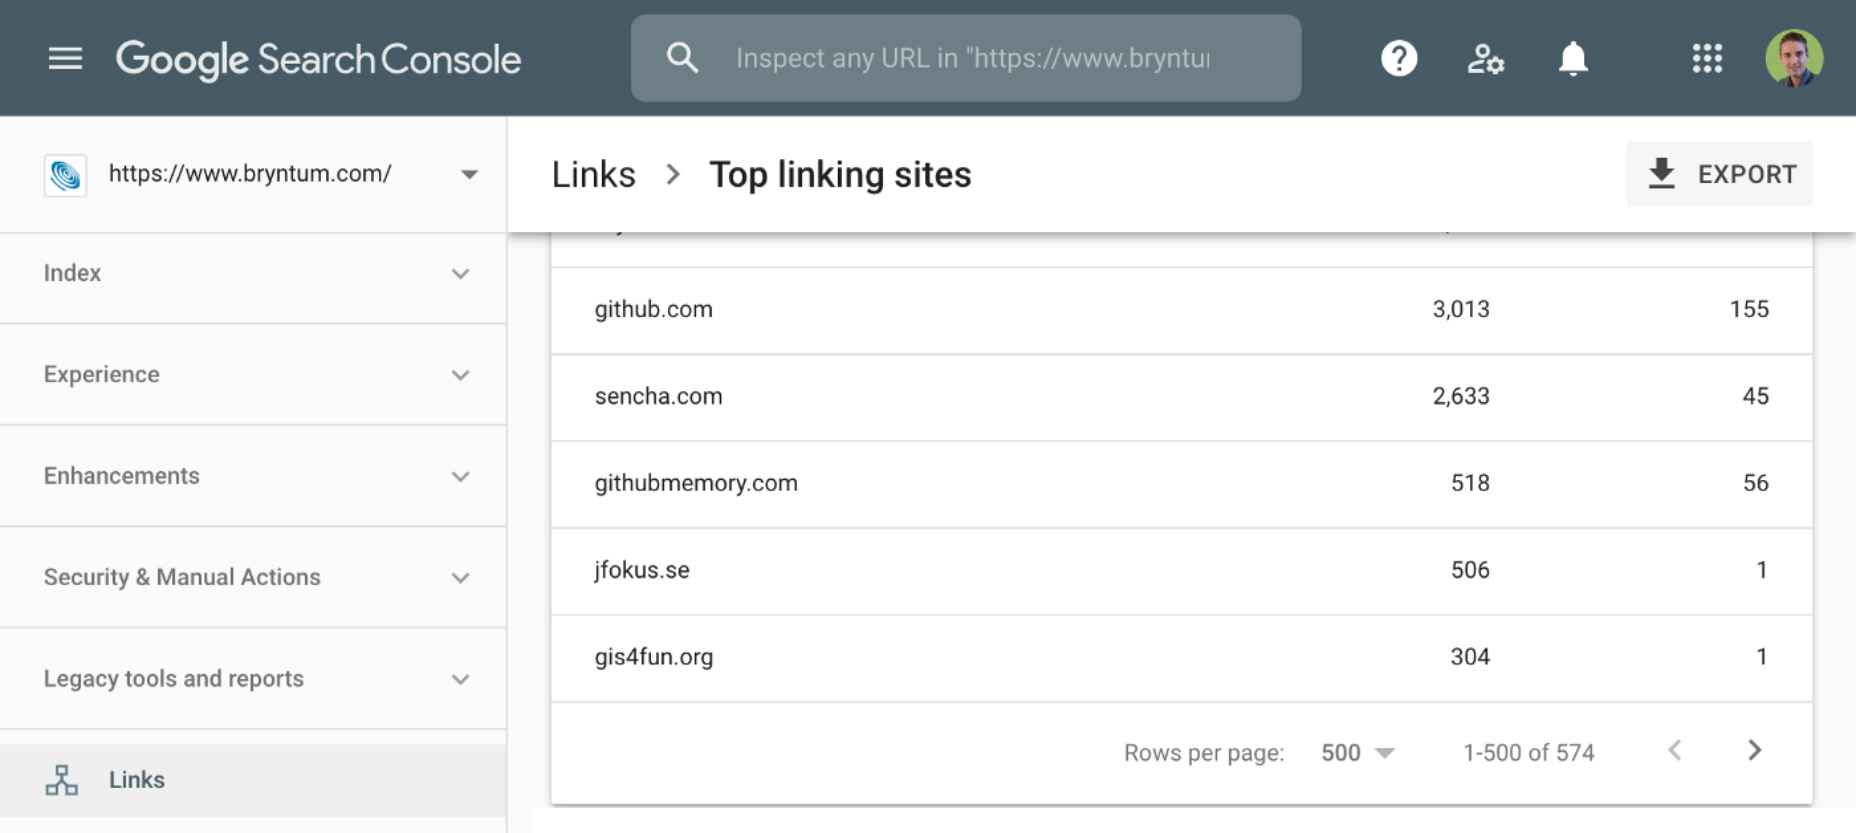
1. Ensure Security and Brand Trust
GDPR or General Data Protection Regulation. This is a critically important European law that extends a wide range of legal protection to European citizens regarding personal data. It’s not possible here to cover the full extent of the law, but here are some quick key points:
- Consent is required for the processing of personal data; it cannot be assumed
- You need to have a retention policy for information that’s capable of identifying people
Be aware that the latter doesn’t just cover commercial purposes. Research students have to submit GDPR forms that address what kind of data they’re sourcing and how they’ll be retaining it.
But the most crucial context is commercial. If a business suffers a data breach, it can be fined up to 20 million euros or 4% of annual worldwide turnover in the preceding financial year, whichever is greater. Therefore, any business storing data that could identify their customers will need to assess risk and compliance. Remember: it’s 4% of worldwide turnover, not EU turnover.
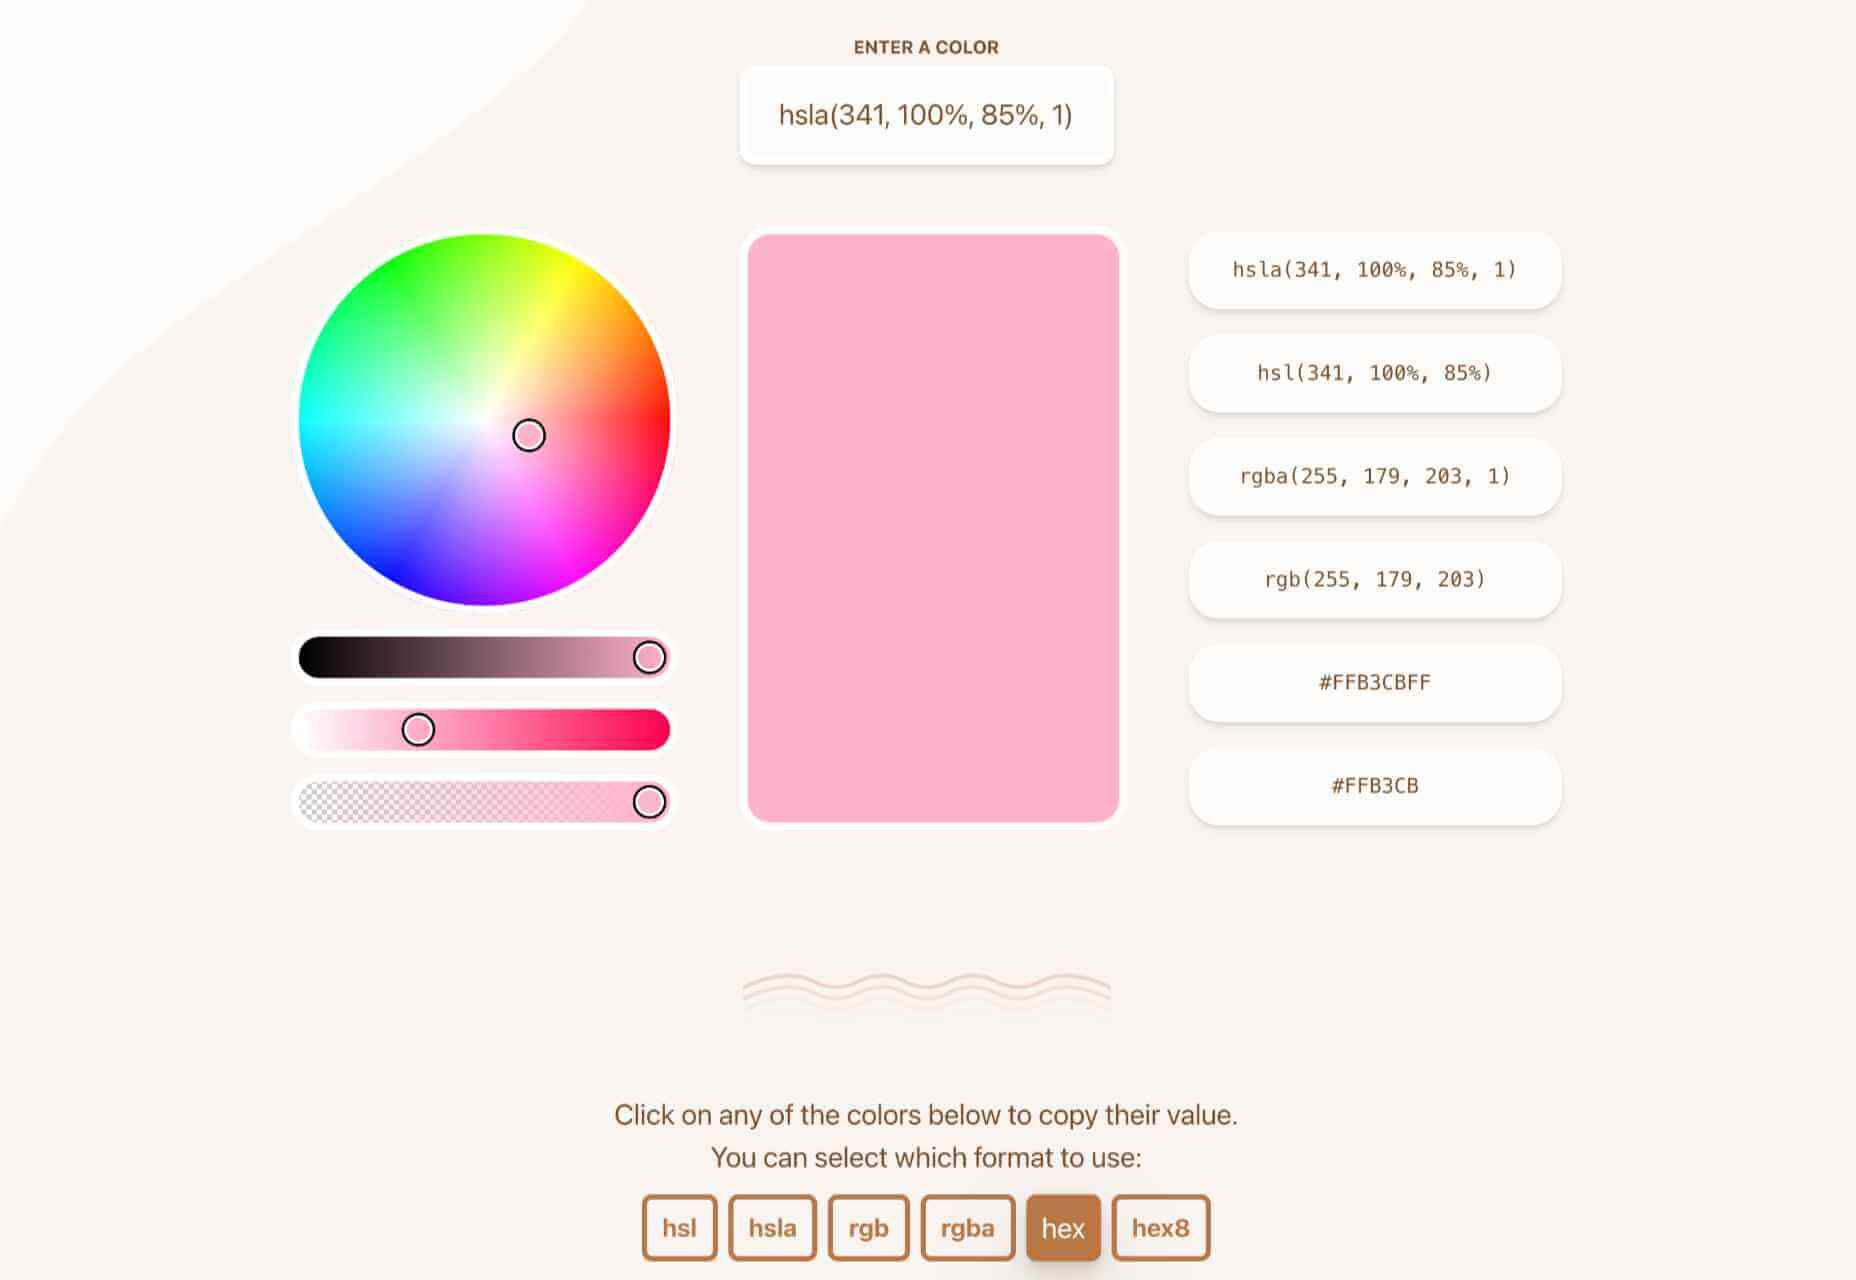
Also, anything of your business that you expose to your customers or users is an extension of your brand. Therefore, you need to assess your maps for brand compliance too. If you have primary brand colors and your map doesn’t abide by them, that’s a very poor look. Source the color hex codes directly from your brand team and involve them in design.
2. Use the Appropriate Type of Map
It’s also important to consider what type of map is most appropriate for your use case. Think carefully about what your users need, what you’re trying to communicate, what information you need to present, and how best to present it.
For example, points of interest style maps in a tourist app will be way more helpful than heat maps: people want to know where something is, key data like opening hours, and how to get there. A heat map showing the number of visitors to each attraction or area of a city is unlikely to be useful to tourists. However, it could be useful to the attractions themselves to map their visitors by heat map over time. This could help larger museums chart which exhibits are most popular.
Transport for London is charting passenger movement on the London Underground by detecting when a device with Wi-Fi comes into range and then passes out of range. They’re using this to understand overall user journeys and movements within individual stations to better manage disruptions.
3. Avoid Pop-Ups
It should go without saying by now that auto pop-ups are despised. It doesn’t matter what they’re doing or what they’re offering; an unwanted pop-up can only get in the way. The level of impact is even greater on a phone where pop-ups take up even more screen space.
Given this, many users close them without even reading them. So if you’re using pop-ups, don’t kid yourself. You’re likely just irritating users and increasing the likelihood that they’ll ‘bounce off’ or uninstall.
4. Avoid Auto-Geolocation
Auto-geolocation sounds incredibly convenient but can result in some real problems. For example, if there are any bugs with auto-geolocation, you could get false results. If someone connects through public building Wi-Fi, you could get false results. If they’re connecting through a VPN then, unless you get the user’s IP address and check if it’s the exit portal of a VPN, you could get false results.
The problem is most significant with mobile maps. If a map user is looking at a points of interest map, they likely have a specific and immediate use. This means it’s in their best to get the most accurate results possible. So why not just ask them?
Precision and Accuracy
These terms have specific meanings in geolocation. ‘Precision’ is the exactness of the data. ‘Accuracy’ is how closely the information on a map matches the real world. So you want precision and accuracy to be spot on, or data risks losing value. This applies not just to the gathering of data but to the representation of it. For example, if you have street-level data but your maps don’t present individual streets, then any representation of data on that map is likely to have poor accuracy. That map might succeed in abstracting irrelevant information but presenting an imprecise and inaccurate view.
5. Avoid Map Legends as Much as Possible
In many cases, primarily points-of-interest maps, they’re just not needed anymore. An essential part of user experience design isn’t just visual hierarchy but information hierarchy. You can mouse over on a desktop or laptop to get the essentials of a location, e.g., the museum’s name and its opening hours. On a mobile device, you can tap on that location to get the essentials, and you can tap on another location to move on; you don’t even have to press back. Given that, a legend would get in the way. So this simple piece of information design solves information overload issues.
As with all rules, there are exceptions. A good one is a heat map where a density of what’s being measured needs to be communicated. It doesn’t matter what the data is; it just needs to be something where mapping provides greater insight, especially if it informs decision-making. Sales is an excellent example for a national or multinational company. Of course, weather forecasting can make use of literal heat maps.
6. Accessibility Compliance
Not everyone has perfect eyesight. Even if someone has excellent vision, they could still be colorblind (8% of men and 0.5% of women are). Given that, take the W3C’s accessibility standards into account and treat them as a baseline or minimum barrier to entry for compliance. You shouldn’t feel good about the possibility of excluding 8% of your potential audience or customers. Ensure you keep your UX designers involved and don’t shy away from creating senior-friendly web designs.
Put simply: imagine if you could appeal to a new demographic that’s not catered to. If your competitors ignore them, you could give them a real reason to choose you instead by taking some straightforward steps. If your competitors are catering to them, you also need to. If you don’t, you’re just giving potential customers a big reason to ignore you.
Conclusions
The key takeaway is that there’s far more to creating good maps than just good cartography. That can be critical, too, though this may vary depending on the use case.
This will be a team effort because your map will involve data sets, design decisions, and, yes, cartography. You’re going to need to involve brand and IT too. So think about design principles and development methodologies.
First and foremost, what are your users’ needs? If you haven’t done any user research or taken the time to understand the customer journey, are you adding anything or getting in the way? It’s easy to see the department that requested the map as stakeholders, but you should probably view your users as stakeholders too.
This sounds complex, but as you hopefully now appreciate, a map is probably more complicated than you thought.
Featured image via Pexels.
Source
The post The UX of Maps in Web Design first appeared on Webdesigner Depot.
Source de l’article sur Webdesignerdepot

 Every day design fans submit incredible industry stories to our sister-site, Webdesigner News. Our colleagues sift through it, selecting the very best stories from the design, UX, tech, and development worlds and posting them live on the site.
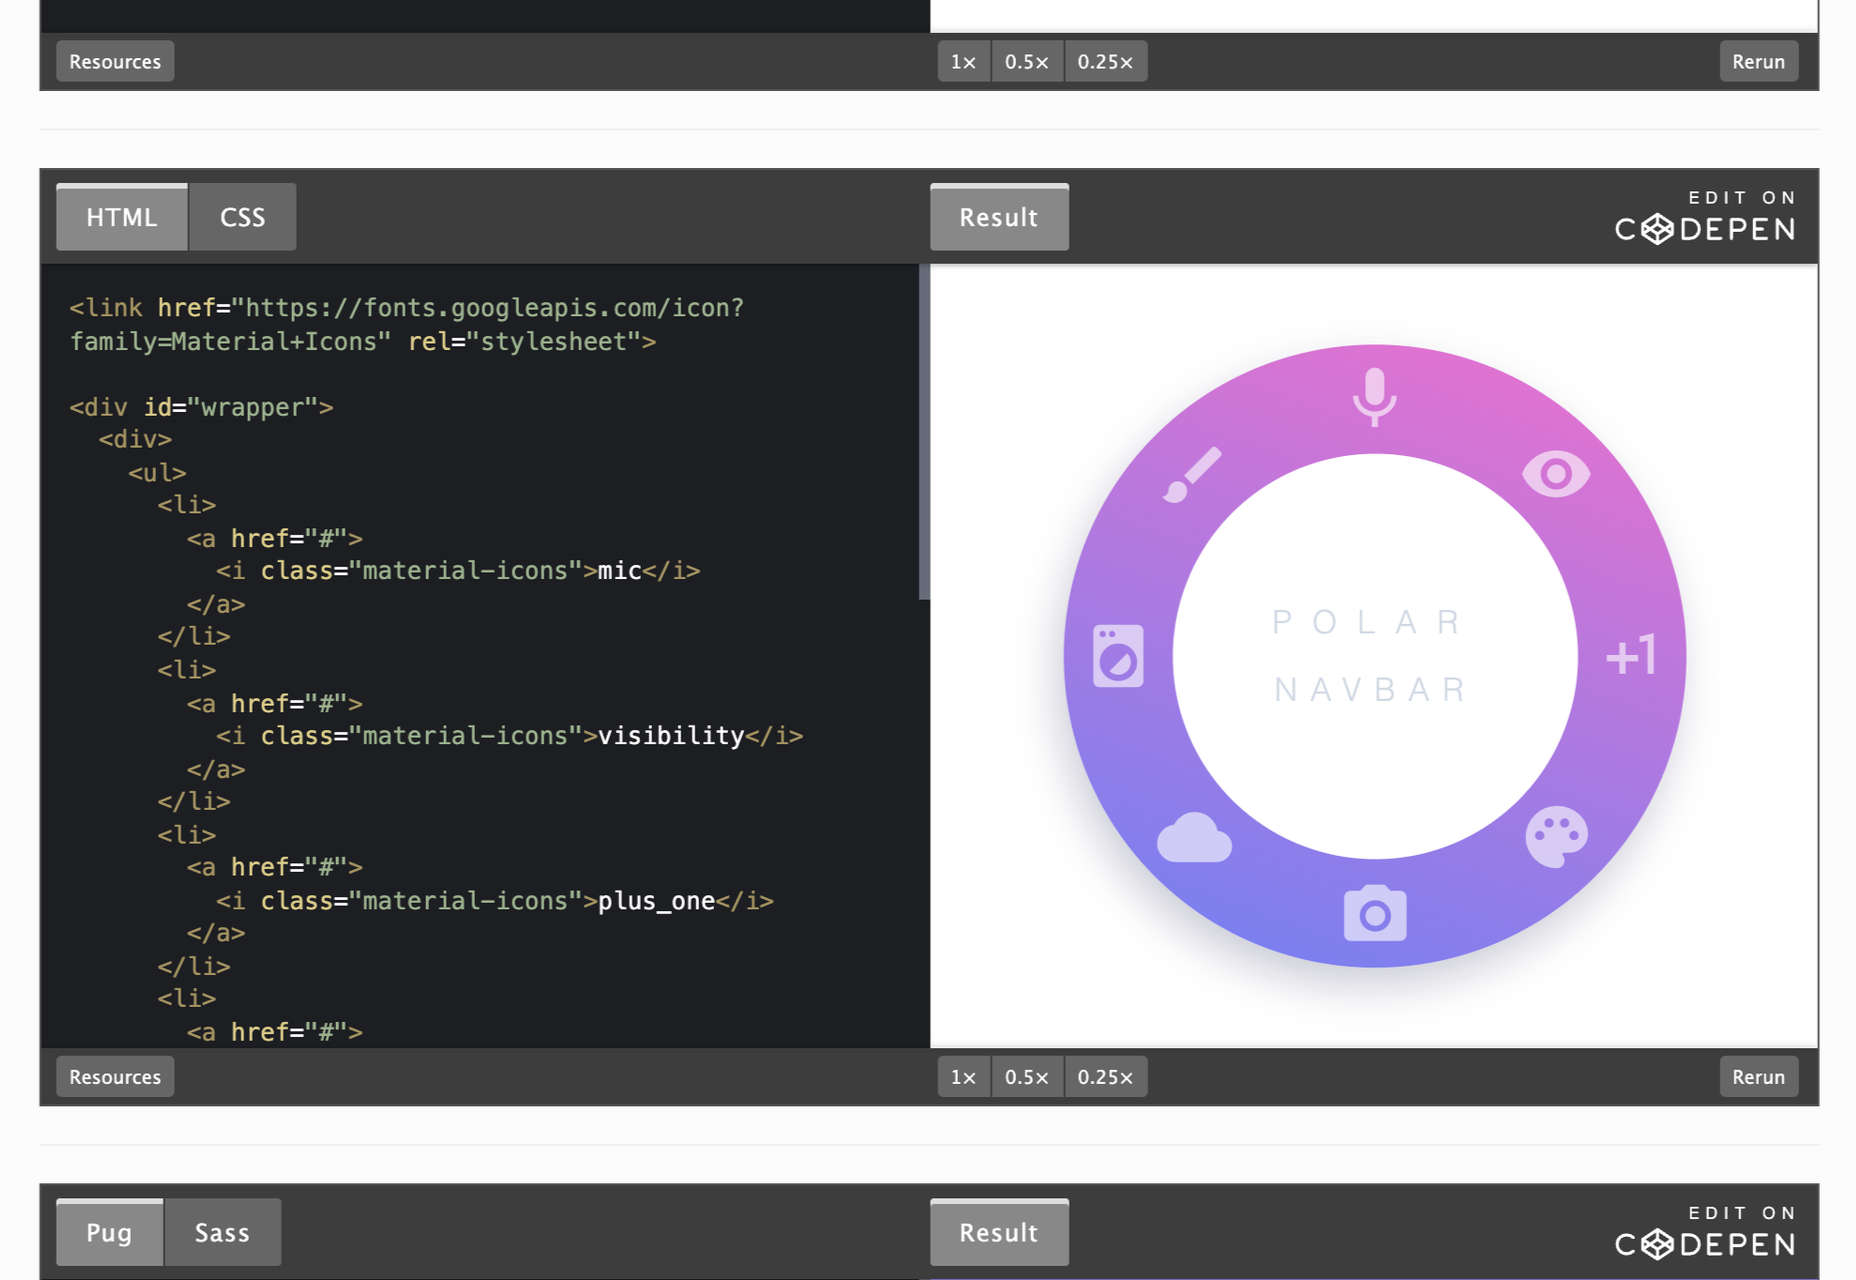


 Every day design fans submit incredible industry stories to our sister-site,


 Every day design fans submit incredible industry stories to our sister-site,


 Every day design fans submit incredible industry stories to our sister-site,


 Every day design fans submit incredible industry stories to our sister-site,


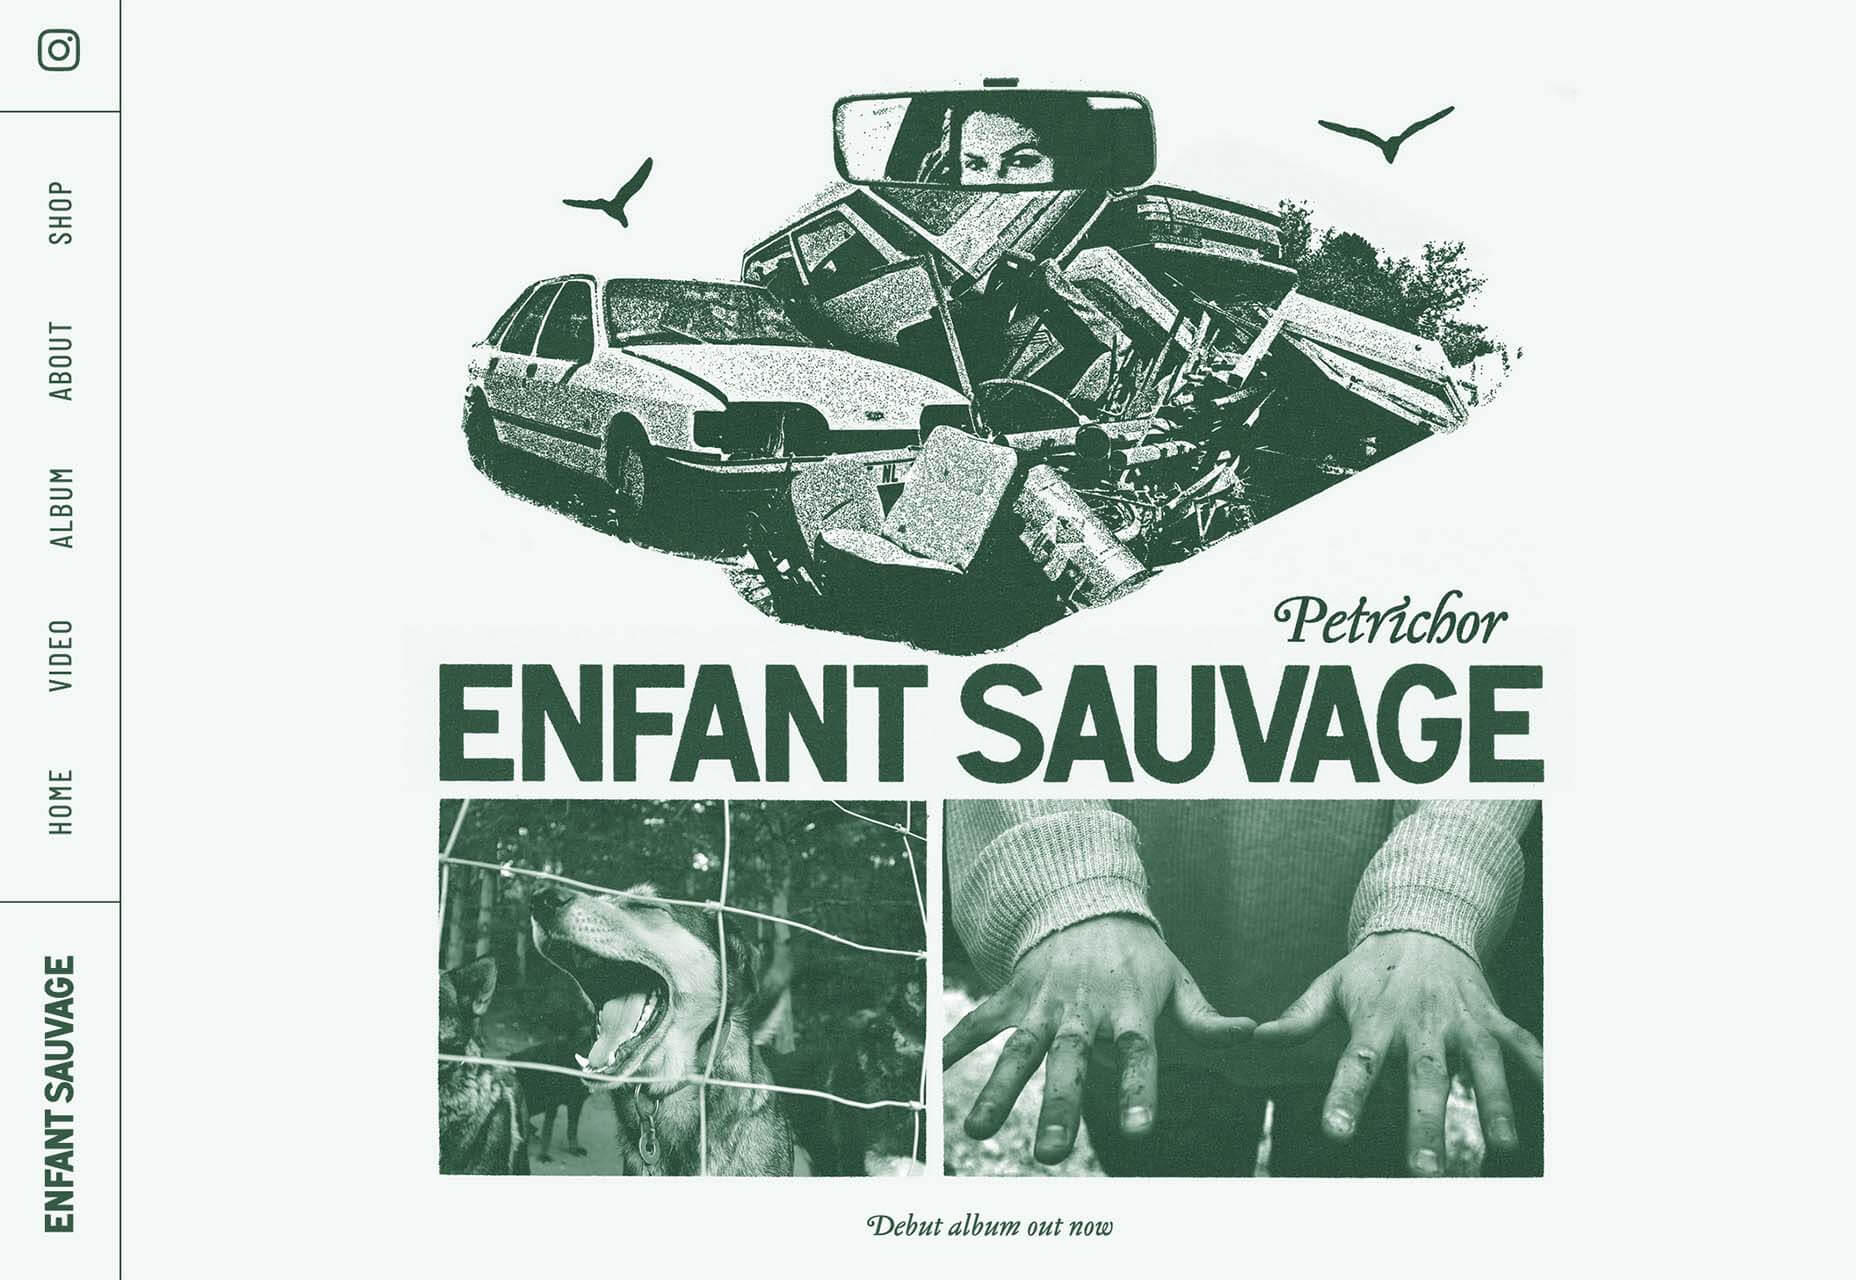
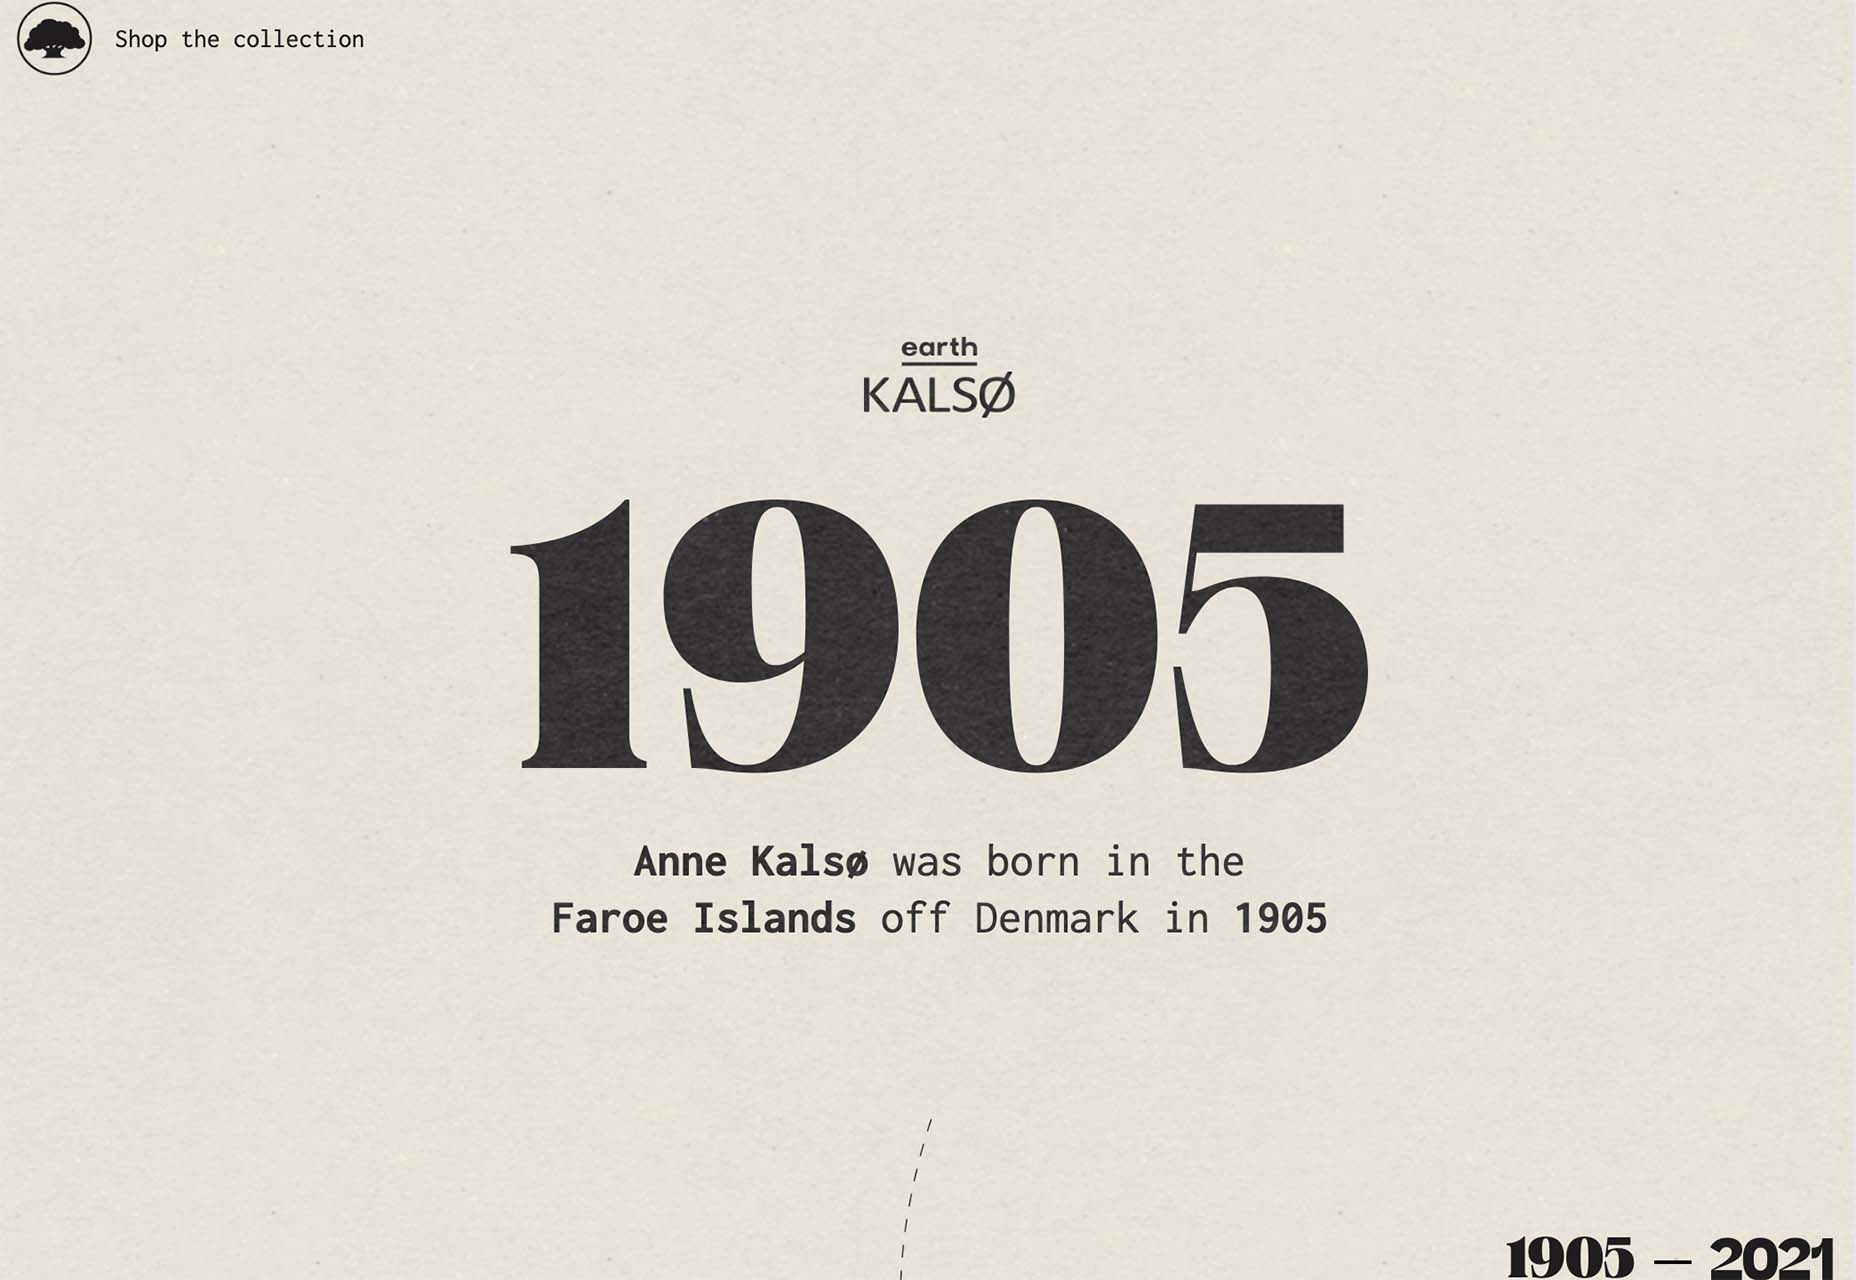
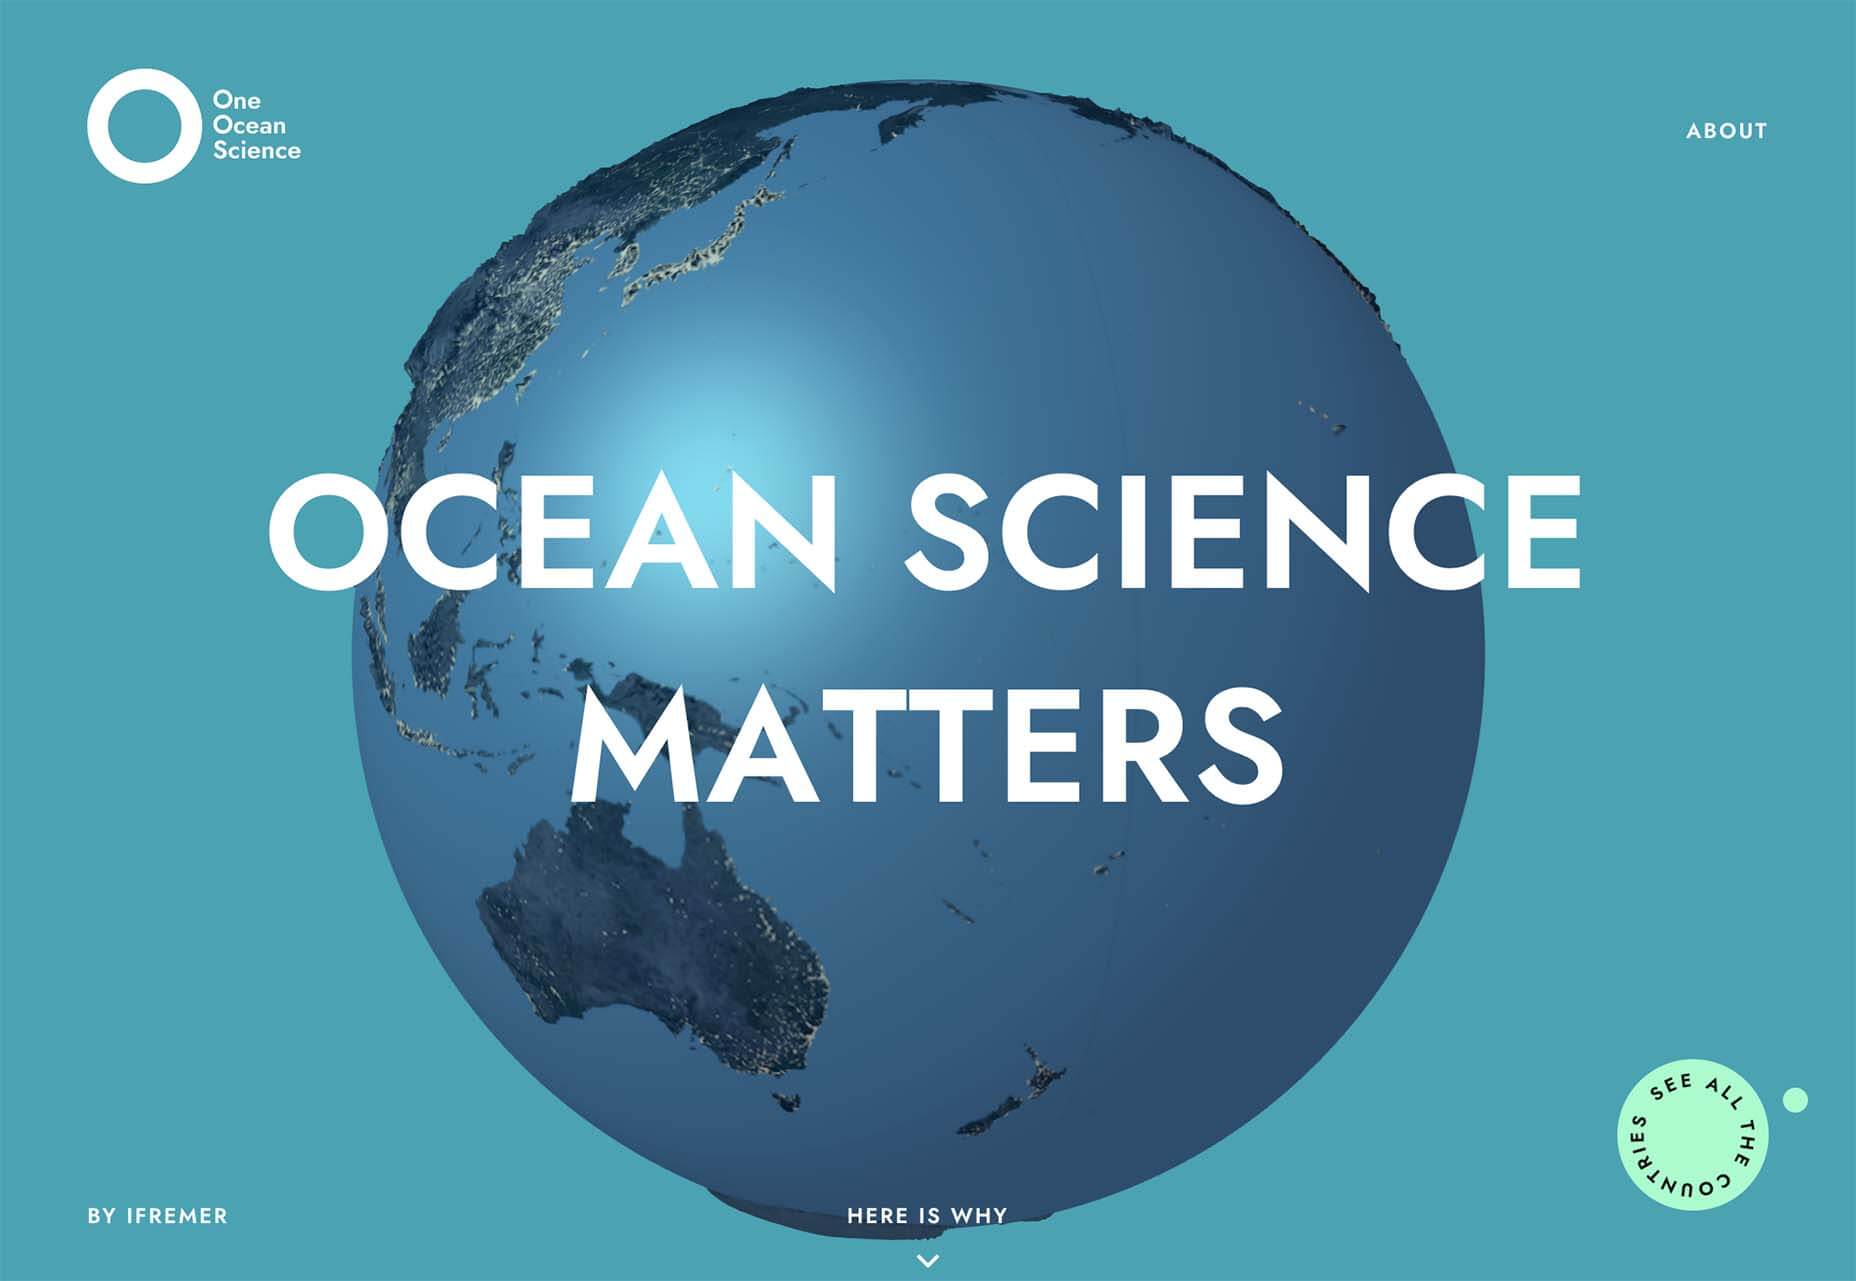
 The year might be coming to an end, but plenty of design trends are still beginning to emerge. It’ll be interesting to see how many of these website design elements remain popular into the new year. From vintage elements to circles to happier feelings, there’s a lot to play with here.
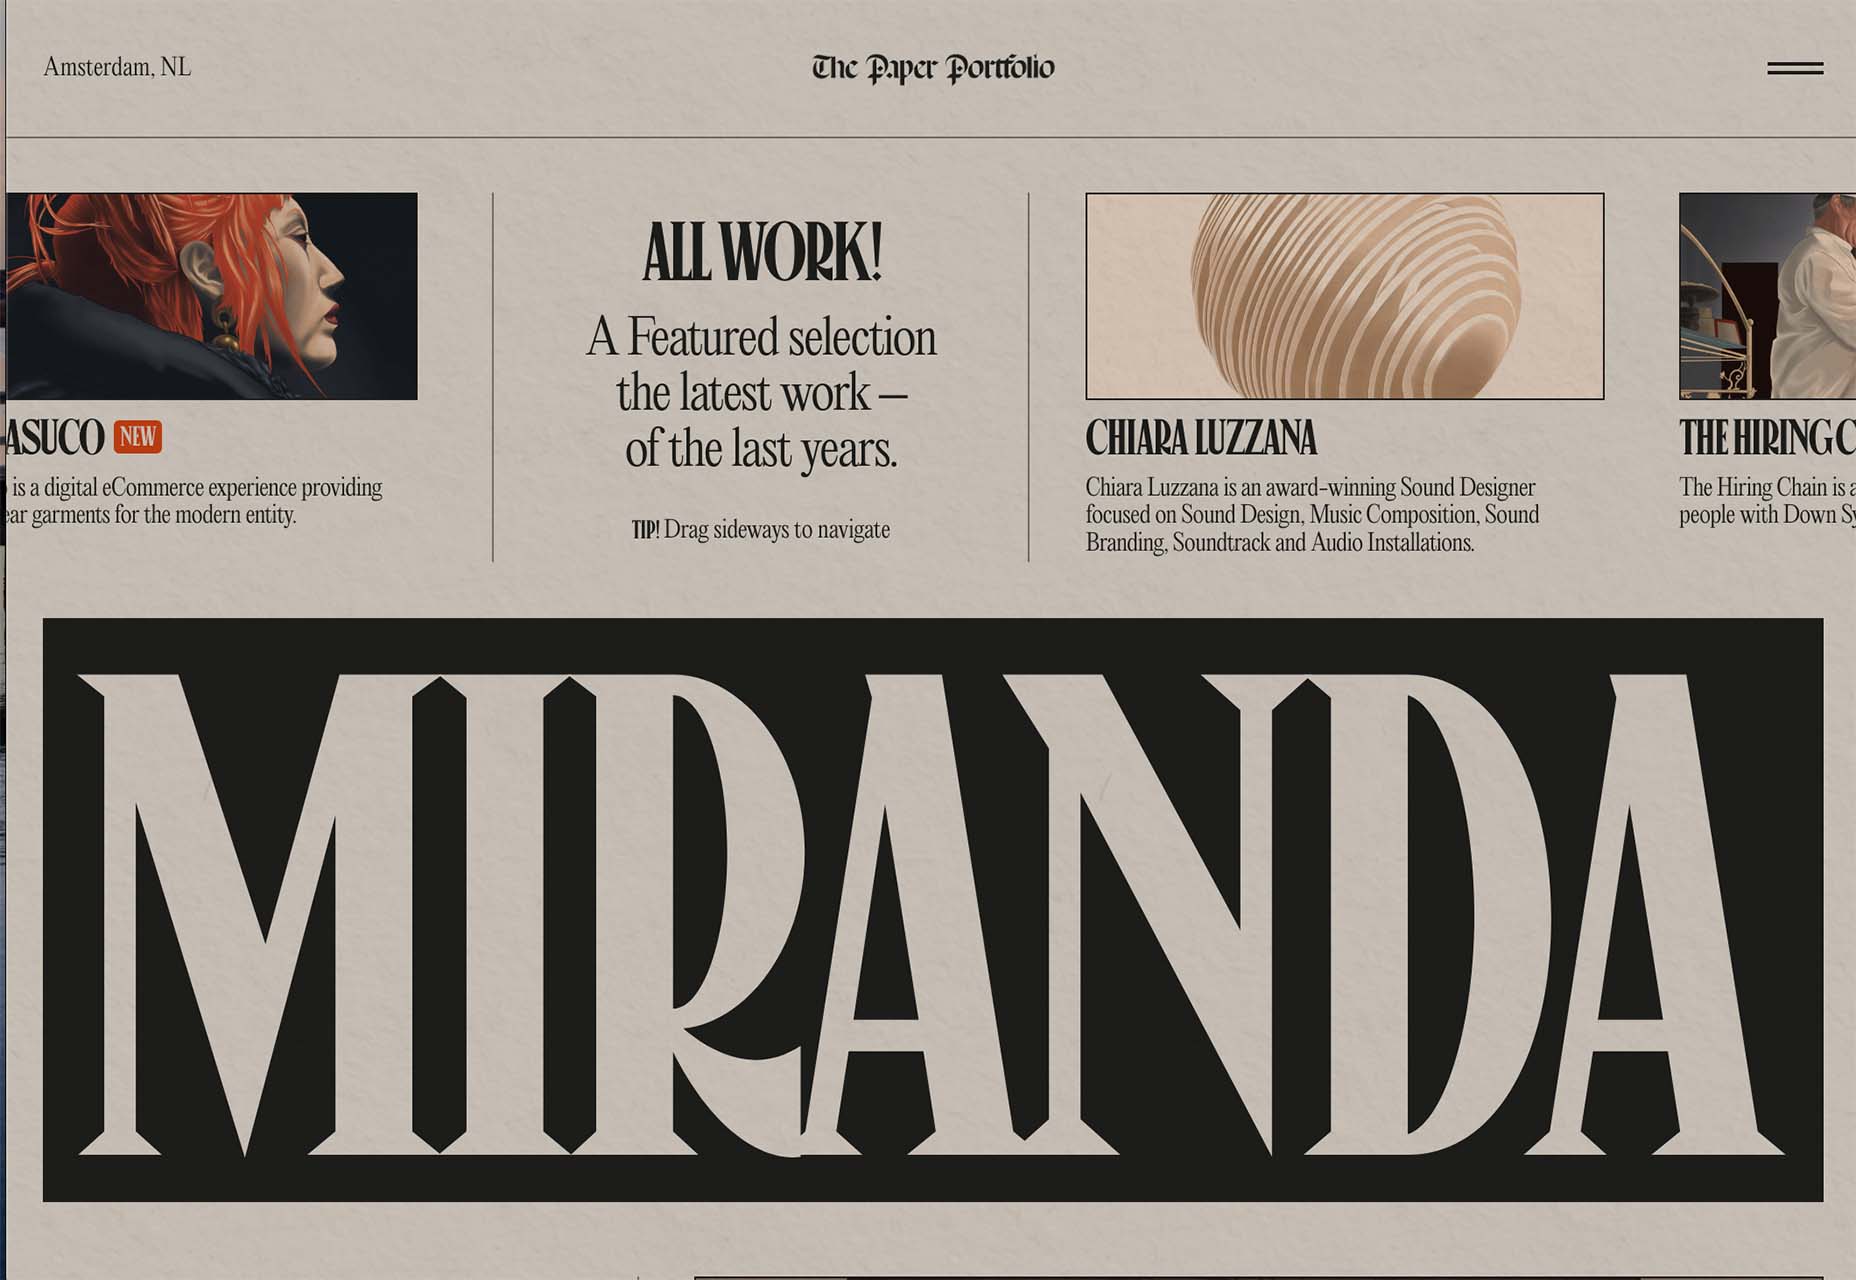


 Every day design fans submit incredible industry stories to our sister-site,


 Every day design fans submit incredible industry stories to our sister-site,