Articles

Amazon Web Services (AWS) is the most popular public cloud, with 175 services and counting. A key element of a successful cloud operation is gaining visibility into what is running where, what issues are occurring, and dealing with them, preferably automatically.

In this article, I’ll discuss the basics of AWS monitoring, including Amazon services that can assist with monitoring, key metrics to watch for the most popular Amazon services, and a special focus on monitoring EC2 environments, which are the basis for most Amazon deployments.

Source de l’article sur DZONE

Imagine a room with a wall of screens displaying closed-circuit video feeds from dozens of cameras, like a security office in a film. In the movies, there is often a guard responsible for keeping an eye on the screens that inevitably falls asleep, allowing something bad to happen. Although intuition and other distinctly “people skills” are useful in security, most would agree that the human attention span isn’t well-suited for always-on, 24/7 video monitoring. Of course, footage can always be reviewed after something happens, but it’s easy to see the security value of detecting something out of the ordinary as it unfolds.

Several cameras capturing different scenes.
Cameras capture our every move, but who watches them?

Now imagine a video artificial intelligence (AI) application capable of processing thousands of camera feeds in real-time. The AI constantly compares new footage to historical footage, then classifies anomalous events by their threat level. Humans are still involved, both to manage the system as well as review and respond to potential threats, but AI takes over where we fall short. This isn’t a hypothetical situation: from smart police drones to intelligent doorbells sold by Amazon and Google, AI-powered surveillance solutions are becoming increasingly sophisticated, affordable, and ubiquitous.

Source de l’article sur DZONE

Using the Prometheus Operator has become a common choice when it comes to running Prometheus in a Kubernetes cluster. It can manage Prometheus and Alertmanager for us with the help of CRDs in Kubernetes. The kube-prometheus-stack Helm chart (formerly known as prometheus-operator) comes with Grafana, node_exporter, and more out of the box.

In a previous blog post about Prometheus, we took a look at setting up Prometheus and Grafana using manifest files. We also explored a few of the metrics exposed by YugabyteDB. In this post, we will be setting up Prometheus and Grafana using the kube-prometheus-stack chart. And we will configure Prometheus to scrape YugabyteDB pods. At the end, we will take a look at the YugabyteDB Grafana dashboard that can be used to visualize all the collected metrics.

Source de l’article sur DZONE

With the world changing rapidly the data and the system that controls the data are also changing. At the beginning of the Internet and WWW, the data used to be stored on one’s personal machine, and it was accessed by only the person owning the device.

But now, with thousands of companies working with millions of employees and billions of terabytes of data, it is necessary to control and monitor who is going to access the data and who is going to made changes in it.

Source de l’article sur DZONE

TiDB, an open-source, distributed SQL database, provides detailed monitoring metrics through Prometheus and Grafana. These metrics are often the key to troubleshooting performance problems in the cluster.

However, for novice TiDB users, understanding hundreds of monitoring metrics can be overwhelming. You may wonder:

Source de l’article sur DZONE

When I first started following Charity on Twitter back in early 2019, I was quickly overwhelmed by the new words and concepts she was discussing. I liked the results she described: faster debugging, less alert fatigue, happier users. Those are all things I wanted for my team! But I was hung up on these big polysyllabic words, which stopped me from taking those first steps toward improving our own observability.

This post is my attempt to help orient folks who want to learn more about observability but maybe feel overwhelmed or intimidated by the vocabulary list, like I did. My goal is to get everyone on the same page about what these words mean so that we can focus on leveraging the tools and ideas to build better software and deliver more value! 

Source de l’article sur DZONE

Comment améliorer, contrôler et automatiser ses processus ? L’utilisation de SAP Cloud Platform permet aux entreprises d’atteindre leurs objectifs de Process Excellence.

Une connaissance fine des processus et la capacité à les améliorer en continu sont les clés de l’excellence opérationnelle de l’entreprise. Ceci nécessite agilité, collaboration, automatisation et intelligence dans les processus.

Cet objectif d’excellence des processus peut être atteint au travers d’un cycle comprenant quatre étapes :

  1. compréhension des processus ;
  2. amélioration des processus ;
  3. automatisation des processus ;
  4. surveillance et ajustement des processus.

« Il est essentiel de comprendre les processus existants, avant de pouvoir les améliorer et en tirer plus de valeur », résume Olivier Enault, Presales for Information & Process Excellence, SAP France. La première phase consiste donc à découvrir les processus au travers de la technologie Process Mining de Celonis, qui va les détecter et les analyser.

Redessiner les processus avec SAP Cloud Platform Workflow

SAP Cloud Platform Workflow va permettre de créer ou redéfinir des processus, de façon transparente et simple. « SAP Cloud Platform Workflow propose un moteur complet de design et d’orchestration des workflows, explique Laurent Rieu, Business Development Director EMEA, SAP. Il permet de digitaliser des processus précédemment basés sur des opérations manuelles (par exemple des échanges de mails) et de les orchestrer de manière rigoureuse. »

L’exemple type de processus RH est l’arrivée d’un nouvel employé. En liaison avec le SI, le processus va enchainer des actions, combinant des règles métiers prédéfinies et des tâches effectuées manuellement. Un premier manager va par exemple vérifier que le coach et le matériel assigné à l’employé sont les bons. Un second va se charger d’organiser le déplacement du nouvel employé, lié à sa formation, etc. Et en fin de chaine, il sera possible de collecter l’expérience utilisateur au travers de l’offre Qualtrics, afin d’améliorer encore ce processus.

Automatiser les processus avec SAP Intelligent RPA

Toutes les tâches sans valeur ajoutée sont ensuite automatisées au travers de SAP Intelligent Robotic Process Automation. « Lancés par les utilisateurs ou déclenchés automatiquement suivant un évènement donné, les robots proposent un ROI très rapide, témoigne Laurent Rieu. Les projets de RPA sont courts (quelques semaines) et libèrent immédiatement du temps pour les collaborateurs de l’entreprise. »

L’objectif n’est pas d’éliminer l’humain de l’équation, mais d’automatiser tout ce qui peut l’être. Selon les cas, les processus seront donc entièrement automatisés (sous la supervision d’un responsable) ou partiellement automatisés, les robots servant alors de lien et de support aux différents intervenants.

Déploiement et surveillance assurés par SAP Cloud Platform

Les processus sont déployés par la suite sur SAP Cloud Platform. Le monitoring est alors pris en charge par SAP Cloud Platform Process Visibility. Cet outil offre une vue en temps réel des processus et de leurs instances et fait remonter immédiatement les informations sous la forme d’indicateurs de performance destinés aux utilisateurs métier. Ainsi, des tableaux de bords permettent d’identifier rapidement tout incident ou ralentissement.

Les informations fournies par SAP Cloud Platform Process Visibility serviront de base à un nouveau cycle d’amélioration et d’automatisation des processus. C’est cette boucle d’amélioration continue qui permettra d’atteindre l’objectif d’excellence des processus.

Accélérer la mise en œuvre des projets de digitalisation et d’automatisation des processus

Maintenant que la proposition de valeur des activités de digitalisation et d’automatisation des processus est claire, la question importante reste la suivante : « Comment accélérer la réalisation de tels projets ? ».

SAP Cloud Platform ne se contente pas de fournir les briques technologiques pour implémenter ces scénarios de digitalisation et d’automatisation des processus. Nous allons plus loin et proposons des modèles complets de processus, de robots d’automatisation et de tableaux de bord de pilotage prêts à l’emploi pour permettre de simplifier la mise en œuvre rapide de tels scénarios, tout en fournissant la flexibilité requise pour assurer l’adéquation entre ces modèles et les besoins de nos clients.

Vous trouverez ainsi une collection grandissante de robots d’automatisation prédéfinis sur notre site en ligne Intelligent RPA Store

Vous trouverez également un ensemble de modèles de processus et de tableaux de bord sur notre site API Business Hub

The post Atteignez l’excellence des processus avec la SAP Cloud Platform appeared first on SAP France News.

Source de l’article sur sap.com

On-call: you may see it as a necessary evil. When fast incident response can make or break your reputation, designating people across the team to be ready to react at all hours of the day is a necessity.  But, this often creates immense stress while eating into personal lives. It isn’t a surprise that many engineers have horror stories about the difficulty of carrying a pager.

But does on-call have to be so dreadful? No way. Here are five best practices to help your team respond quicker and build more resilient systems.

Source de l’article sur DZONE

Google resembles an iceberg: there’s the part above the water we can see and use everyday; there’s also the part beneath the water, that we don’t see and know little about.

While many of us are concerned about the aspects of Google we don’t see — the parts that threaten our privacy, or monopolize the web — there’s no denying that Google offers some amazing products and tools, many of them free, all from the convenience of a single login.

Today we’re going to take a look at 12 tools from Google that really do bring something positive to the table.

1. Polymer

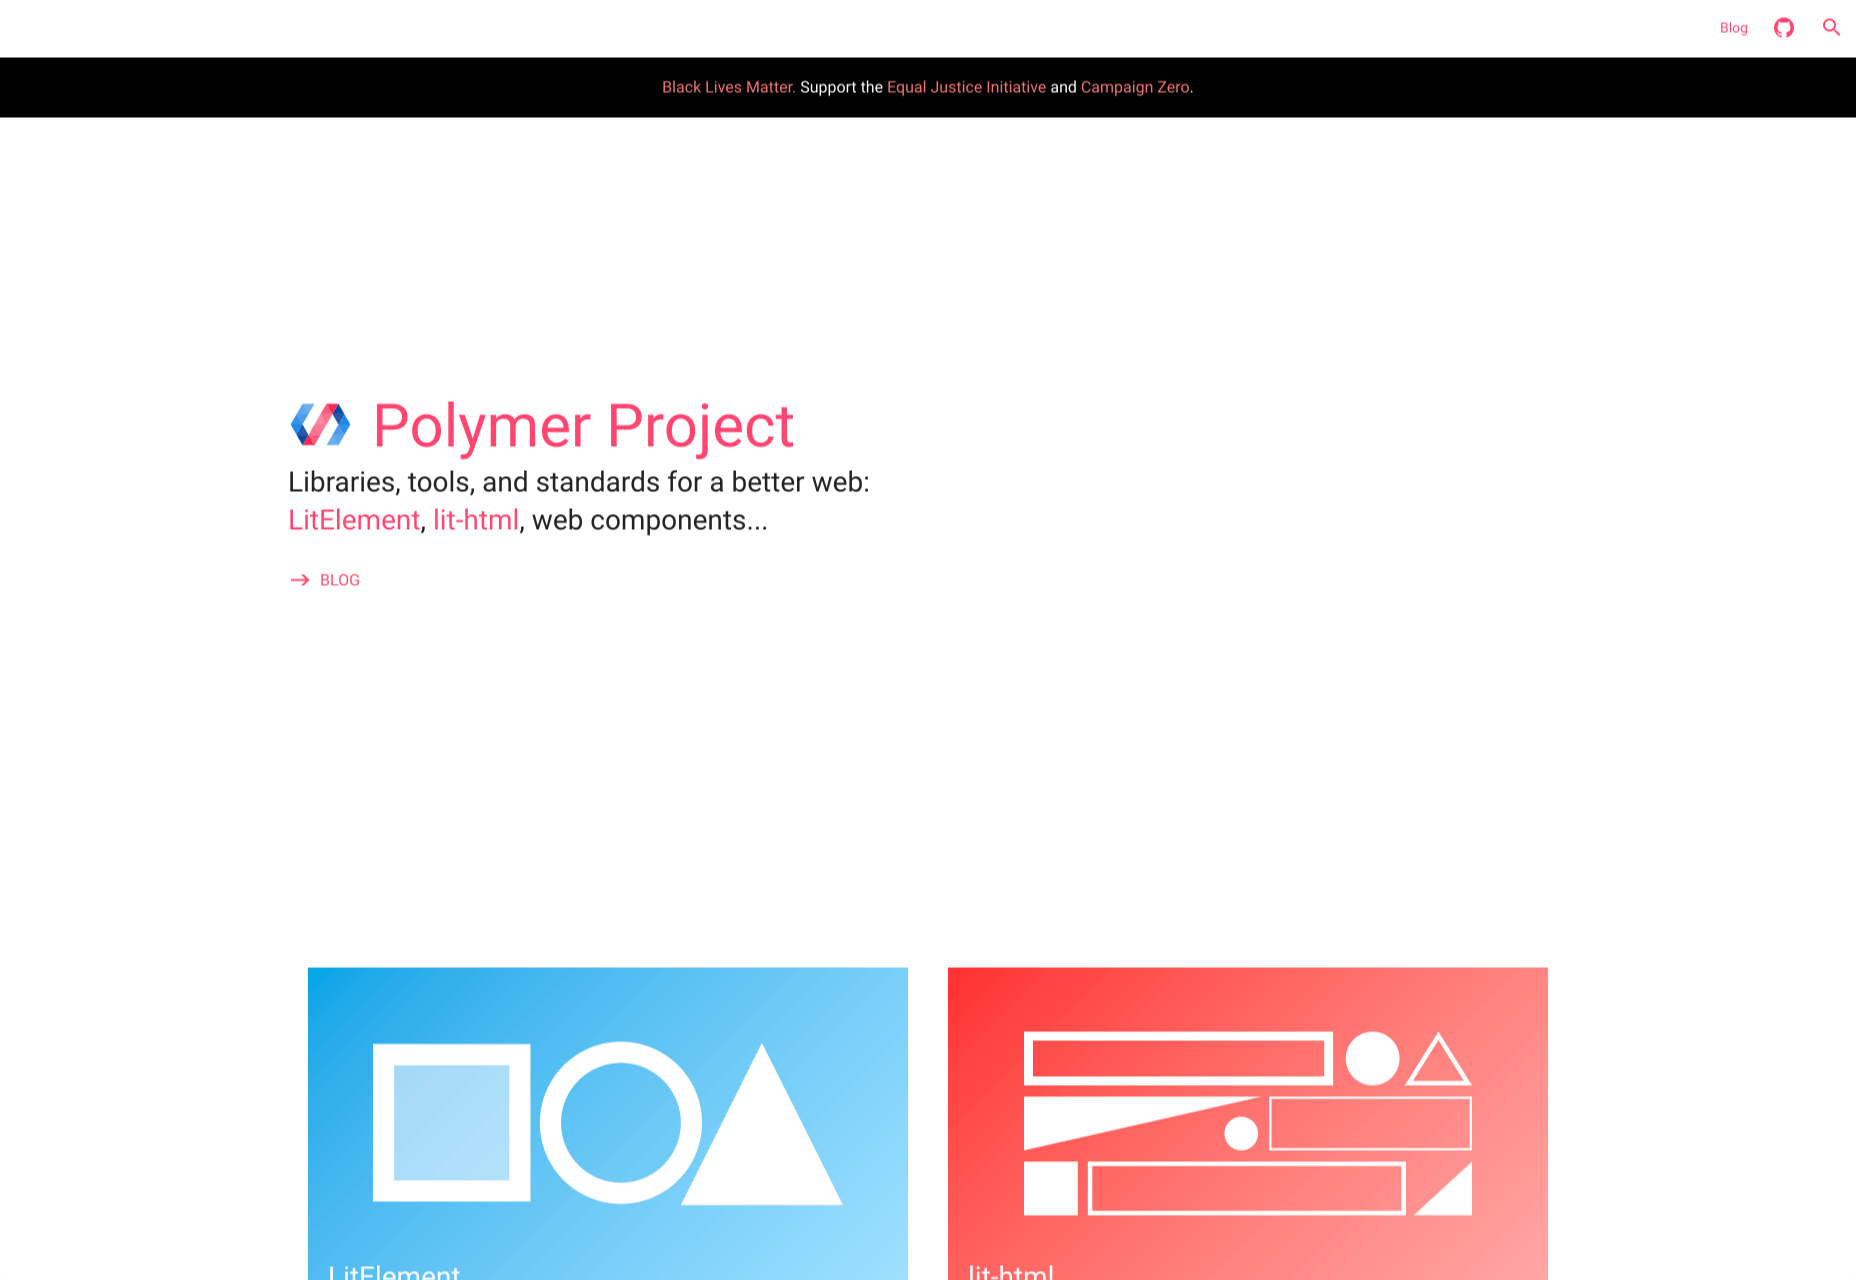
Polymer is an open-source JavaScript library from Google for building web applications using Web Components. The platform comes with a ton of libraries and tools to help designers and developers unlock the web’s potential by taking advantage of features like HTTP/2, Web Components, and Service Workers. 

The main feature of Polymer is Web Components. With Web Components, you can share custom elements to any site, work seamlessly with any browser’s built-in elements, and effectively use frameworks of all kinds. Products like LitElement (a simple base class for creating fast, lightweight web components) and PWA Starter Kit make Polymer easy to use. If you like, you can build your app entirely out of Web Components.

2. Lighthouse

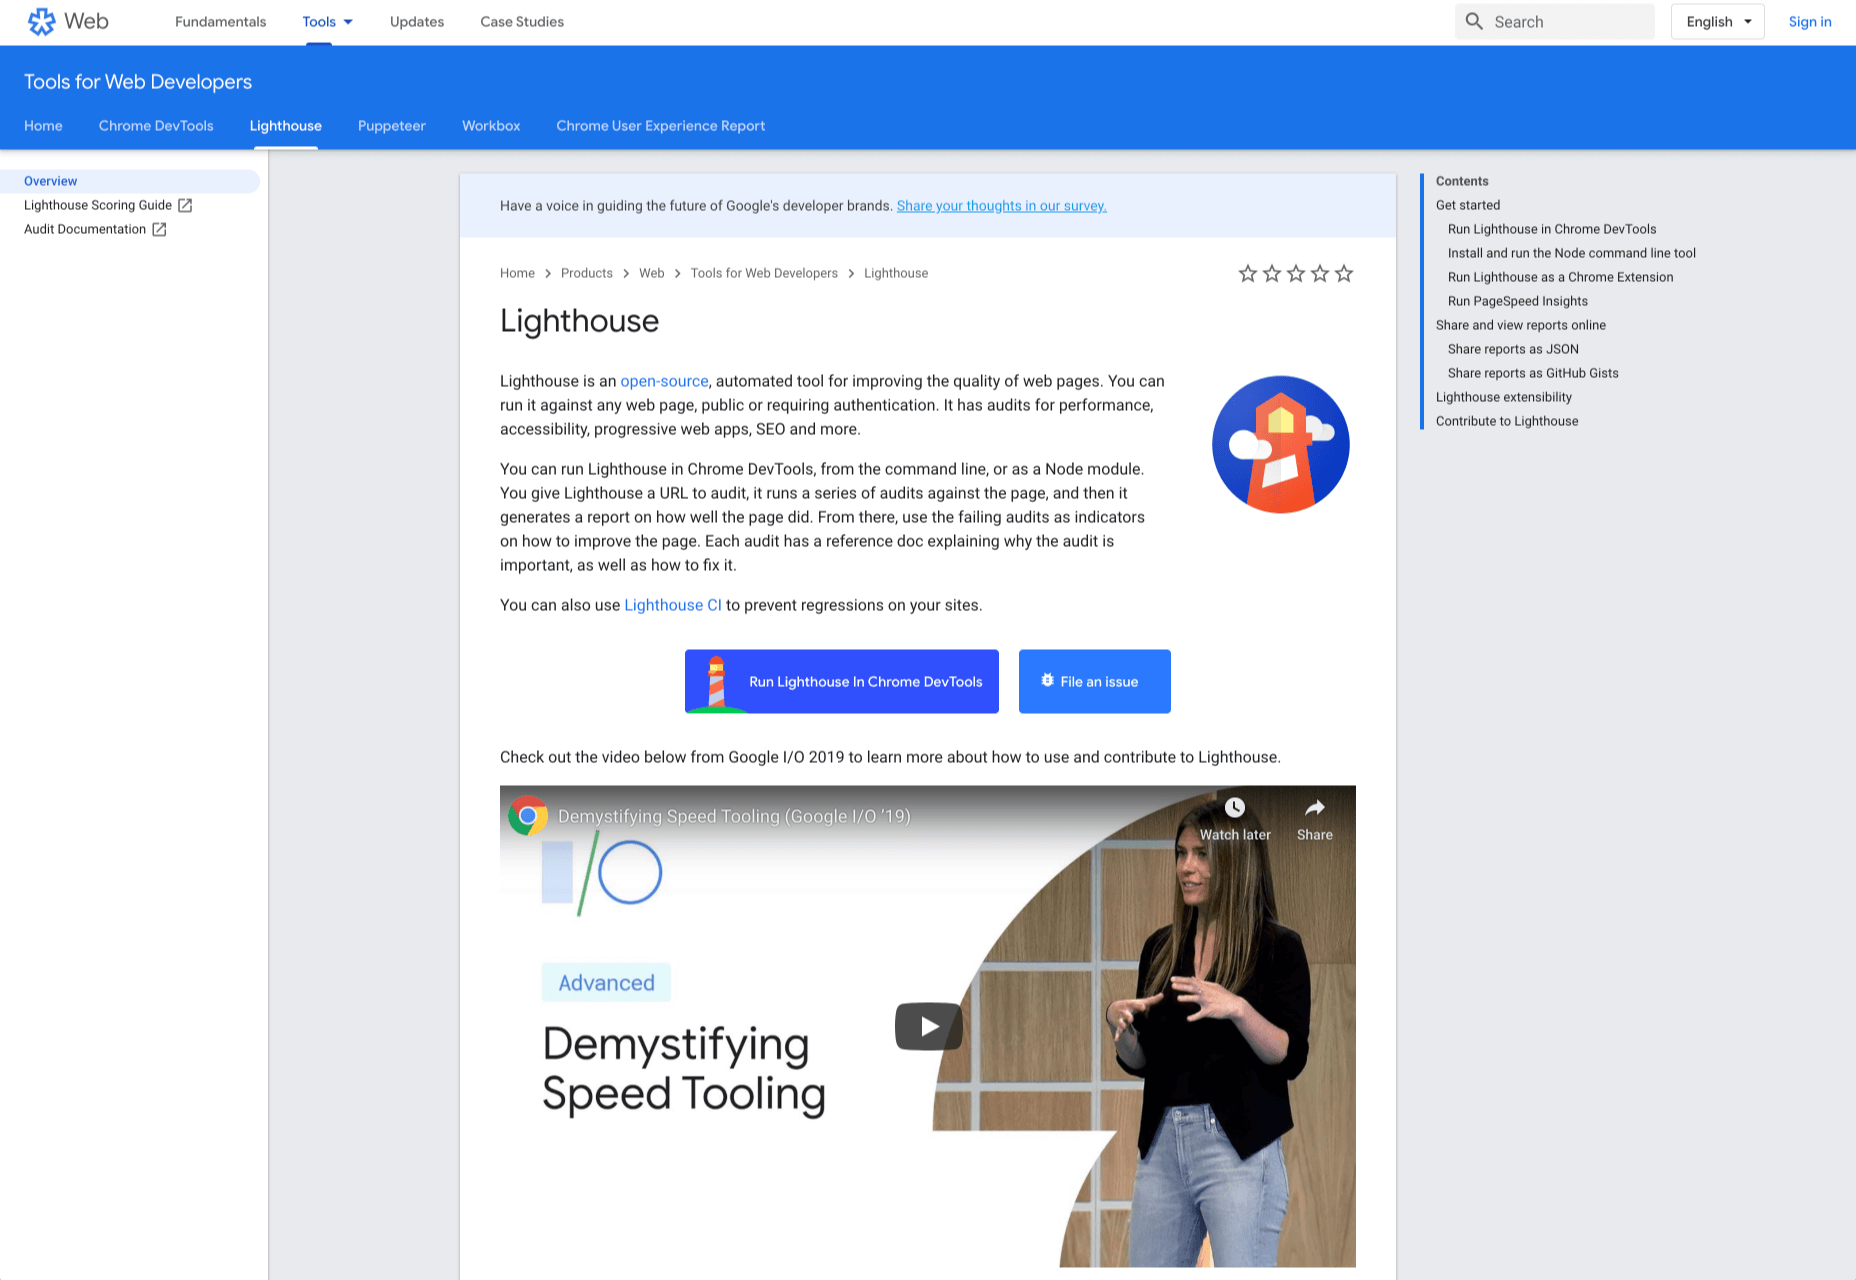
Google Lighthouse is an open-source, automated tool for improving the quality of web pages. The software allows you to audit web pages for performance, SEO, accessibility, and more. You can run Lighthouse using ChromeDevTools, directly from the command line, or as a Node module. 

To use Lighthouse in Google Chrome, just go to the URL you want to audit (you can audit any URL on the web), open ChromeDevTools, and click the Audits tab. After you have run the audit, Lighthouse will give you an in-depth report on the web page. 

With these reports, you will see which parts of your web page you need to optimize. Each report has a reference doc that explains why that audit is important and also shows you the steps you can take to fix it. 

You can also use Lighthouse CL to prevent regression on your sites. Using Lighthouse Viewer, you can view and share reports online. You can also share reports as JSON or GitHub Gists. 

Lighthouse also comes with a feature called Stack Packs that allows Lighthouse to detect what platform a site is built on. It also displays specific stack-based recommendations.

3. Google Analytics

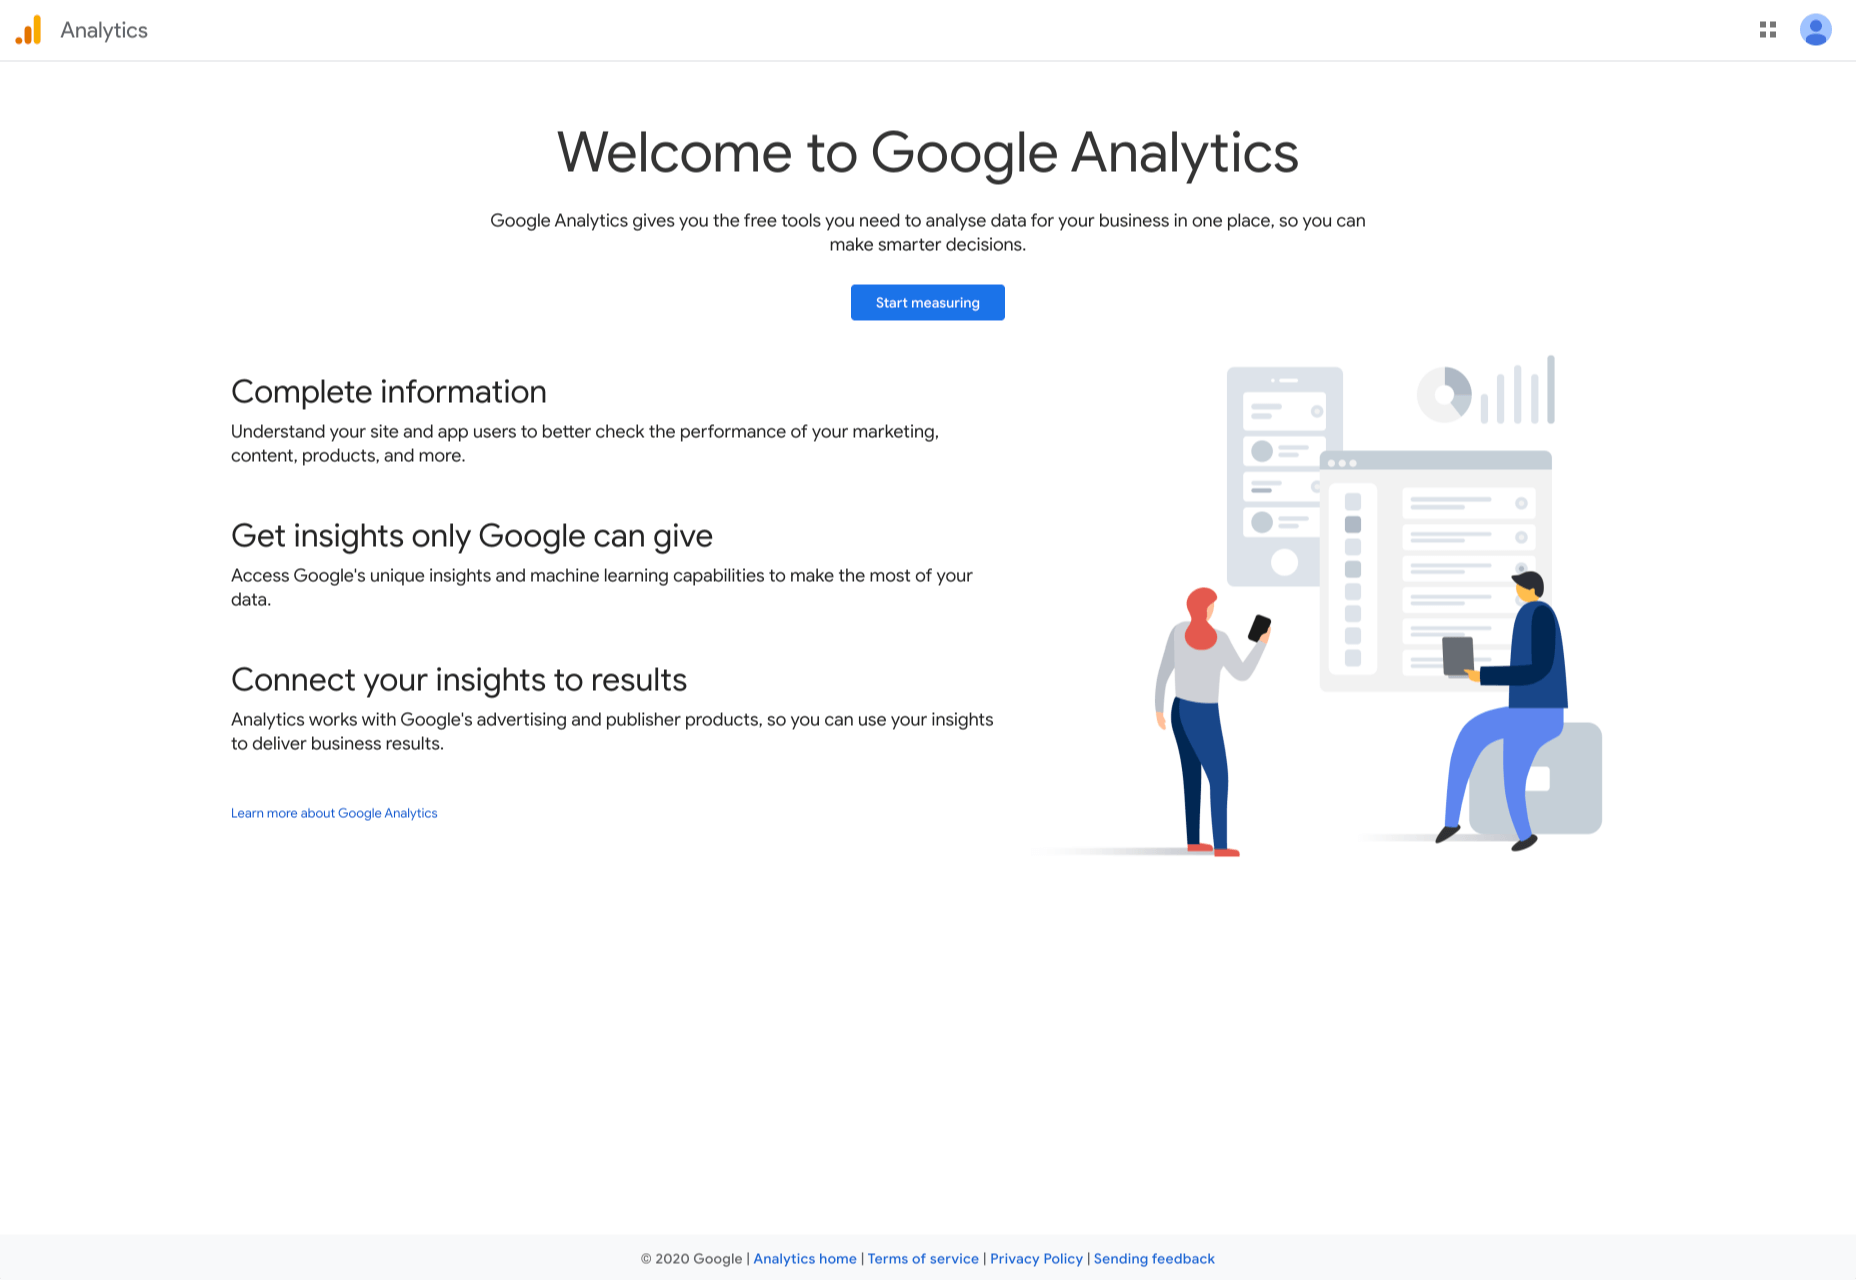
Google Analytics is the gold standard of analytics services. Google analytics can be installed on your site for free with a small amount of JavaScript and allows you to see all kinds of details about your site visitors, like what browser they’re using, and where they’re from.

By using Google Analytics you can make decisions about your site based on science, and therefore be somewhat confident that the decisions you make will result in the outcome you are expecting.

4. Flutter

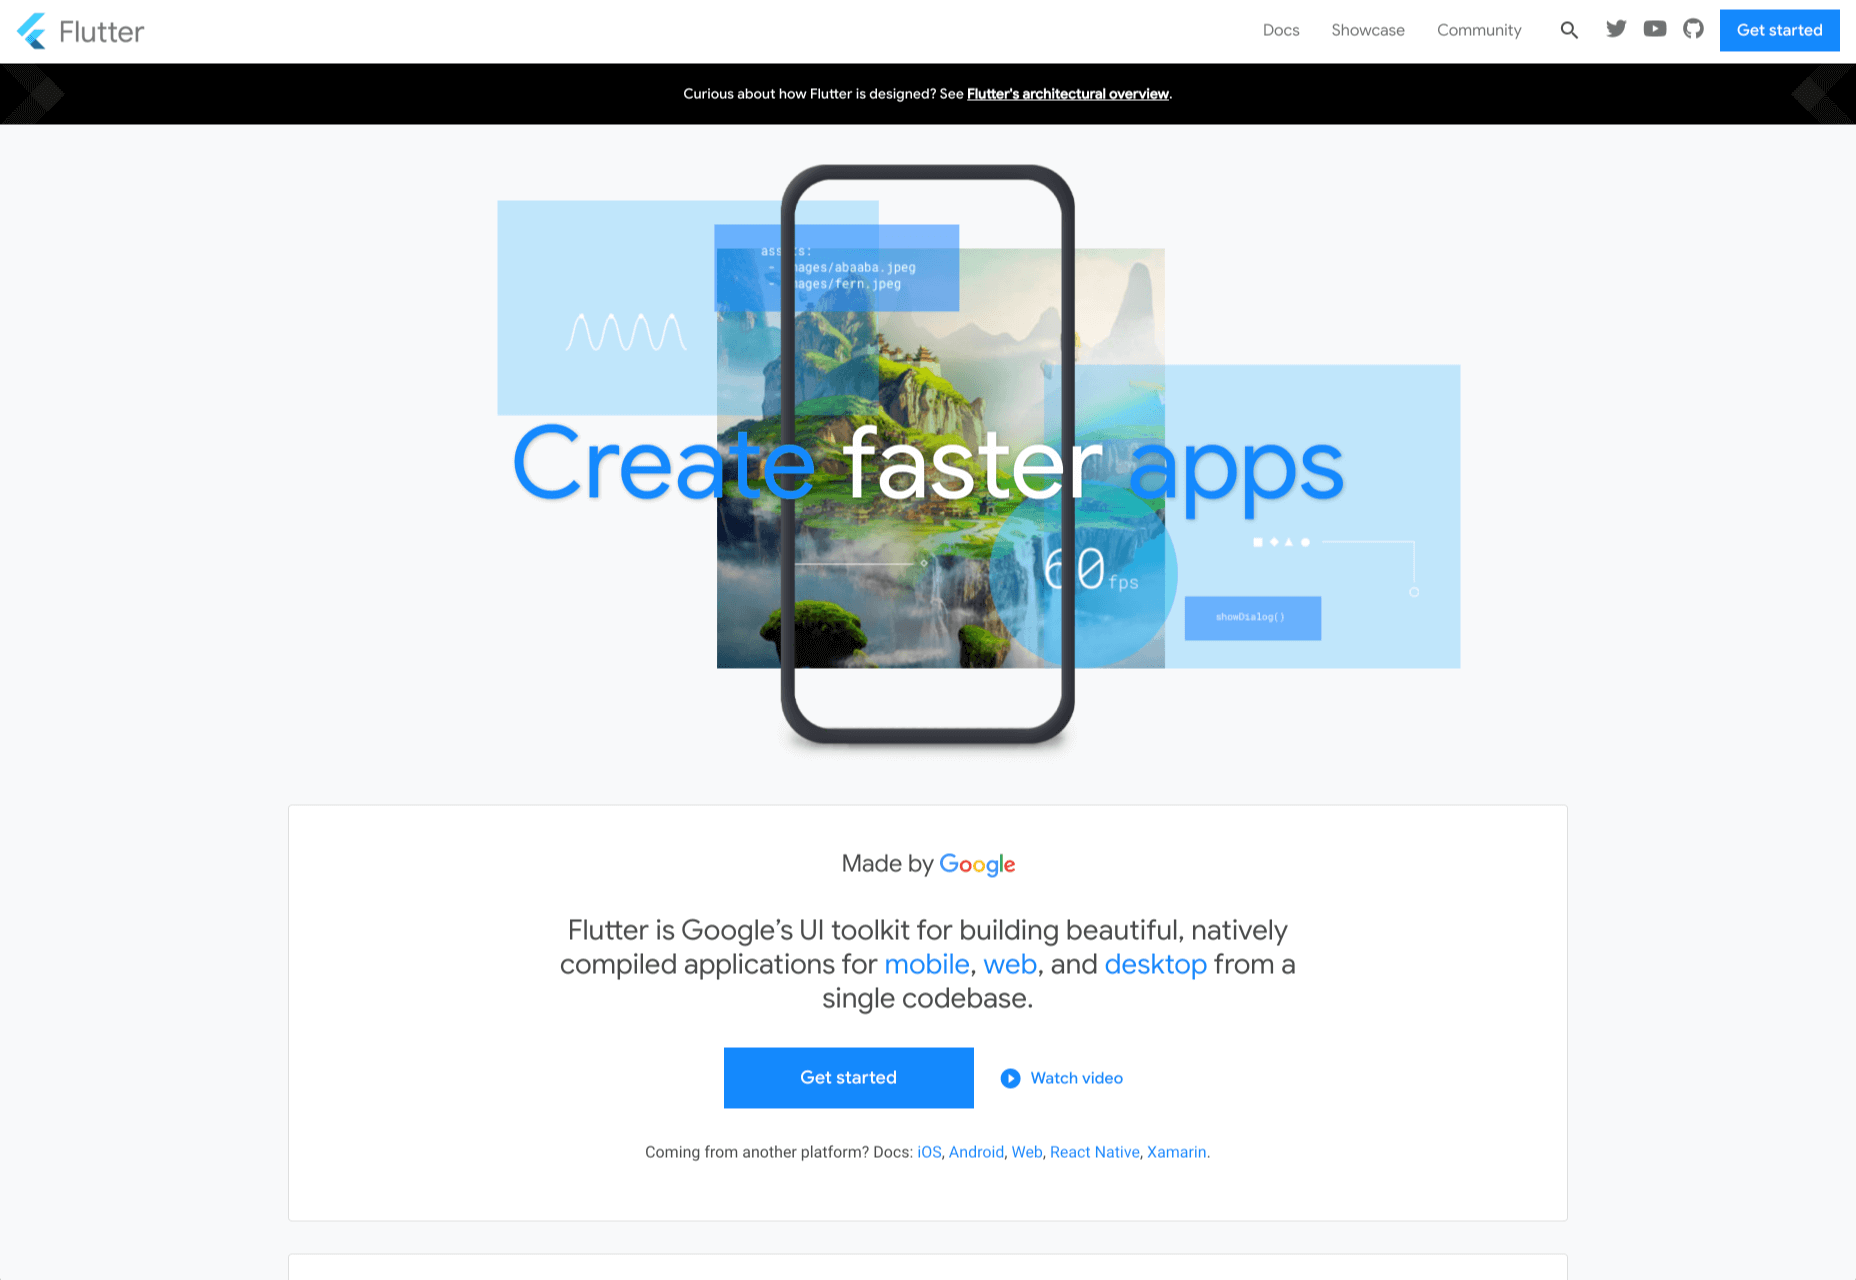
Flutter is Google’s UI toolkit for building natively compiled applications for mobile, web, and desktop from a single codebase. The toolkit is open source and free to use. The best part of Flutter is that it works with existing code. 

The toolkit has a layered architecture that allows for full customization, which results in fast rendering and flexible designs. It also comes with fully-customizable widgets that allow you to build native interfaces in minutes. With these widgets, you will be able to add platform features such as scrolling, navigation, icons, and fonts to provide a full native performance on both iOS and Android.

Flutter also has a feature called hot reload that allows you to easily build UIs, add new features, and fix bugs faster. You can also compile Flutter code to native ARM machine code using Dart native compilers. 

5. Google API Explorer

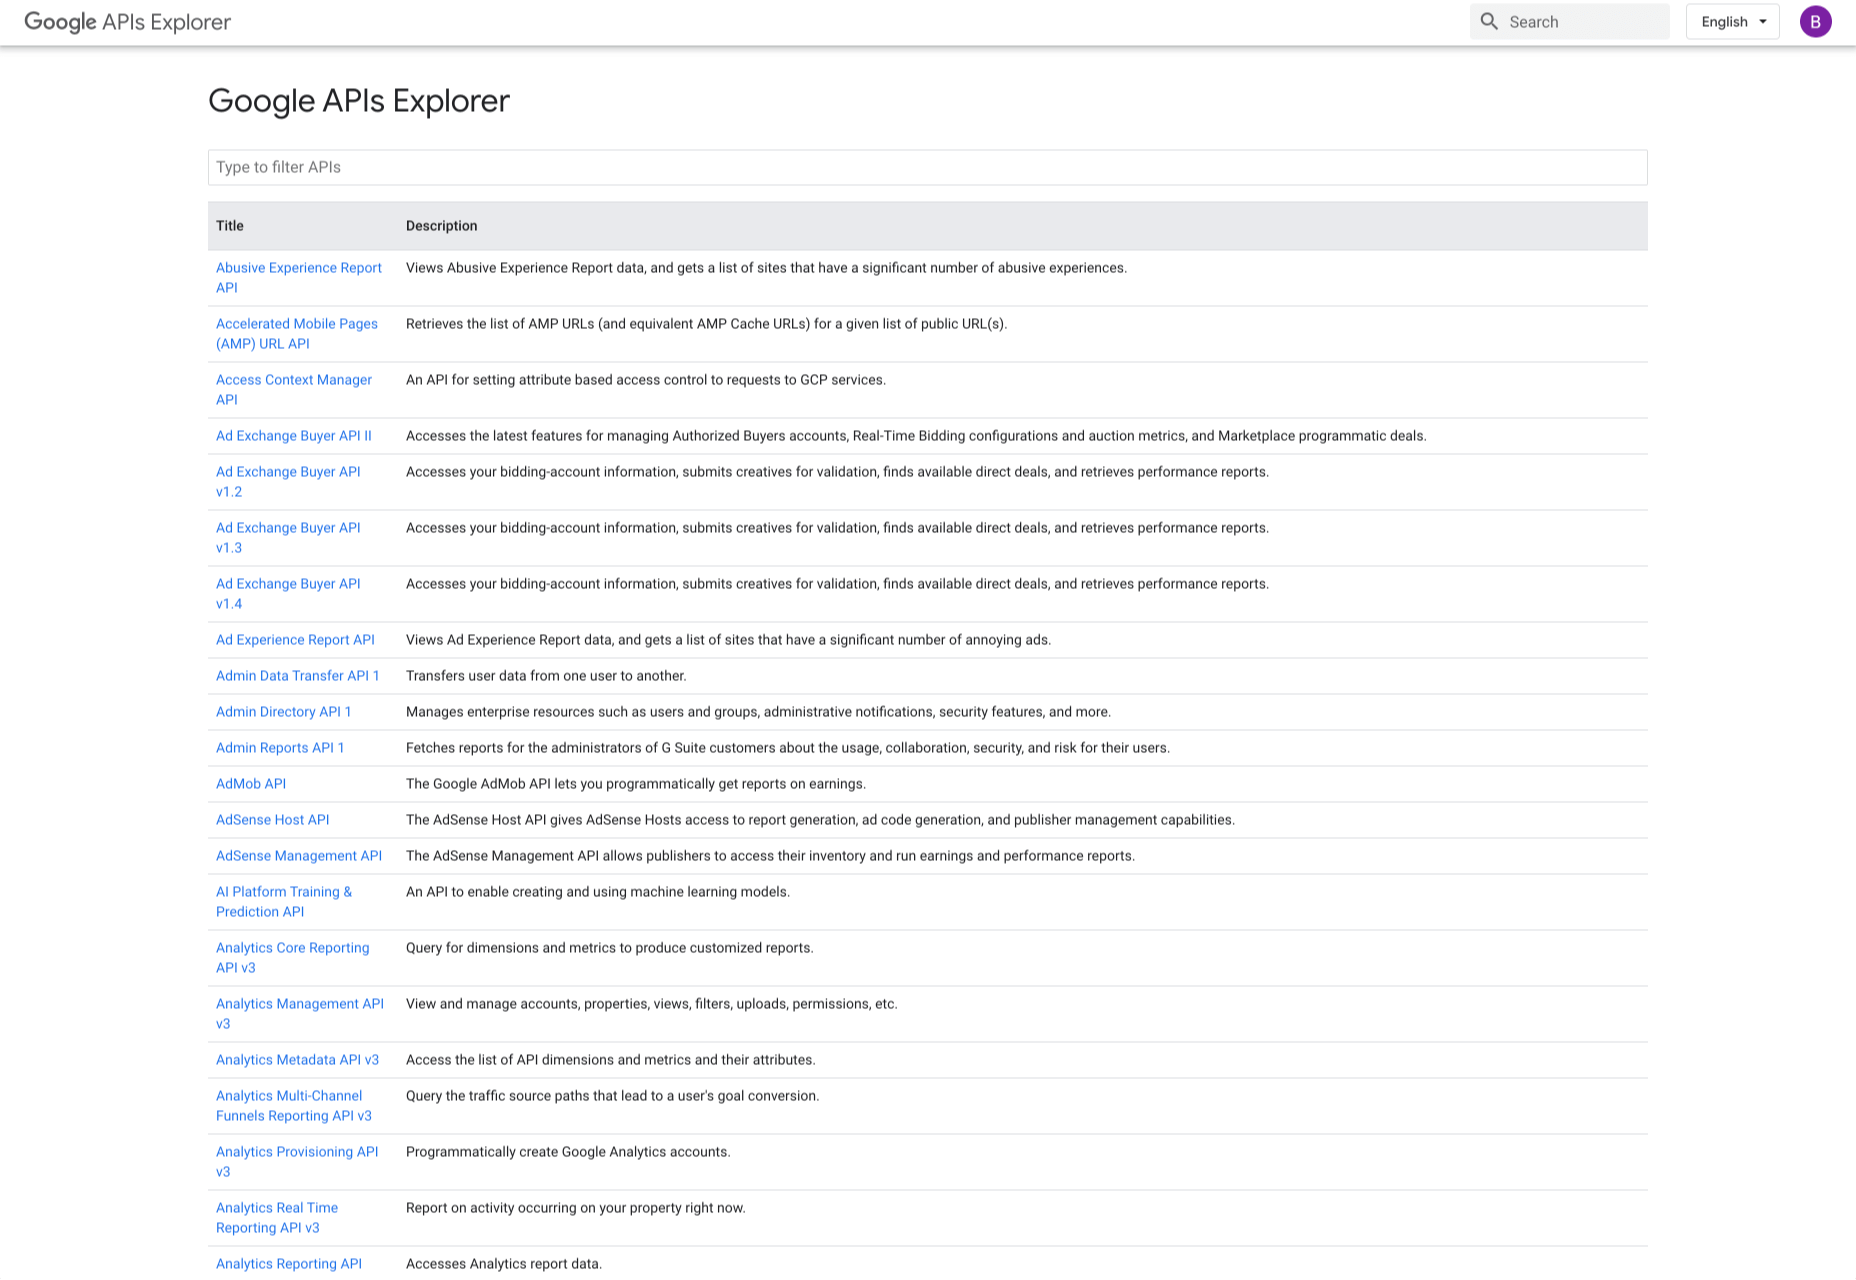
Google has a huge library of APIs that are available to developers but finding these APIs can be difficult. Google API Explorer makes it easy for developers to locate any API. On the Google API Explorer web page, you will see a complete list of the entire API library. You can easily scroll through the list or use the search box to filter through the API list. 

The best part of Google API Explorer is that each link to a reference page comes with more details on how to use the API. API Explorer is an excellent way to try out methods in the Monitoring API without having to write any code.

6. Puppeteer

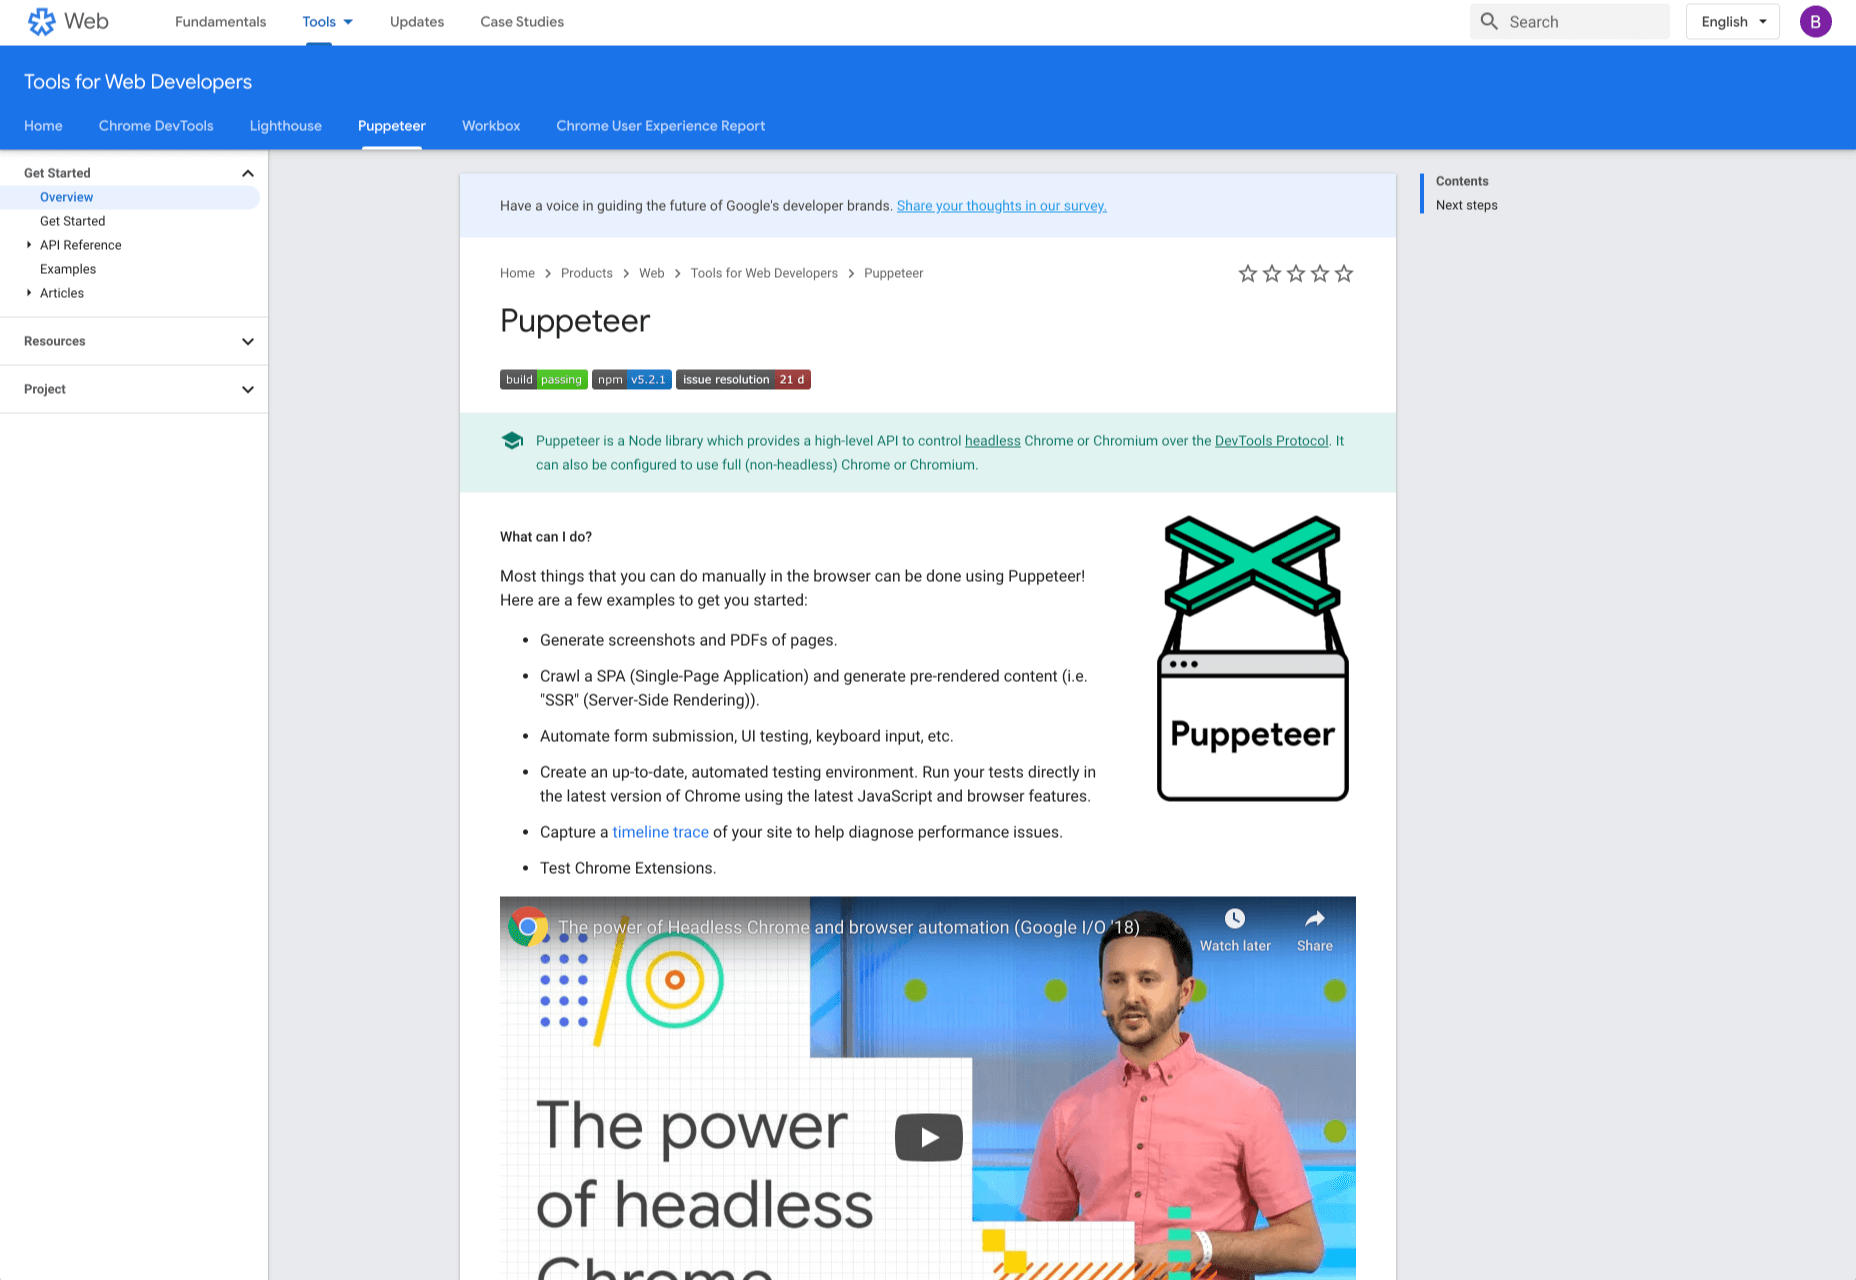
Puppeteer is a project from the Google Chrome team. The platform enables web developers to control a Chrome (or any other Chrome DevTools Protocol based browser) and execute common actions, much like in a real browser. Puppeteer is also a Node library and it provides a high-level API for working with headless Chrome. It is also a useful tool for scraping, testing, and automating web pages. 

Here are some things you can do with Puppeteer: generate screenshots and PDFs of pages, UI testing, test Chrome Extensions, automate form submission, generate pre-rendered content, and crawl Single-Page Applications. 

7. Codelabs

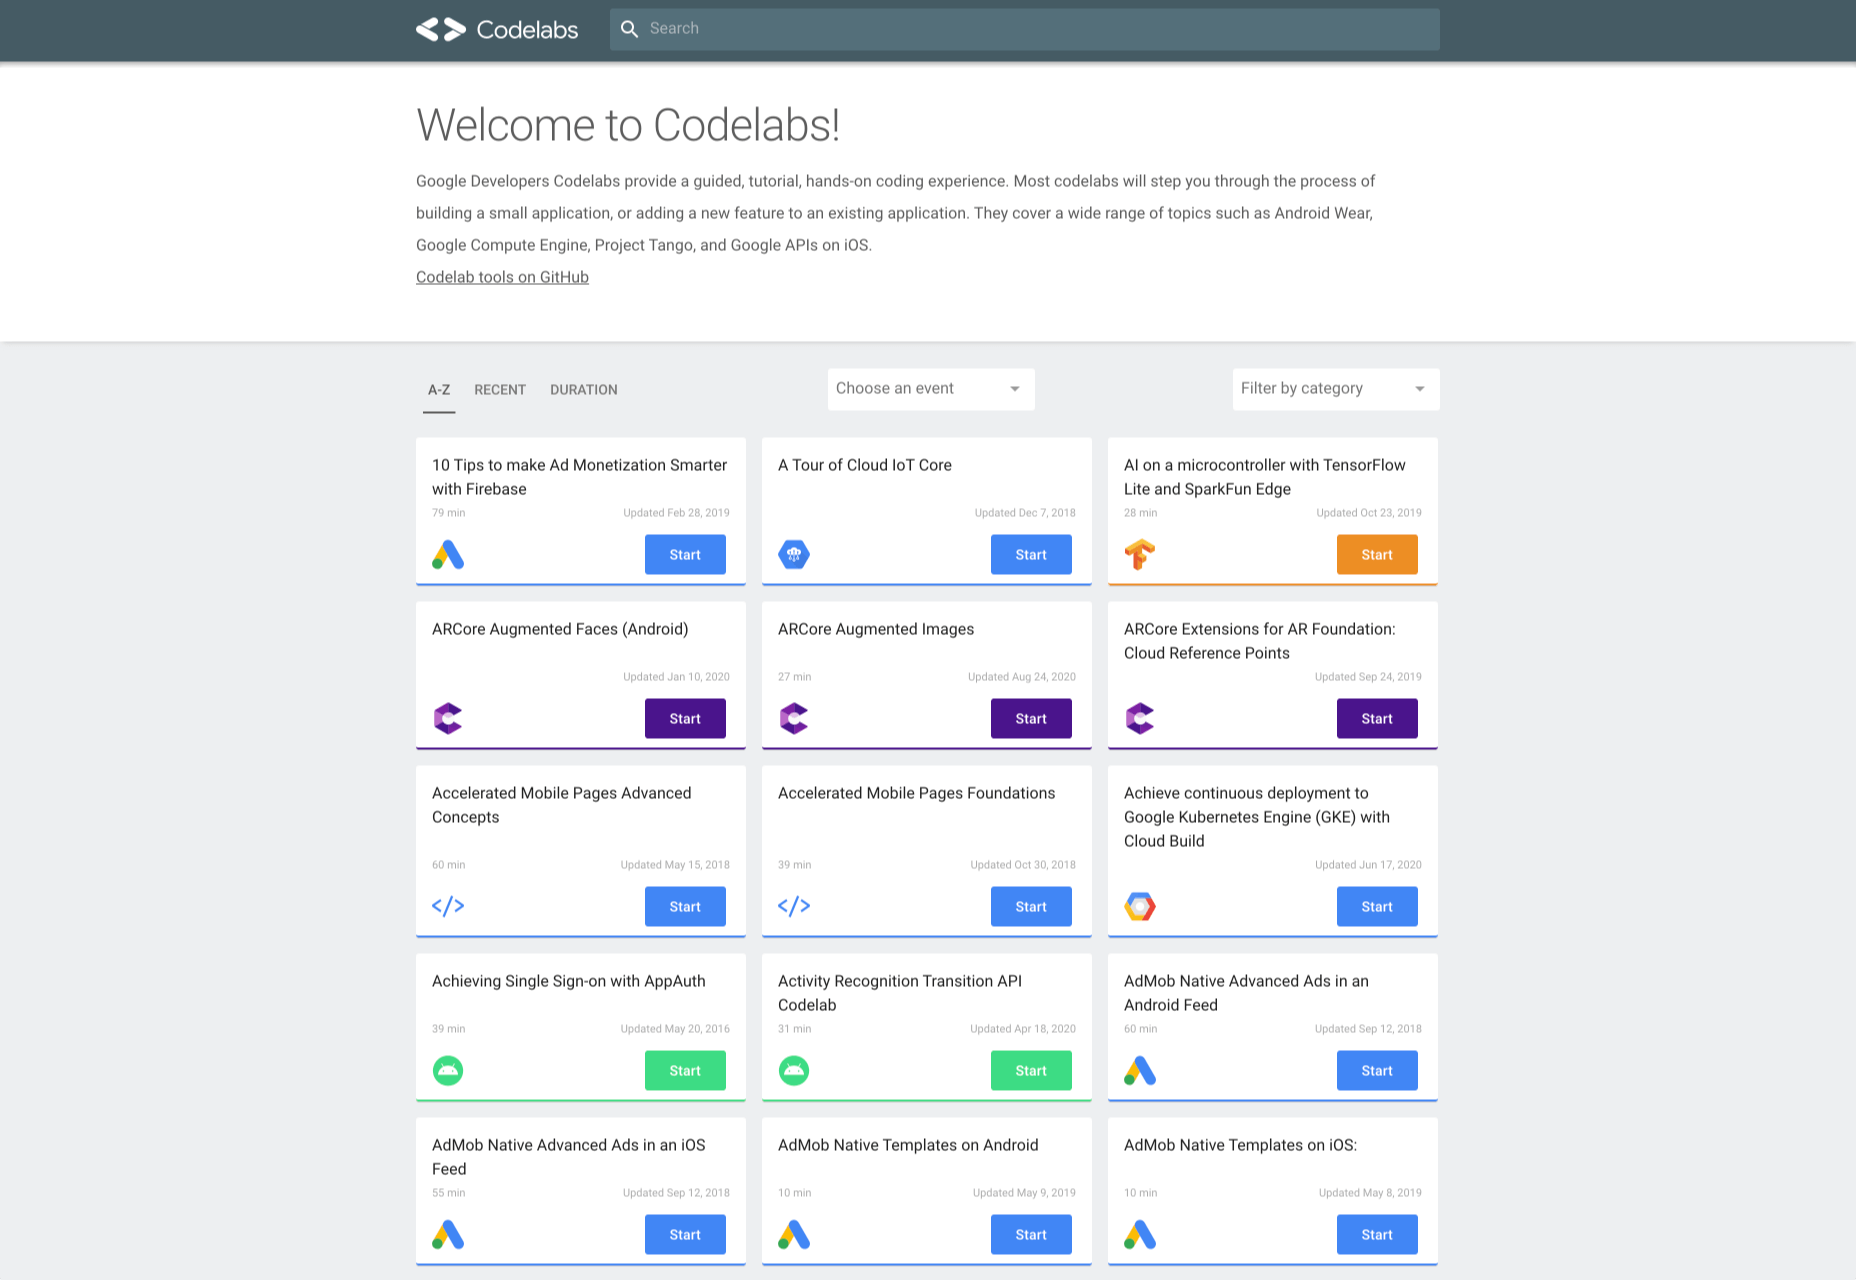
Google Developer Codelabs is a handy tool for beginner developers and even advanced developers who want to improve their knowledge. Codelabs provide a guided, tutorial, hands-on coding experience. Codelabs’ site is broken down into several tutorial sessions on different topics. 

With the tutorials on Codelabs, you can learn how to build applications from scratch. Some of the tutorial categories include Augmented reality, TensorFlow, Analytics, Virtual Analytics, G Suite, Search, Google Compute Engine, and Google APIs on iOS. 

8. Color Tool

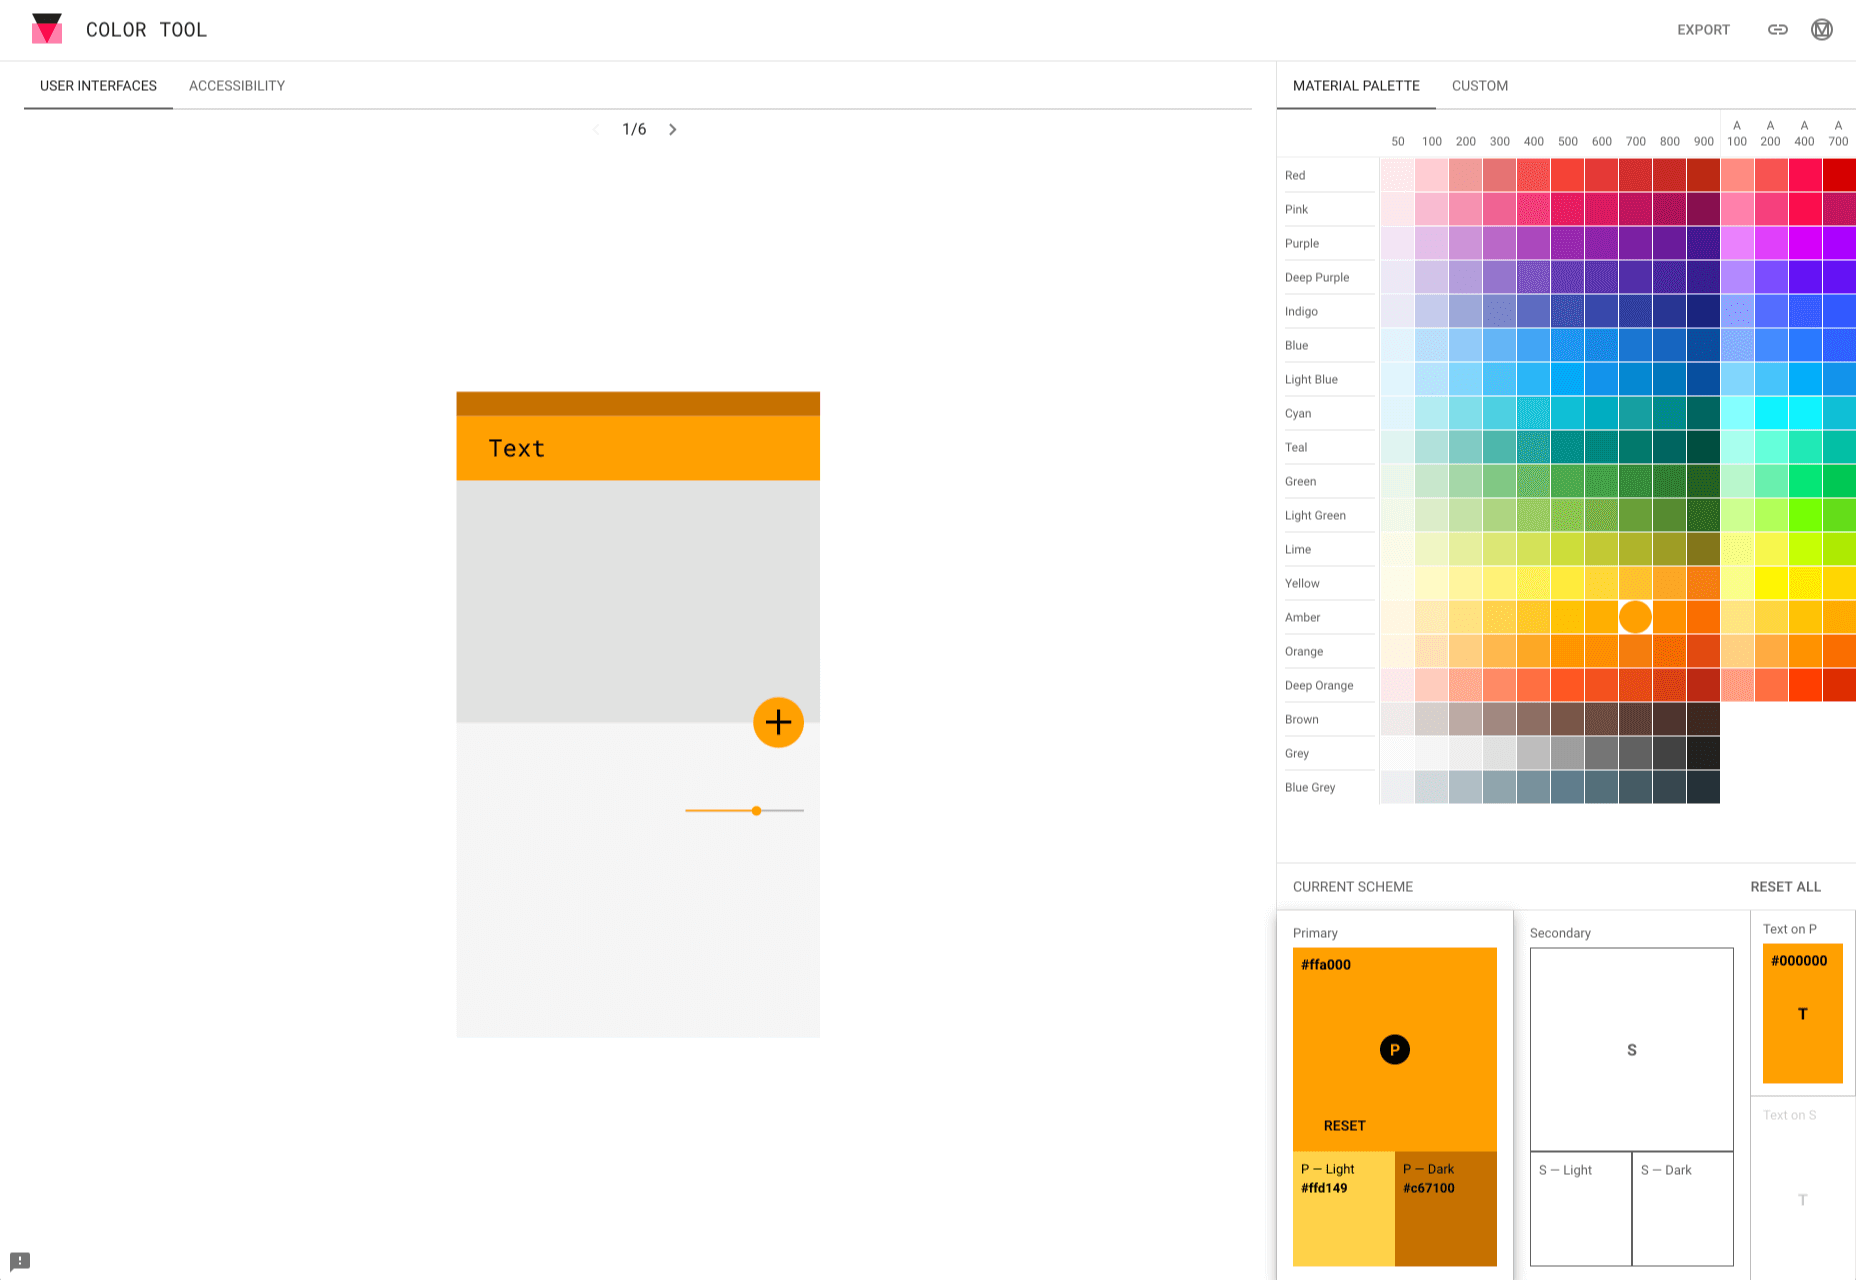
Color Tool makes it easy for web designers to create, share, and apply colors to their UI. It also measures the accessibility level for any color combination before exporting to the palette. The tool comes with 6 user interfaces and offers over 250 colors to choose from. 

The tool is also very easy to use. All you need to do is pick a color and apply it to the primary color scheme; switch to the secondary color scheme, and pick another color. You can also switch to Custom to pick your own colors. After you have selected all your colors, use the Accessibility feature to check if all is good before exporting it to your palette. 

9. Workbox

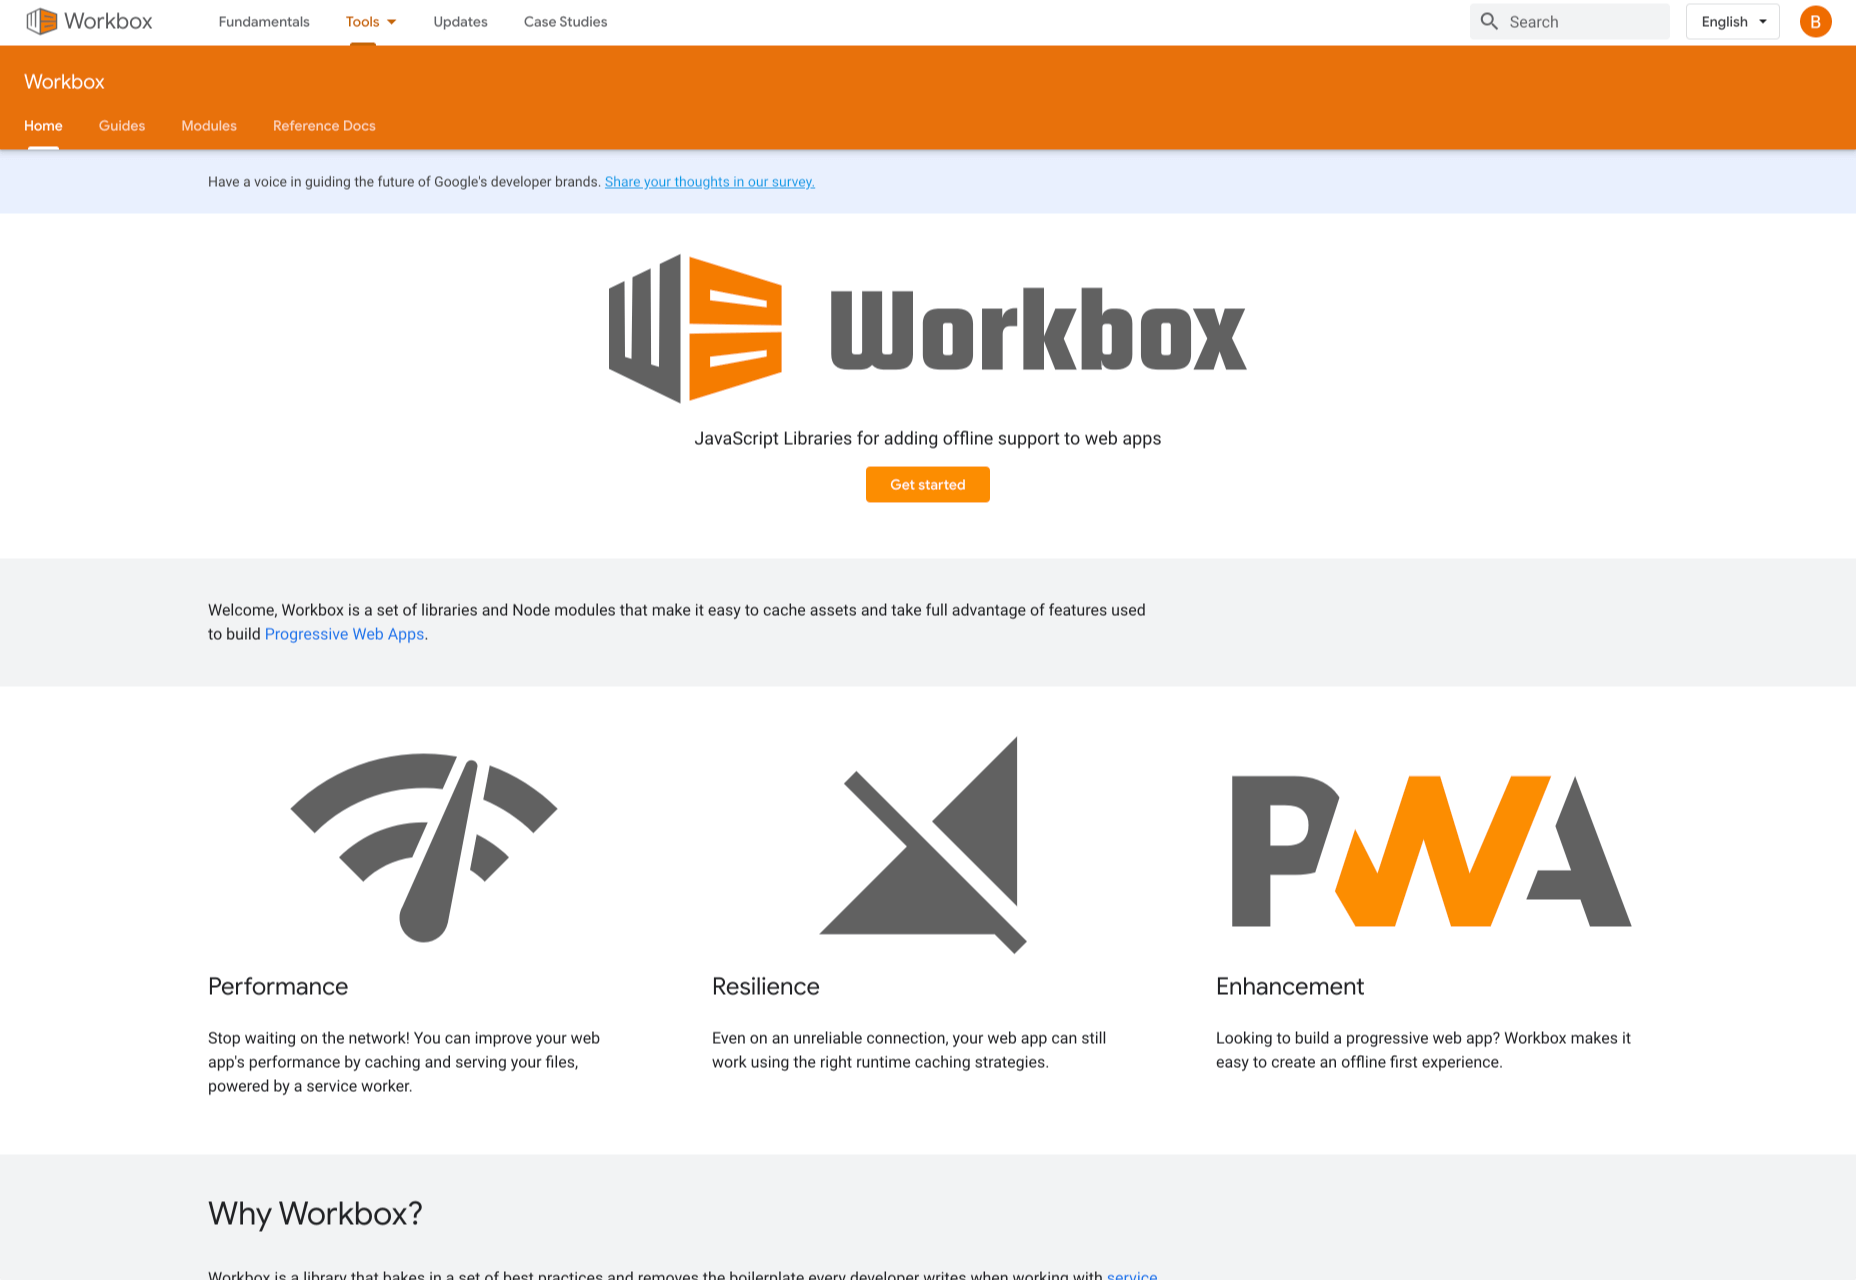
Workbox is a set of JavaScript libraries and Node modules. The JavaScript libraries make it easy to add offline support to web apps. The Node modules make it easy to cache assets and offer other features to help users build Progressive Web Apps. Some of these features include pre-caching, runtime caching, request routing, background sync, debugging, and greater flexibility than sw-precache and sw-toolbox. 

With Workbox, you can add a quick rule that enables you to cache Google fonts, images, JavaScript, and CSS files. Caching these files will make your web page to run faster and also consume less storage. You can also pre-cache your files in your web app using their CLI, Node module, or webpack plugin. 

10. PageSpeed Insights

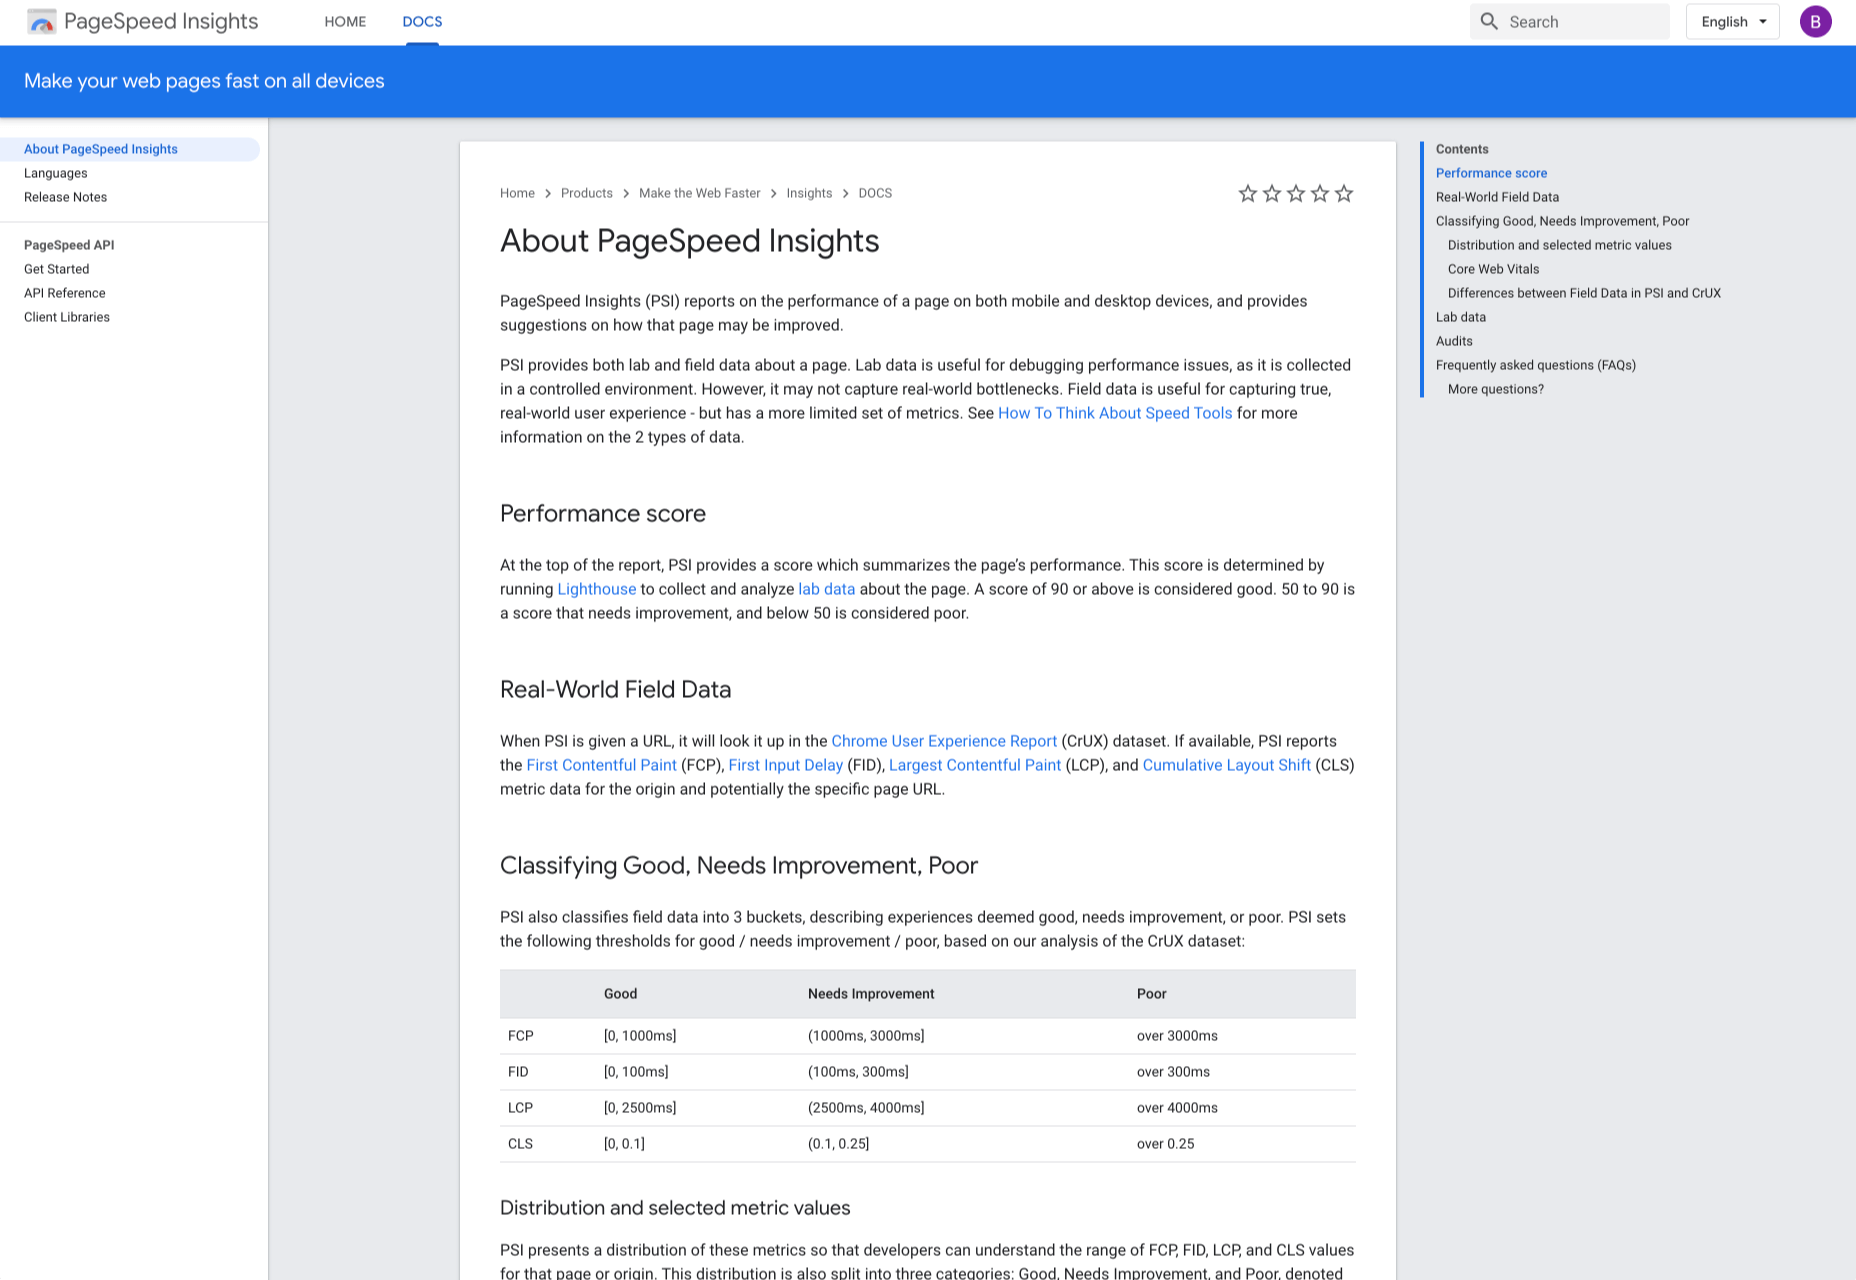
PageSpeed Insights is a handy tool from Google Developers that analyzes the content of a web page, then generates suggestions on how to make the page faster. It gives reports on the performance of a web page on both desktop and mobile devices. At the top of the report, PageSpeed Insights provides a score that summarizes the page’s performance. 

11. AMP on Google

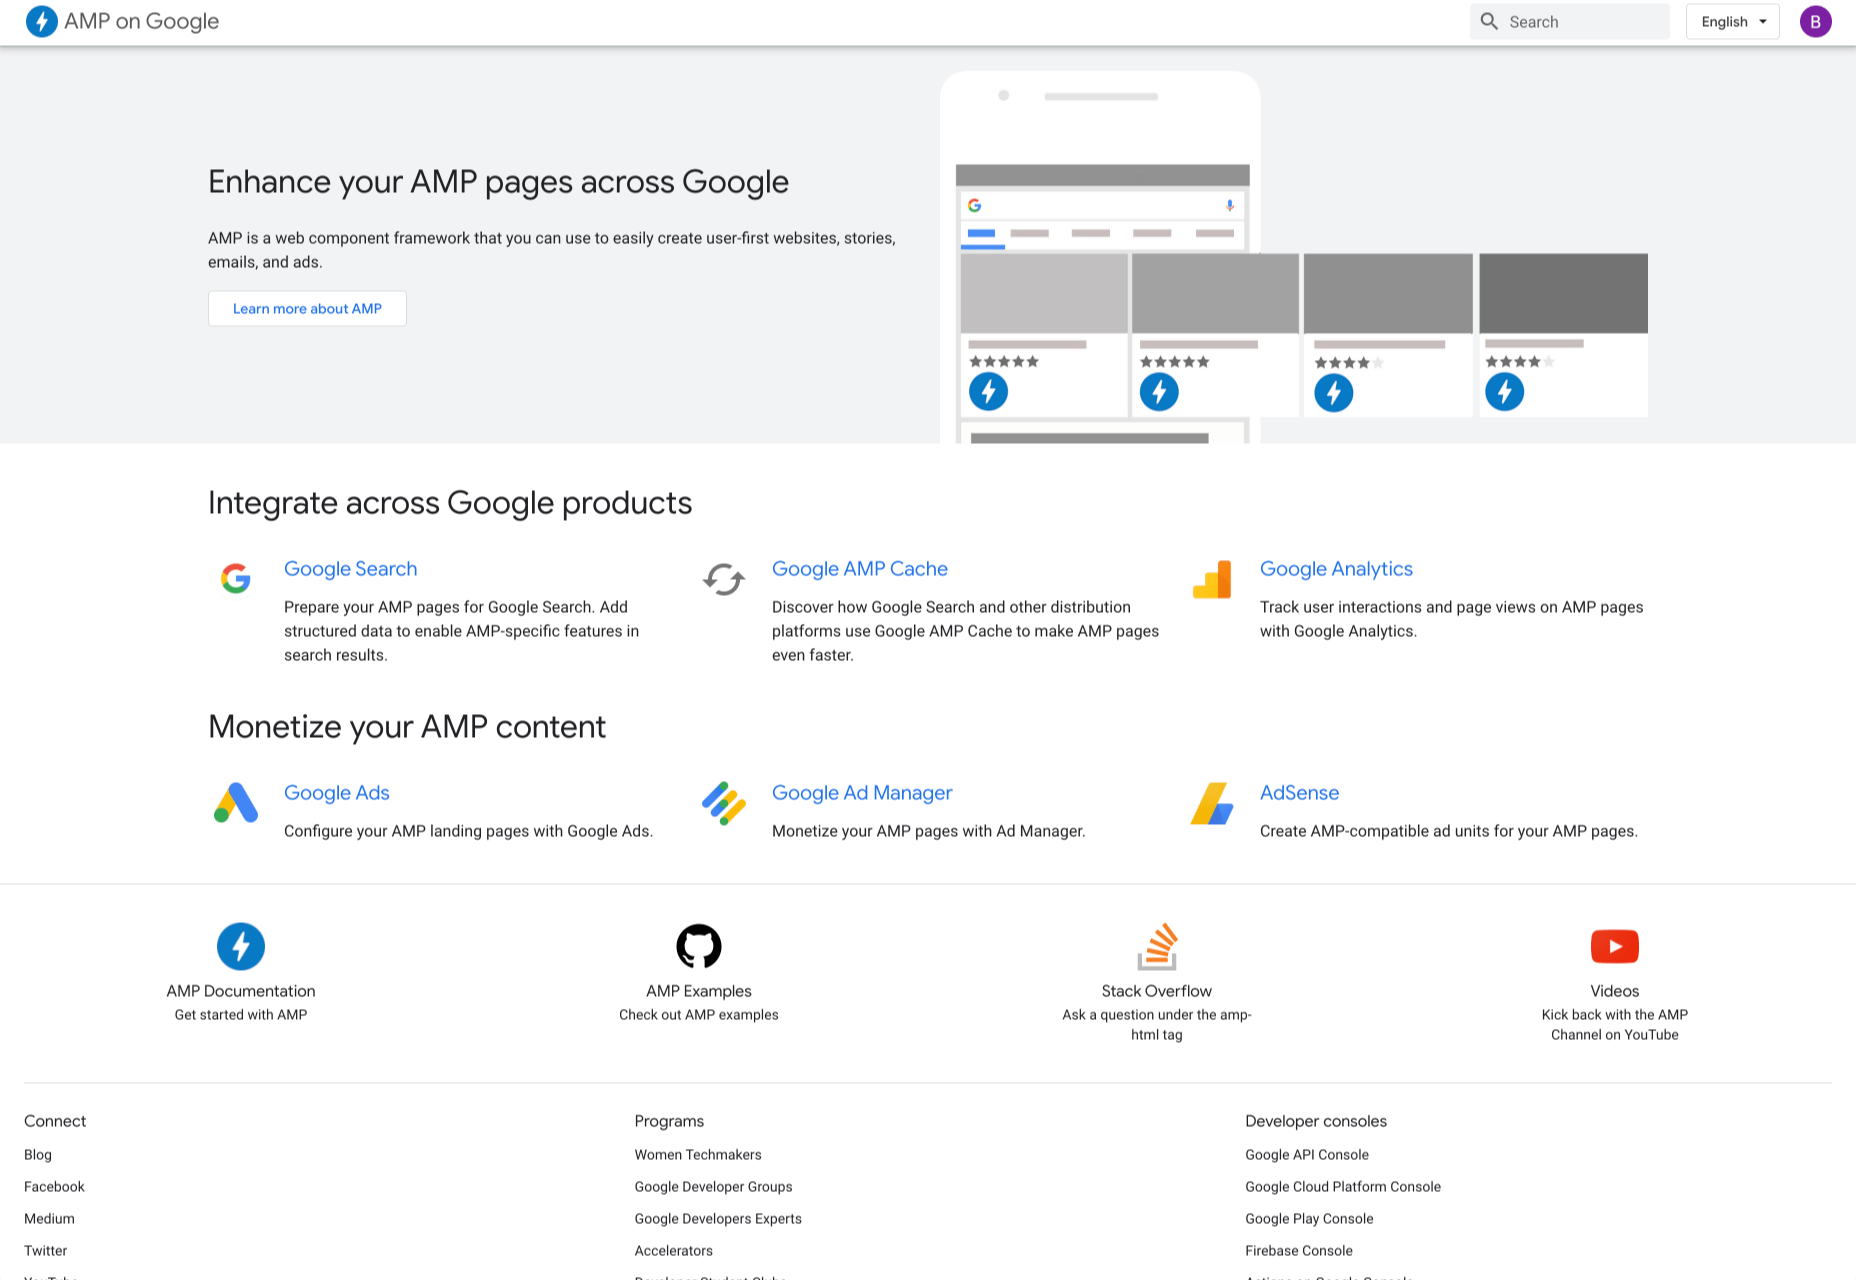
AMP pages load faster and also look better than standard HTML pages on mobile devices. AMP on Google allows you to enhance your AMP pages across Google. It is a web component framework that allows you to create user-first websites, ads, emails, and stories. One benefit of AMP is that it allows your web pages to load almost instantly across all devices and platforms hence improving the user’s experience. 
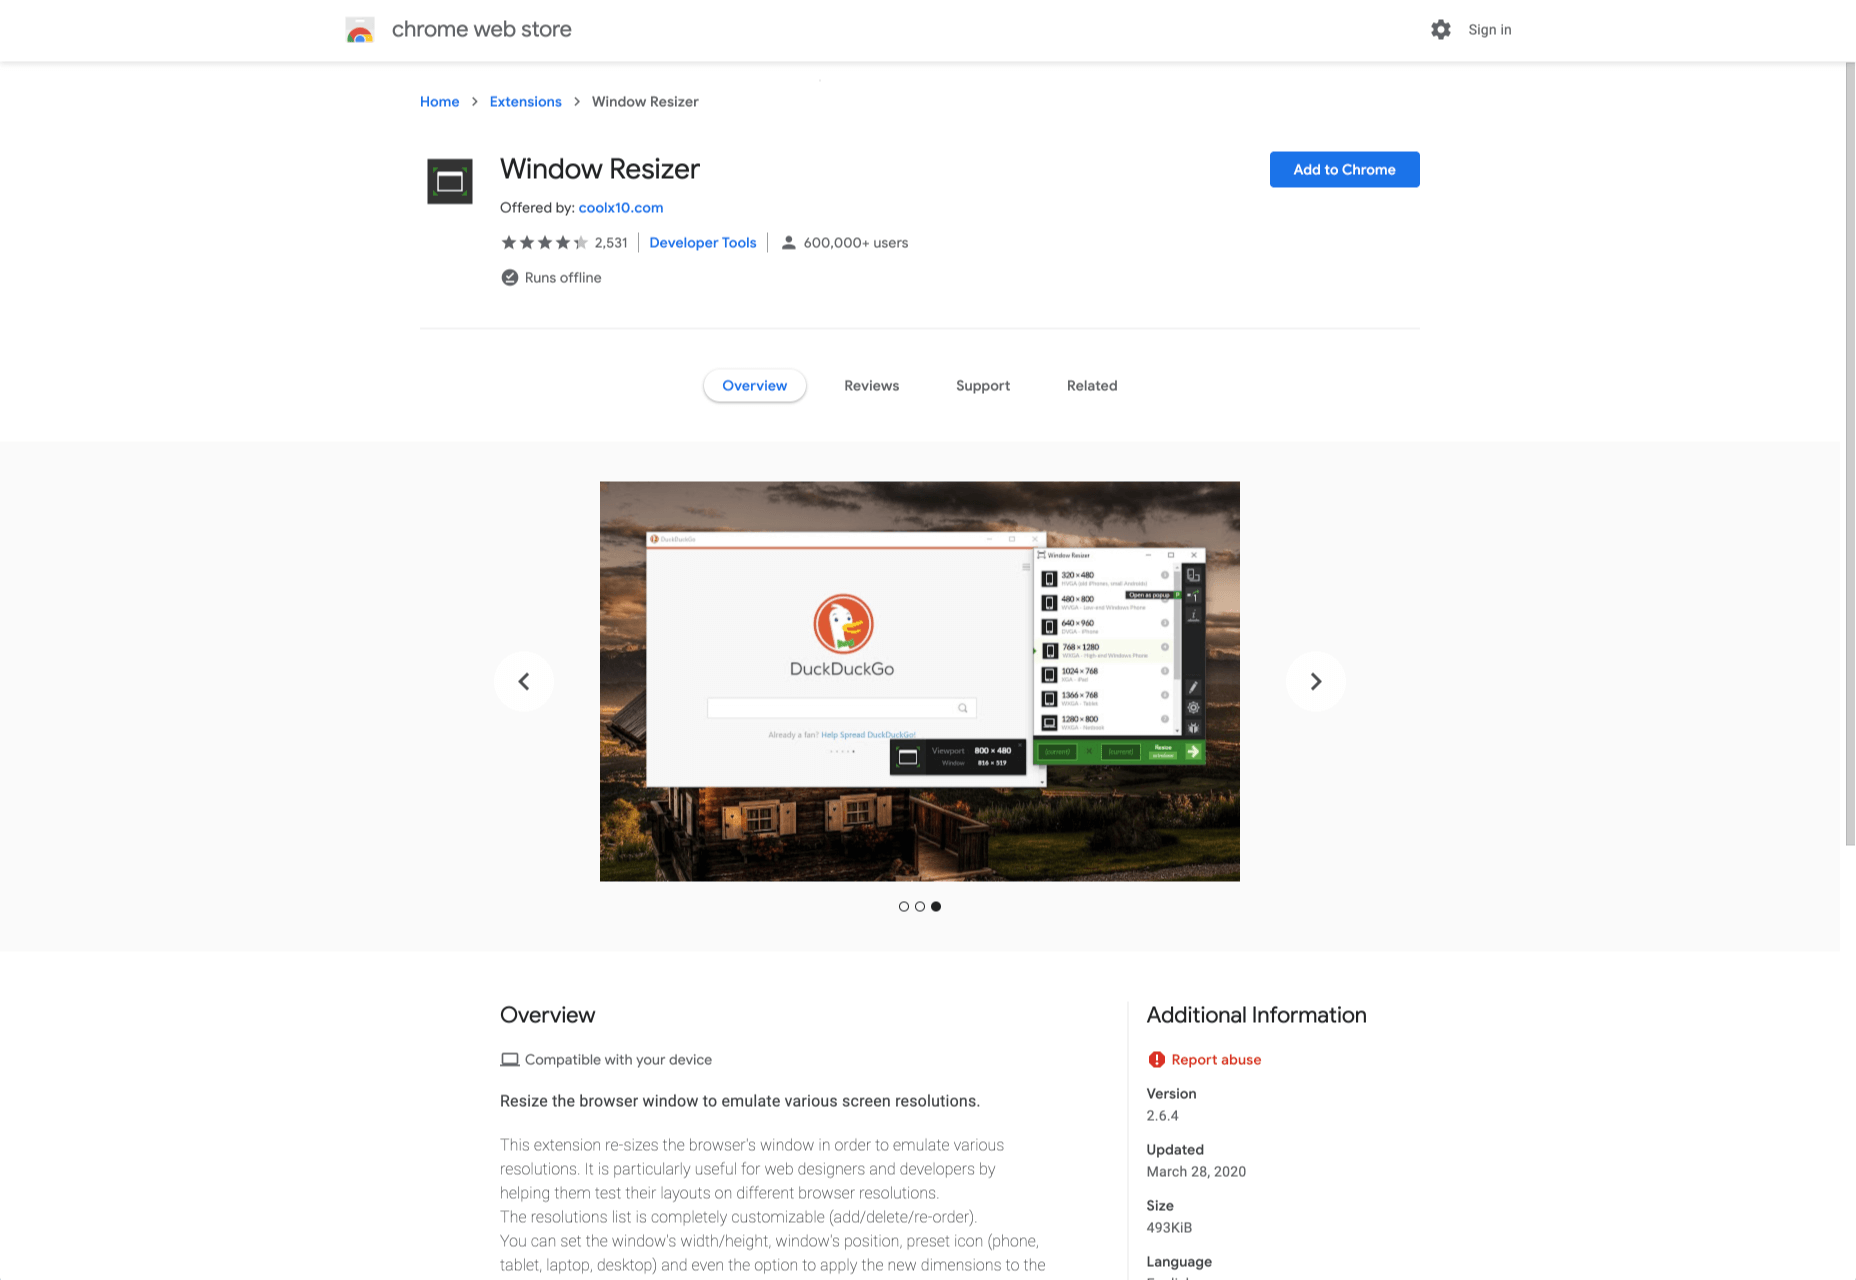
12. Window Resizer

When creating websites, it is important that developers test them for responsive design – this is where Window Resizer comes in. Window Resizer is a Chrome extension that resizes the browser window so that you can test your responsive design on different screen resolutions. The common screen sizes offered are desktop, laptop, and mobile, but you can also add custom screen sizes. 


Featured image via Unsplash.

Source


Source de l’article sur Webdesignerdepot

Whether it’s heart rate tracking or a reminder to take medicine, the Internet of Things (IoT) has brought a new revolution in the healthcare industry. IoT is bridging the gap between doctors, healthcare facilities and patients by allowing them to connect remotely.

Grand View Research revealed that the global IoT in the healthcare market is expected to reach $534.3 billion by 2025, expanding at a CAGR of 19.9% over the forecast period. From personal fitness tracking products to remote monitoring applications and surgical robots, IoT has the potential to bring innovation to the healthcare ecosystem.

Source de l’article sur DZONE