Articles

Thread debugging has the reputation of being one of the most arduous tasks for developers. I beg to differ. Asynchronous debugging is so much worse. It’s supposed to solve threading problems, and to some degree, async helps… But it doesn’t make debugging simpler. I will get into that in the next post.

Today we’ll discuss the process of debugging threading issues and dealing with deadlocks and race conditions in the debugger.

Source de l’article sur DZONE

Scraping websites built for modern browsers is far more challenging than it was a decade ago. jsoup is a convenient API that makes scraping websites trivial via DOM traversal, CSS Selectors, JQuery-Like methods, and more. But it isn’t without its caveat. Every scraping API is a ticking time bomb.

Real-world HTML is flaky. It changes without notice since it isn’t a documented API. When our Java program fails in scraping, we’re suddenly stuck with a ticking time bomb. In some cases, this is a simple issue that we can reproduce locally and deploy. But some nuanced changes in the DOM tree might be harder to observe in a local test case. In those cases, we need to understand the problem in the parse tree before pushing an update. Otherwise, we might have a broken product in production.

Source de l’article sur DZONE

With microservices architecture becoming the de facto standard for web applications now, effective debugging and anomaly detection calls for a system that is observable — which means, the internal state of an application can be inferred by observing and tracking the metrics, traces, and logs.

Observability is all about data exposure and easy access to information required to find issues when the communications fail, internal events do not occur as expected or events occur when they shouldn’t. Here, you’ll learn and know about different microservices monitoring tools and how to monitor microservices. Let’s take a look!

Source de l’article sur DZONE

When we build a microservice architecture and the number of services keeps growing, we face the problem of debugging and tracing requests through our entire system. What happened when a user got a 500 error on his request? What service incorrectly processed his request? All these questions can be solved by the Distributed Tracing System. Let’s take Spring Cloud Sleuth as an example.

How Spring Cloud Sleuth Works

To trace a request through a distributed system, the concepts TraceID and SpanID are introduced. TraceID is generated when a request enters our system and remains unchanged throughout its path. SpanID changes as the request passes from one service to another. If necessary, it is possible to generate new spans within one service to distinguish business processes.

Source de l’article sur DZONE

Symbolization is a technique that allows you to translate machine memory addresses to human-readable symbol information (symbols).

Why do we need to read what programs do anyways? We usually do not need to translate everything to a human-readable format when things run smoothly. But when things go south, we need to understand what is going on under the hood. Symbolization is needed by introspection tools like debuggers, profilers, core dumps, or any other program that needs to trace the execution of another program. While a target program is executing on a machine, these types of programs capture the stack traces of the program that is being executed.

Source de l’article sur DZONE

With the widespread acceptance of web standards, and the resulting deprecation of browser prefixes, there has been a noticeable change in the browser market. Where once browser manufacturers would try to lure users in with promises of feature support, now the focus is on privacy, speed, and developer tools.

When it comes to web development, you should really be testing on every browser and device you can lay your hands on; you’re probably already doing so using an app like LambdaTest, or BrowserStack.

When quality assurance testing, you probably work by market share: starting with Safari on mobile, Chrome on desktop, and working your way down to Opera and (if you’re a glutton for punishment) Yandax; naturally, when testing, it’s the largest number of users that concerns us the most.

But before you reach the QA stage, there are a number of browsers designed to assist development. Browsers that offer tools, especially for front-end developers, that assist with code and speed up development. Here are the best browsers for web development in 2021:

1. LT Browser

LT Browser is an app for web developers from LambdaTest. Like many of the apps in this class, it offers side-by-side comparisons of a site in different viewports. Additionally, LT Browser has a number of features that make it stand out.

As well as previewing web pages, LT Browser offers developer tools to rival Chrome, which is handy if you want to see how changes across different devices affect your Lighthouse scores. LT Browser also supports hot-reloading, which means when you make a change to your code, you don’t have to hit ‘refresh,’ the viewports simply reload — it’s surprising how much of a time-saver that simple addition is.

LT Browser requires a LambdaTest account, there is a free plan, and paid plans start at $15/month.

2. Firefox Developer

The best conventional browser for web development in 2021 is the developer edition of Mozilla’s Firefox.

The standard edition of Firefox is an excellent browser, packed with features, and privacy-focused. The developer edition adds to this with a suite of tools aimed at developers. The CSS and JavaScript debugging tools are superb, and the Grid tools are unparalleled for coding layouts with CSS Grid.

Firefox Developer is free to download.

3. Polypane

Polypane is one of the new generation of web browsers that are firmly intended as development aids rather than browsers. Polypane allows you to compare different viewports and platforms by placing them side by side. Interactions like scrolling are synced.

Polypane takes a step further than many browser apps in this class by showing social media previews. It even has a suite of accessibility tools, including some handy color blindness simulators.

Polypane has a 14-day free trial, and plans start at $8/month.
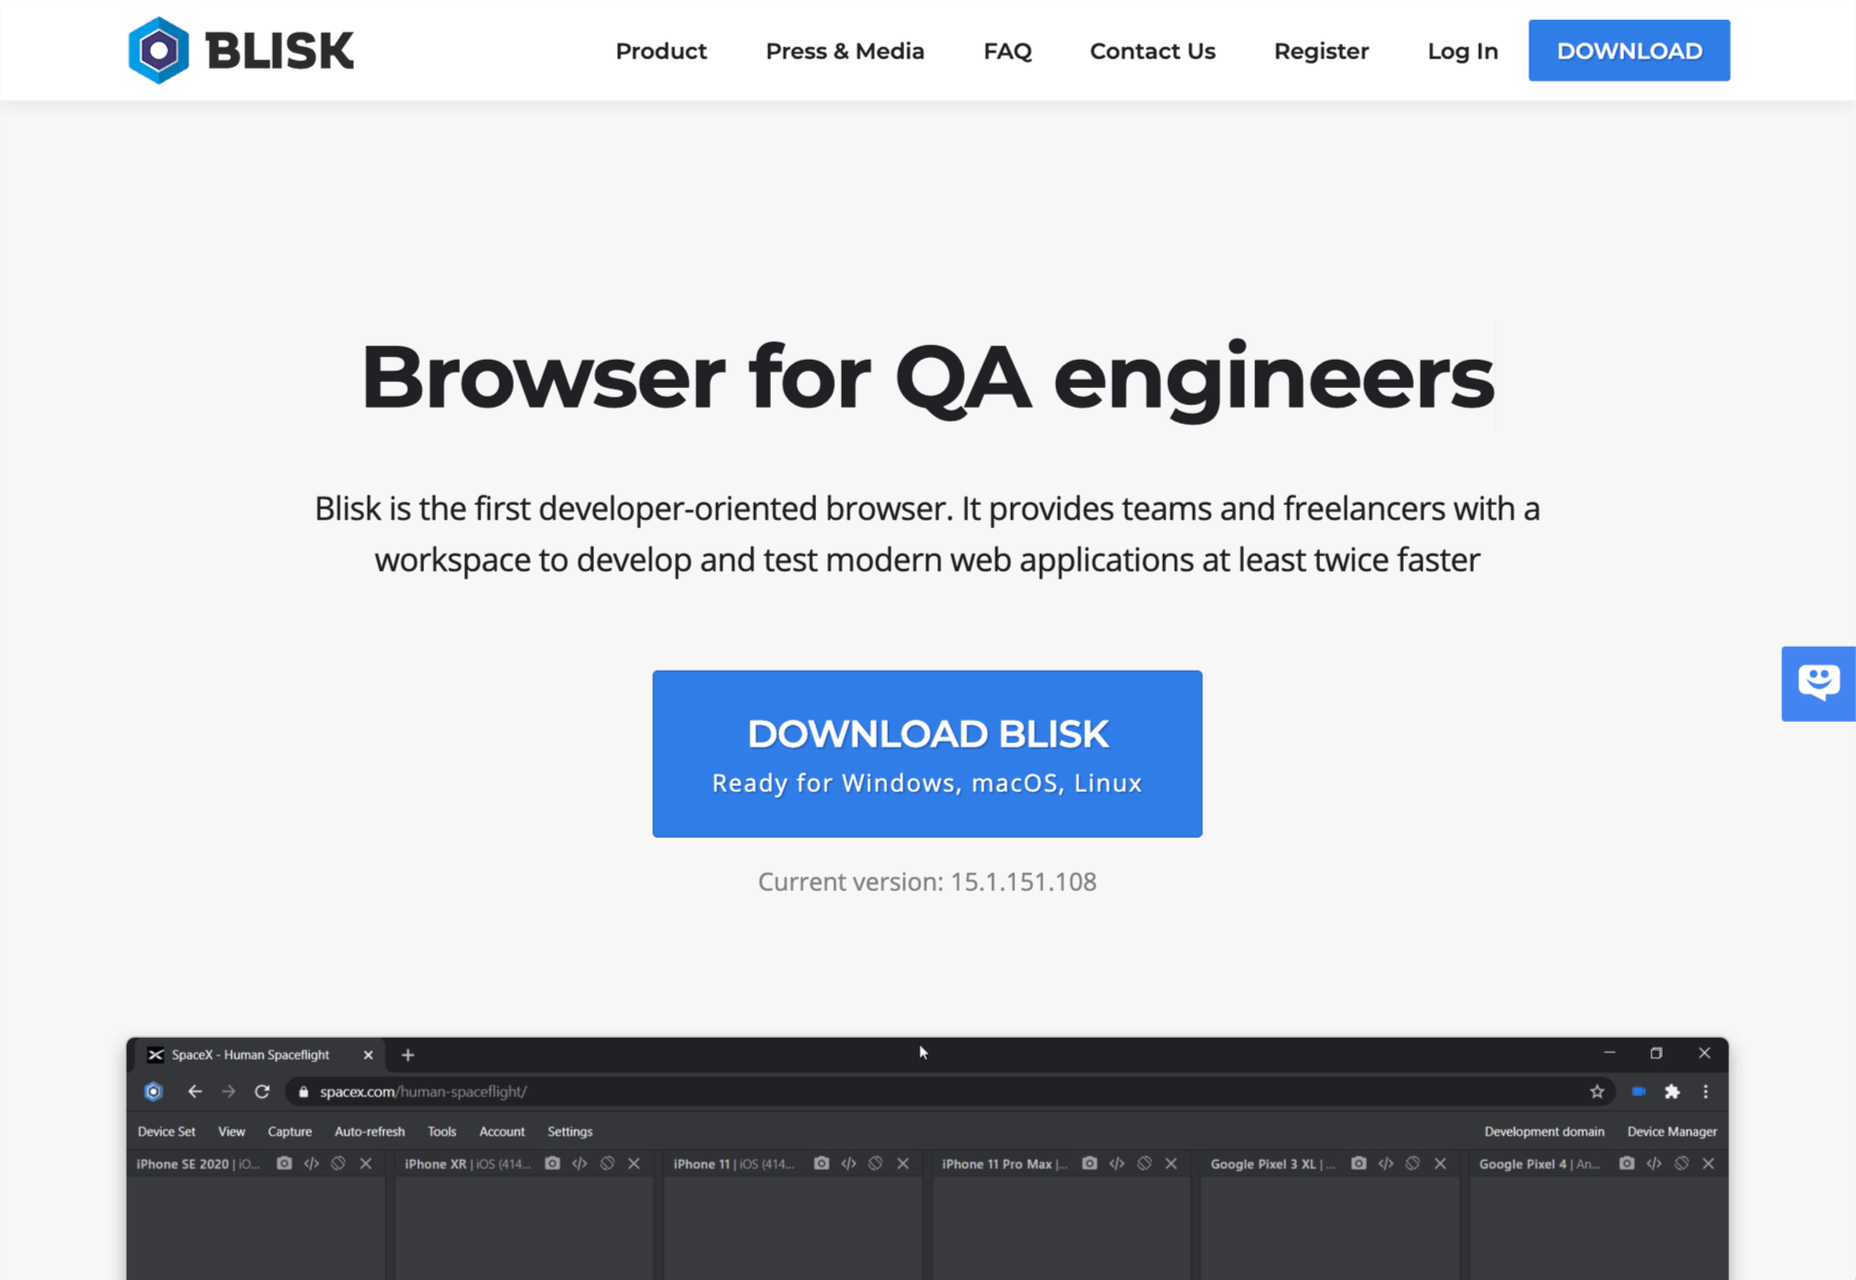
4. Blisk

Blisk is another browser for developers that allows you to line up a collection of viewports in a single app. URL and scrolling are synced, making testing interactions and animations effortless.

Blisk is awesome fun to play with and delivers a great preview of a responsive design. But be warned, synced viewports can be addictive, and it’s easy to line up browsers and become hypnotized by the synchronized movement; you’ll need a very large screen to get the most out of Blisk.

Blisk plans start at $9.99/month.

5. Sizzy

Sizzy is another app that allows you to view multiple viewports at once. It also has synchronized interactions, and like many competing apps, Sizzy allows you to screenshot different views.

Sizzy also includes a very clever synchronized inspect tool, so you can focus on individual elements across different viewports. It’s an excellent option for debugging, particularly if you’re digging into someone else’s code.

Sizzy has a 14-day free trial, and paid plans start at $7.15/month.
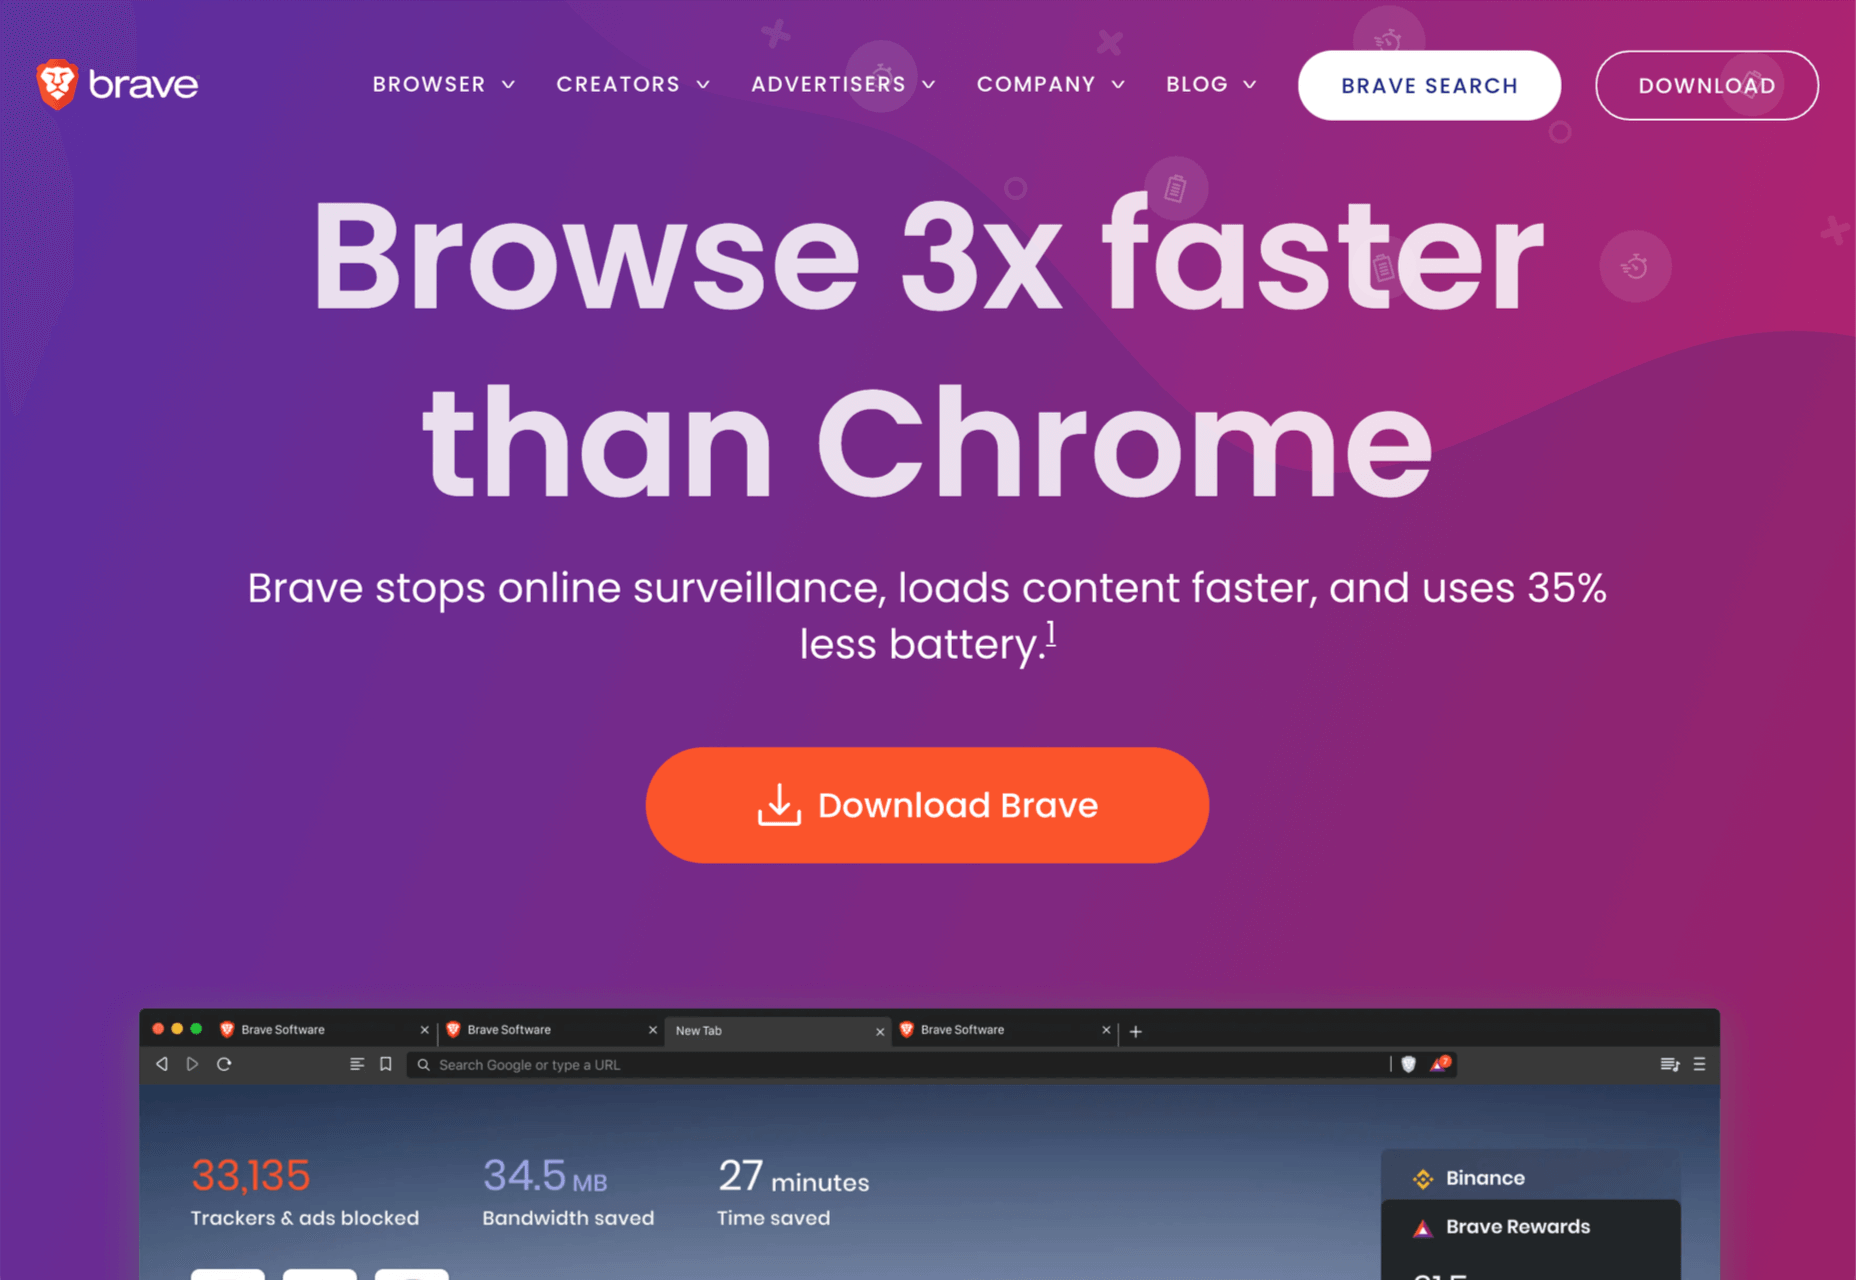
6. Brave

Brave is a privacy-focused browser that runs up to three times faster than Chrome. If you’re someone who balks at rendering speeds on most sites, Brave could be for you.

Brave’s main benefit for developers is that it supports Chrome extensions while maintaining privacy — it can even access the Web using Tor if simple privacy mode isn’t enough for you. There are hundreds of useful Chrome extensions, and if you avoid Chrome due to privacy concerns, then Brave solves your problem.

Brave is also pioneering a new system for monetizing site revenue, allowing viewers to tip sites, and soon, to control how advertising revenue is distributed.

Brave is free to download.

7. Chrome

Boring it may be, but Chrome is still the world’s most popular browser from the US to mainland China. Where once sites were “best viewed in IE,” Chrome is now the Web’s default.

No matter the site you’re designing, it has to work well in Chrome, and no simulator is as good as the real thing.

In addition to being the benchmark for page rendering, Chrome developer tools are the simplest way to access your Lighthouse scores, which helps you track down issues that may be holding you back in Google’s search results.

Chrome is free to download.

Source

The post 7 Best Browsers for Developers in 2021 first appeared on Webdesigner Depot.


Source de l’article sur Webdesignerdepot

The monitoring and alerting stack is a crucial part of the SRE practices. That’s where BotKube helps you monitor your Kubernetes cluster and send notifications to your messaging platform or any other configured sink. In this blog post, we will be configuring BotKube to watch the Kubernetes cert-manager certificates CustomResources.

What is BotKube?

BotKube is a messaging tool for monitoring and debugging Kubernetes clusters. BotKube can be integrated with multiple messaging platforms like – Slack, Mattermost, or Microsoft Teams to help you monitor your Kubernetes cluster(s), debug critical deployments, and gives recommendations for standard practices by running checks on the Kubernetes resources.

Source de l’article sur DZONE


Introduction

Ever since Patrick Debois coined the word DevOps back in 2009, teams and organizations have been clamoring to adopt relevant practices, tools, and a sense of culture in a bid to increase velocity while maintaining stability. However, this race to incorporate “DevOps” in software development practices has resulted in a perversion of the concept. This does not mean that there are no successful practices of teams adopting DevOps practices, but the word overall has become a buzzword. As per the DORA 2019 State of DevOps report, team managers are more likely to proclaim that their teams are practicing DevOps compared to the actual frontline engineers and developers.

Therefore, this piece aims to realign the meaning of DevOps as well as highlight the need for considering debugging as a core element of the practices and cultures that enable DevOps for teams. The argument for debugging as a core component in the DevOps pipeline is a result of the evident need for a shift-left in the way we build and release software, empowering developers to adhere to the intrinsic principle of you build it you run it.

Source de l’article sur DZONE

Java and the JVM more generally are widely used for services everywhere, but often challenging to debug and manually test, particularly in complicated microservice architectures.

HTTP requests and responses are the core of interactions between these services, and with their external APIs, but they’re also often invisible and inaccessible. It’s hard to examine all outgoing requests, simulate unusual responses & errors in a running system, or mock dependencies during manual testing & prototyping.

Source de l’article sur DZONE


Introduction

In this article, I will share the steps to create a plugin in nopCommerce 4.40 including debugging of plugin install-uninstall and PreparePluginToUninstall methods. To demonstrate this, I am using the visual studio 2019 version 16.9.0. NopCommerce 4.40 has been upgraded to .NET 5 & C# 9 and many other features

In this article, I will create a simple plugin with the install-uninstall without any other features. But, it’s better to understand how the nopCommerce plugin is working and how you can debug the install-uninstall method of nopCommerce. This is because if you’re going to directly develop features, it will create a small problem. So, better we understand it first. Otherwise, you are maybe facing issues like I made a change in my HTML view, but you won’t see the impact on-page.

Source de l’article sur DZONE