 Landing pages are central to successful marketing campaigns; they allow you to target particular customers with particular solutions to particular problems.
It’s easy to confuse what a landing page is because users “land” on many pages. When we talk about landing pages, we mean a page that is entirely dedicated to a particular type of customer. In fact, if we could create a unique landing page for each individual user, that would be awesome.
You might think your homepage is a landing page, but it’s not; users reach your landing page in various ways — directly, via organic search, or backlink. A landing page is normally dedicated to a specific marketing campaign. It is accessed from a link in an email, via social media, or most often via a PPC (Pay Per Click) advert.
Here are 10 elements of landing pages that are proven to convert successfully:
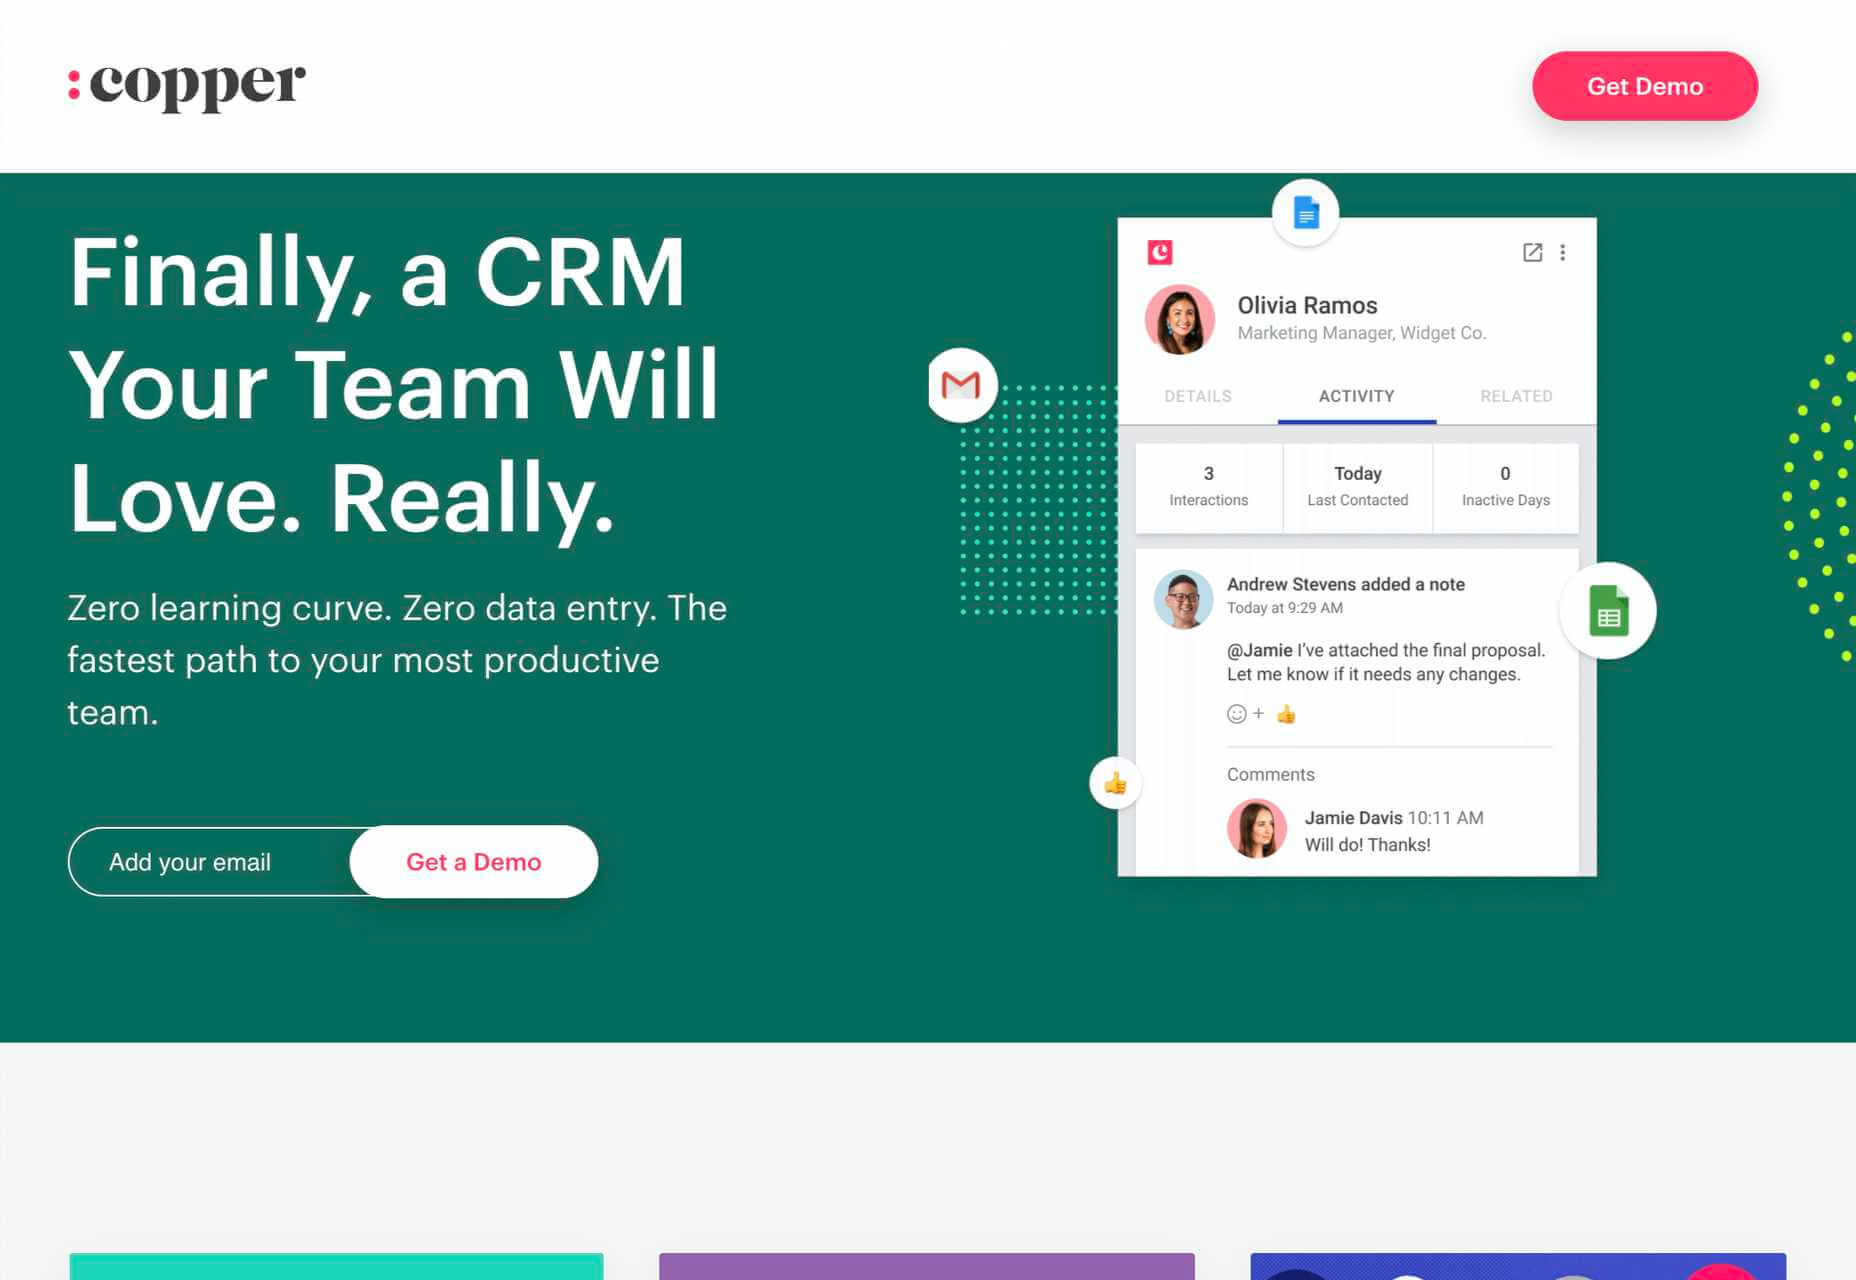
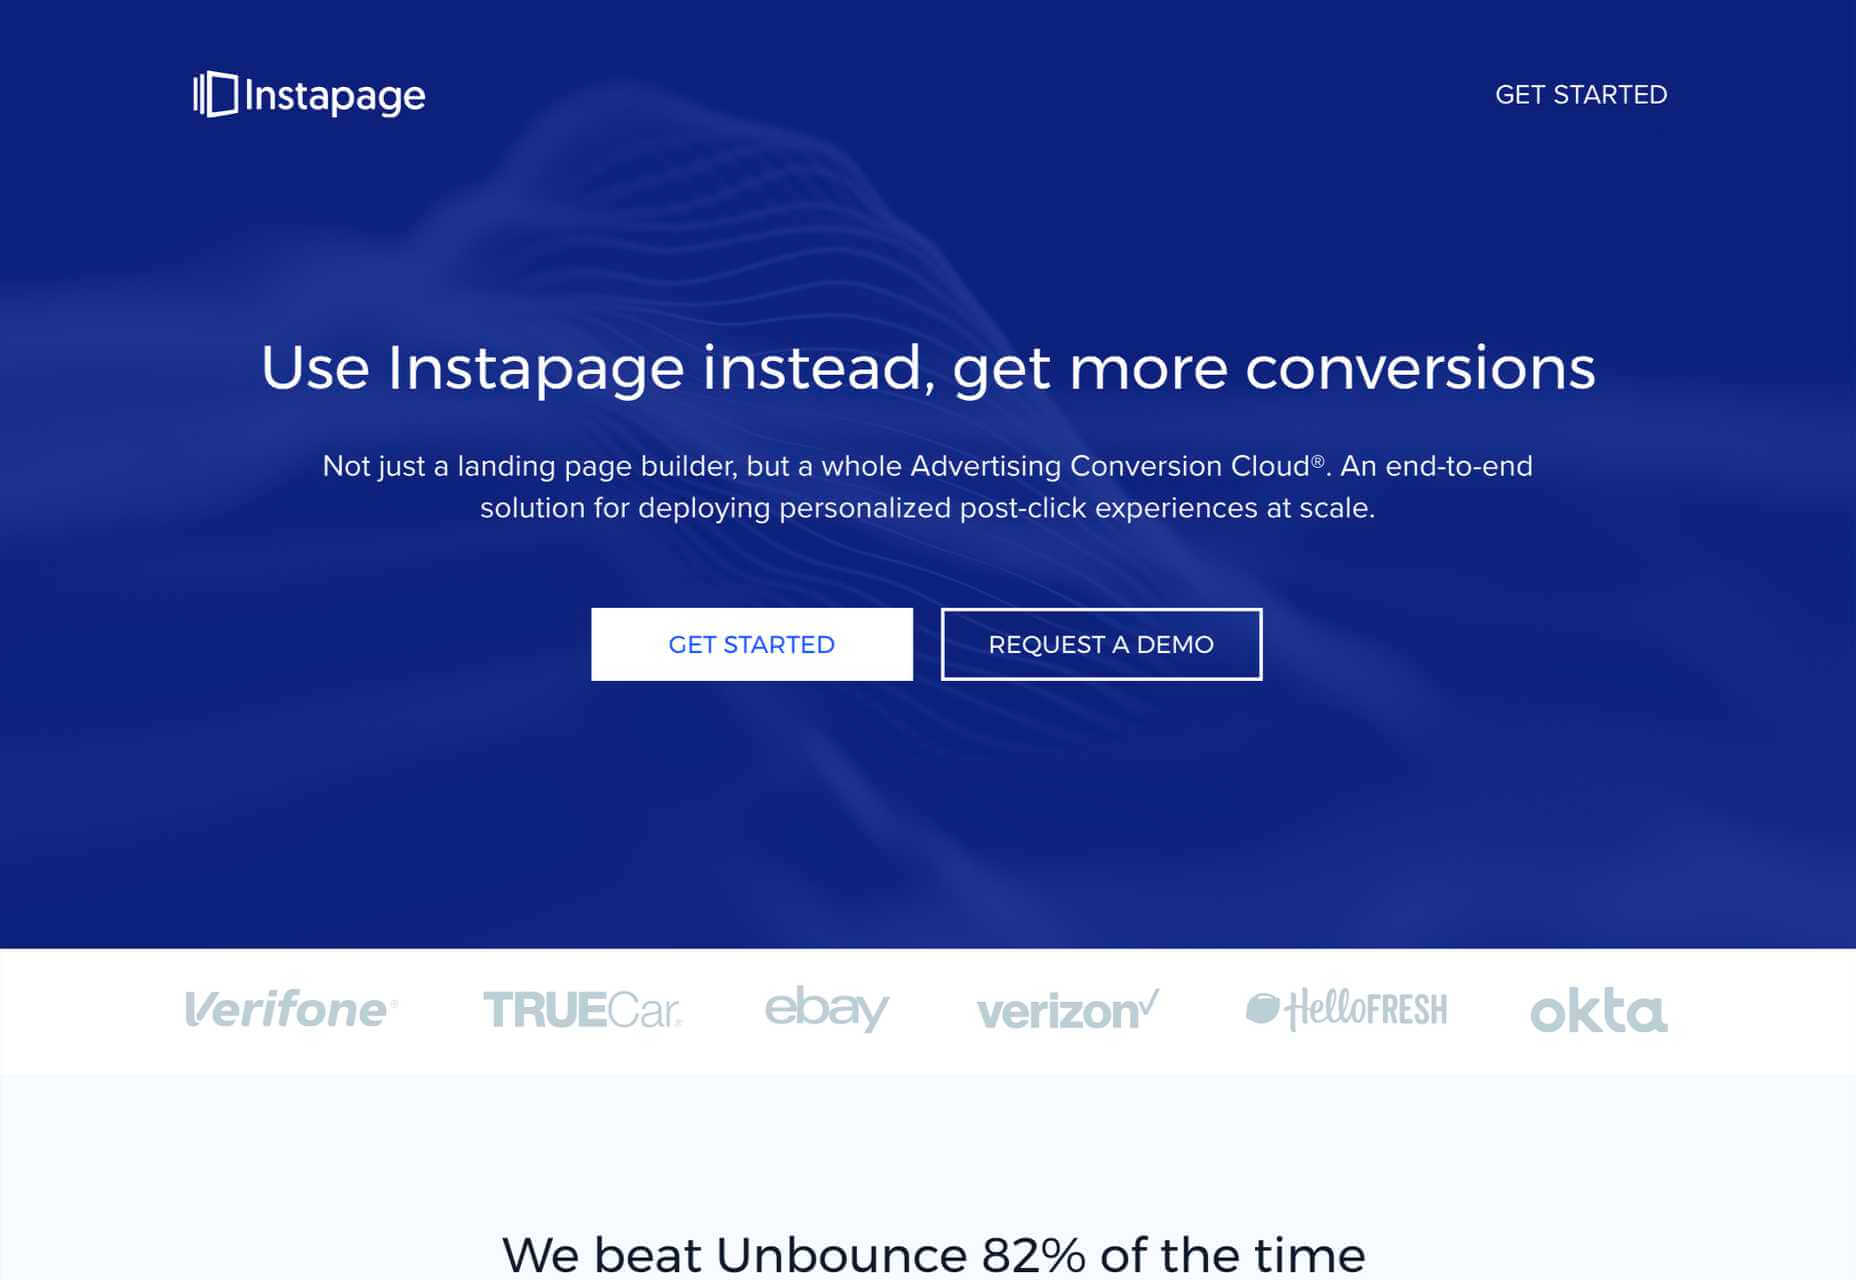
1. Use A Single Call To Action
Your potential customers must know how to move forward with your product or service as early in the experience as possible.
Are they signing up for a free trial? Are they signing up for your newsletter? Are they buying a product? Are they contacting you? Whatever you need them to do, make it clear.
The Hick-Hyman law of UX says the more choices you give a user, the less likely they are to make any choice at all; conversely, the fewer choices, the greater the likelihood that they’ll move forward.
Give the user one choice: click the button, or don’t click the button. A single CTA will out-perform multiple options.
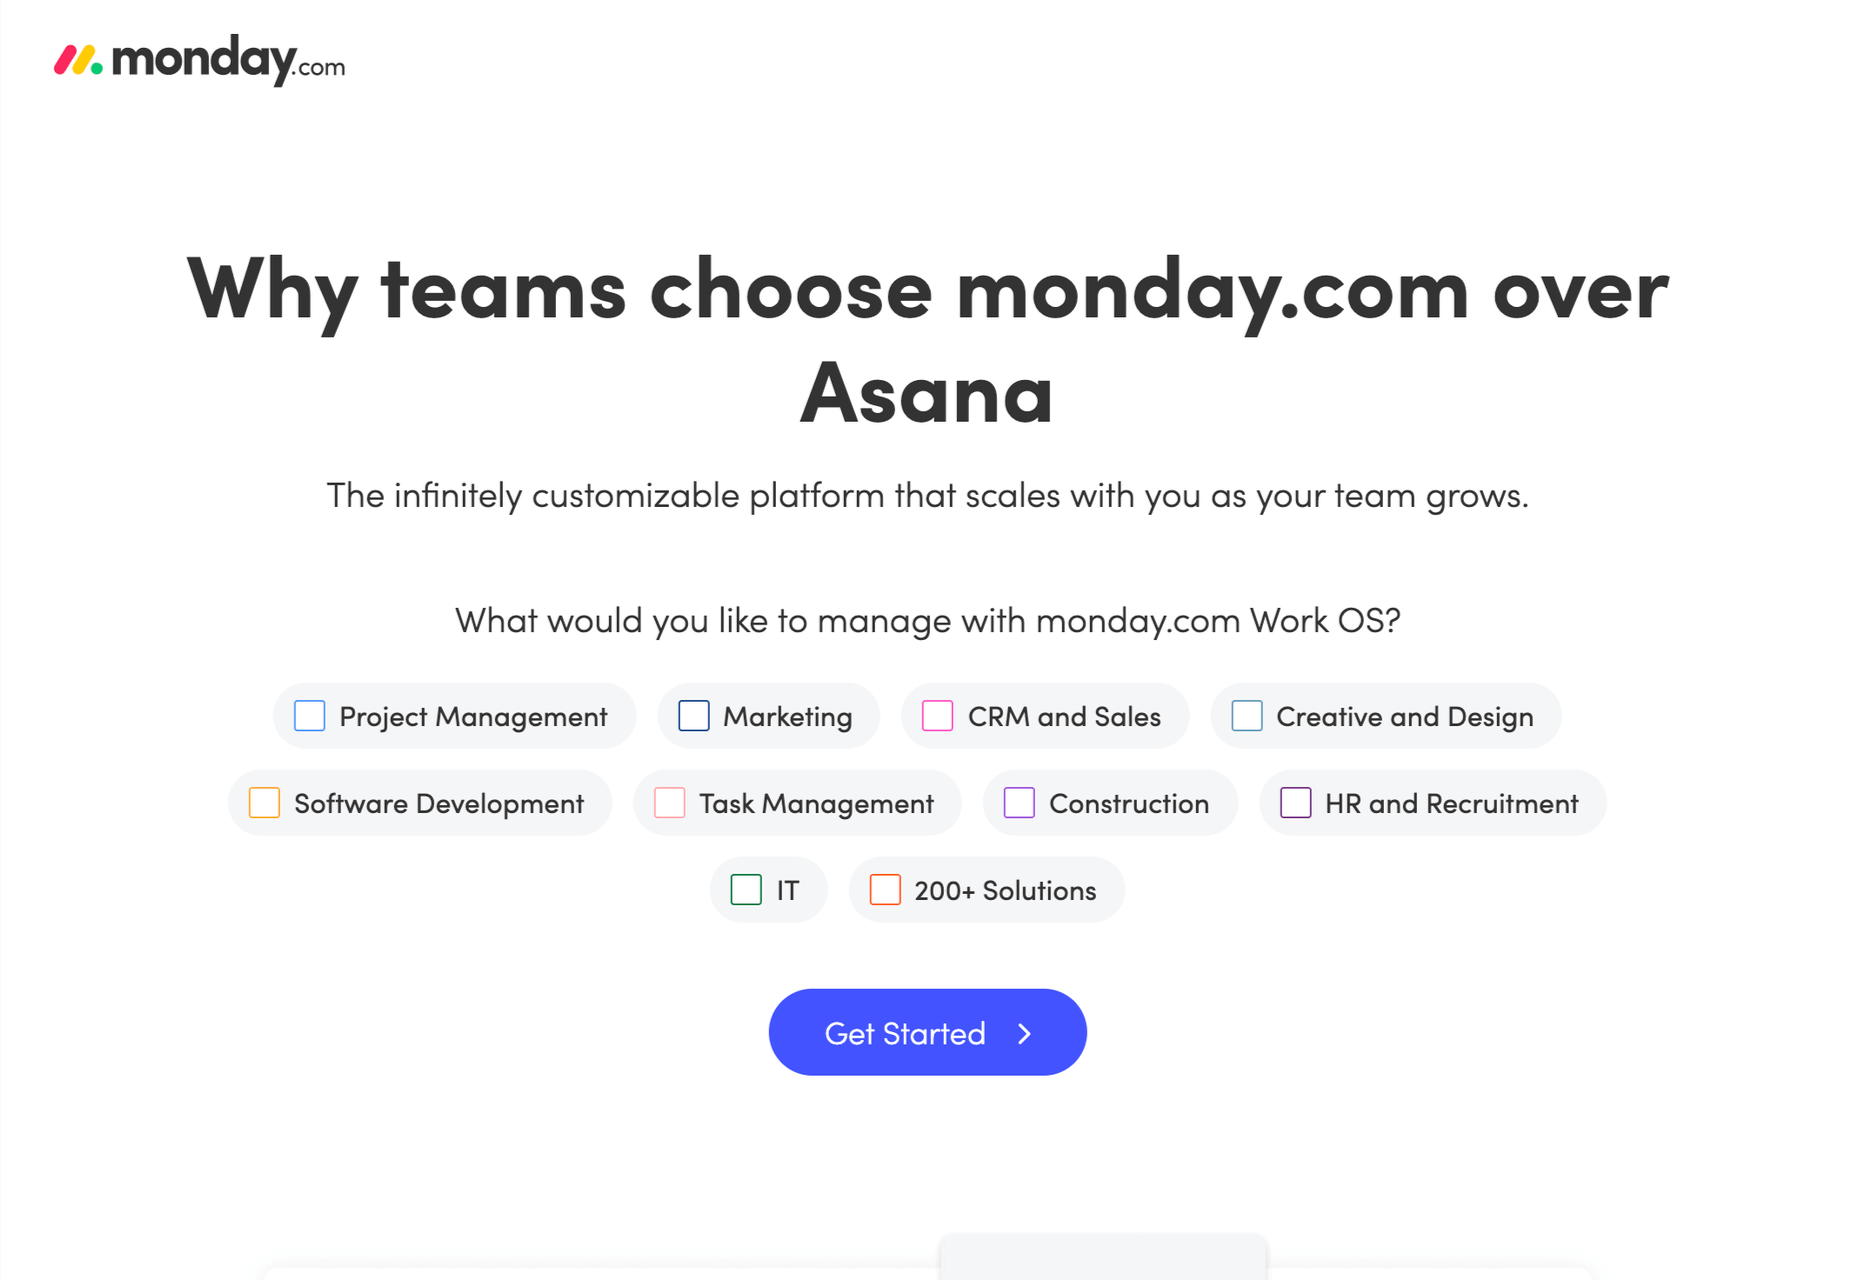
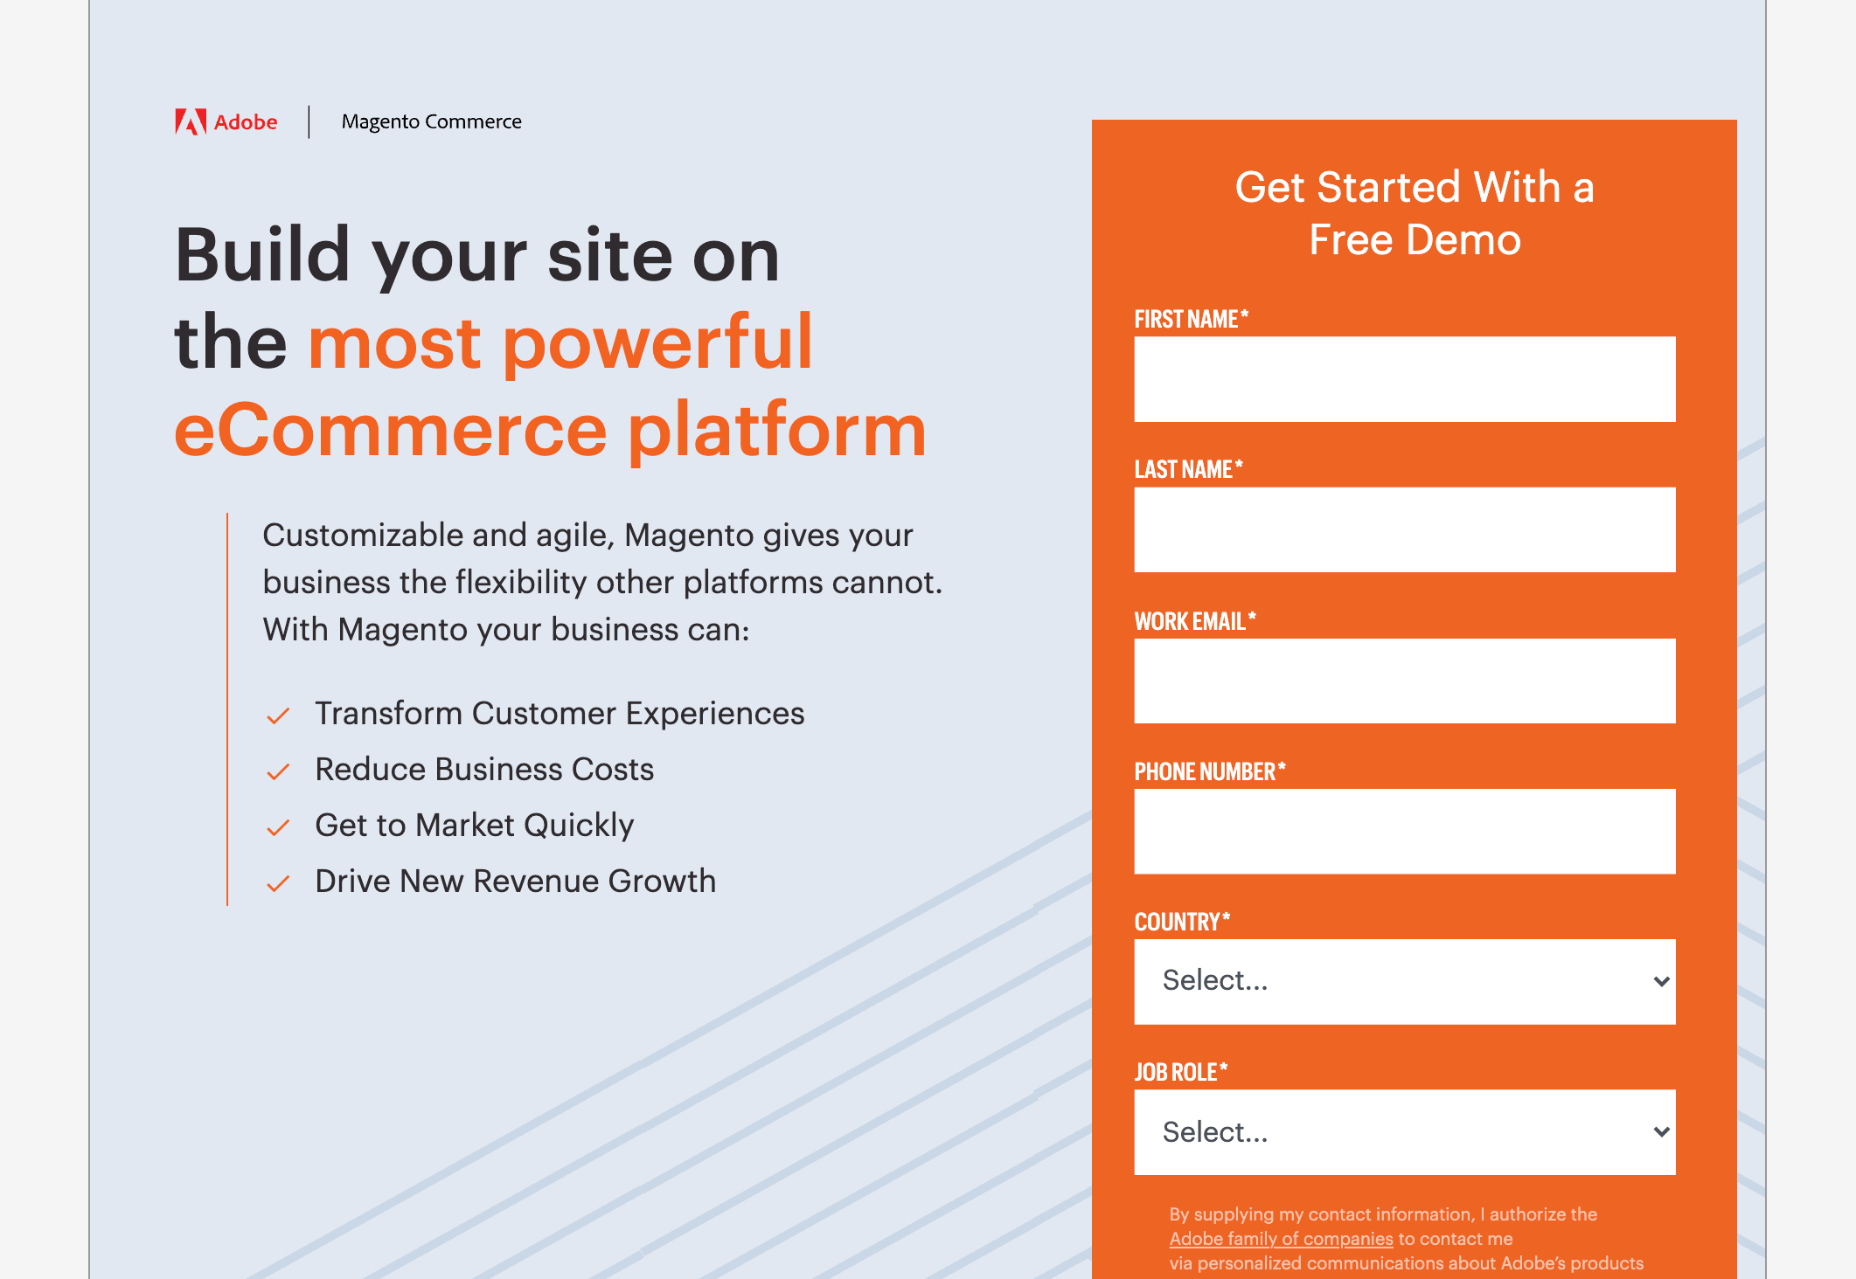
2. Keep Forms Simple
Often, your landing page will need a potential customer’s information. They might be creating an account, setting up a trial, or just joining your newsletter.
If the potential customer is signing up for a trial, by all means, ask for their email address. But you don’t need their cell number, their mother’s name, the street they grew up on, their birthday, or any of that other junk that’s used to profile users.
Whatever the purpose, keep your form ultra-simple. That means as few fields as possible. If you really want it, give the user the option to fill it in later as part of an onboarding process — when they’re already invested — but not on the landing page.
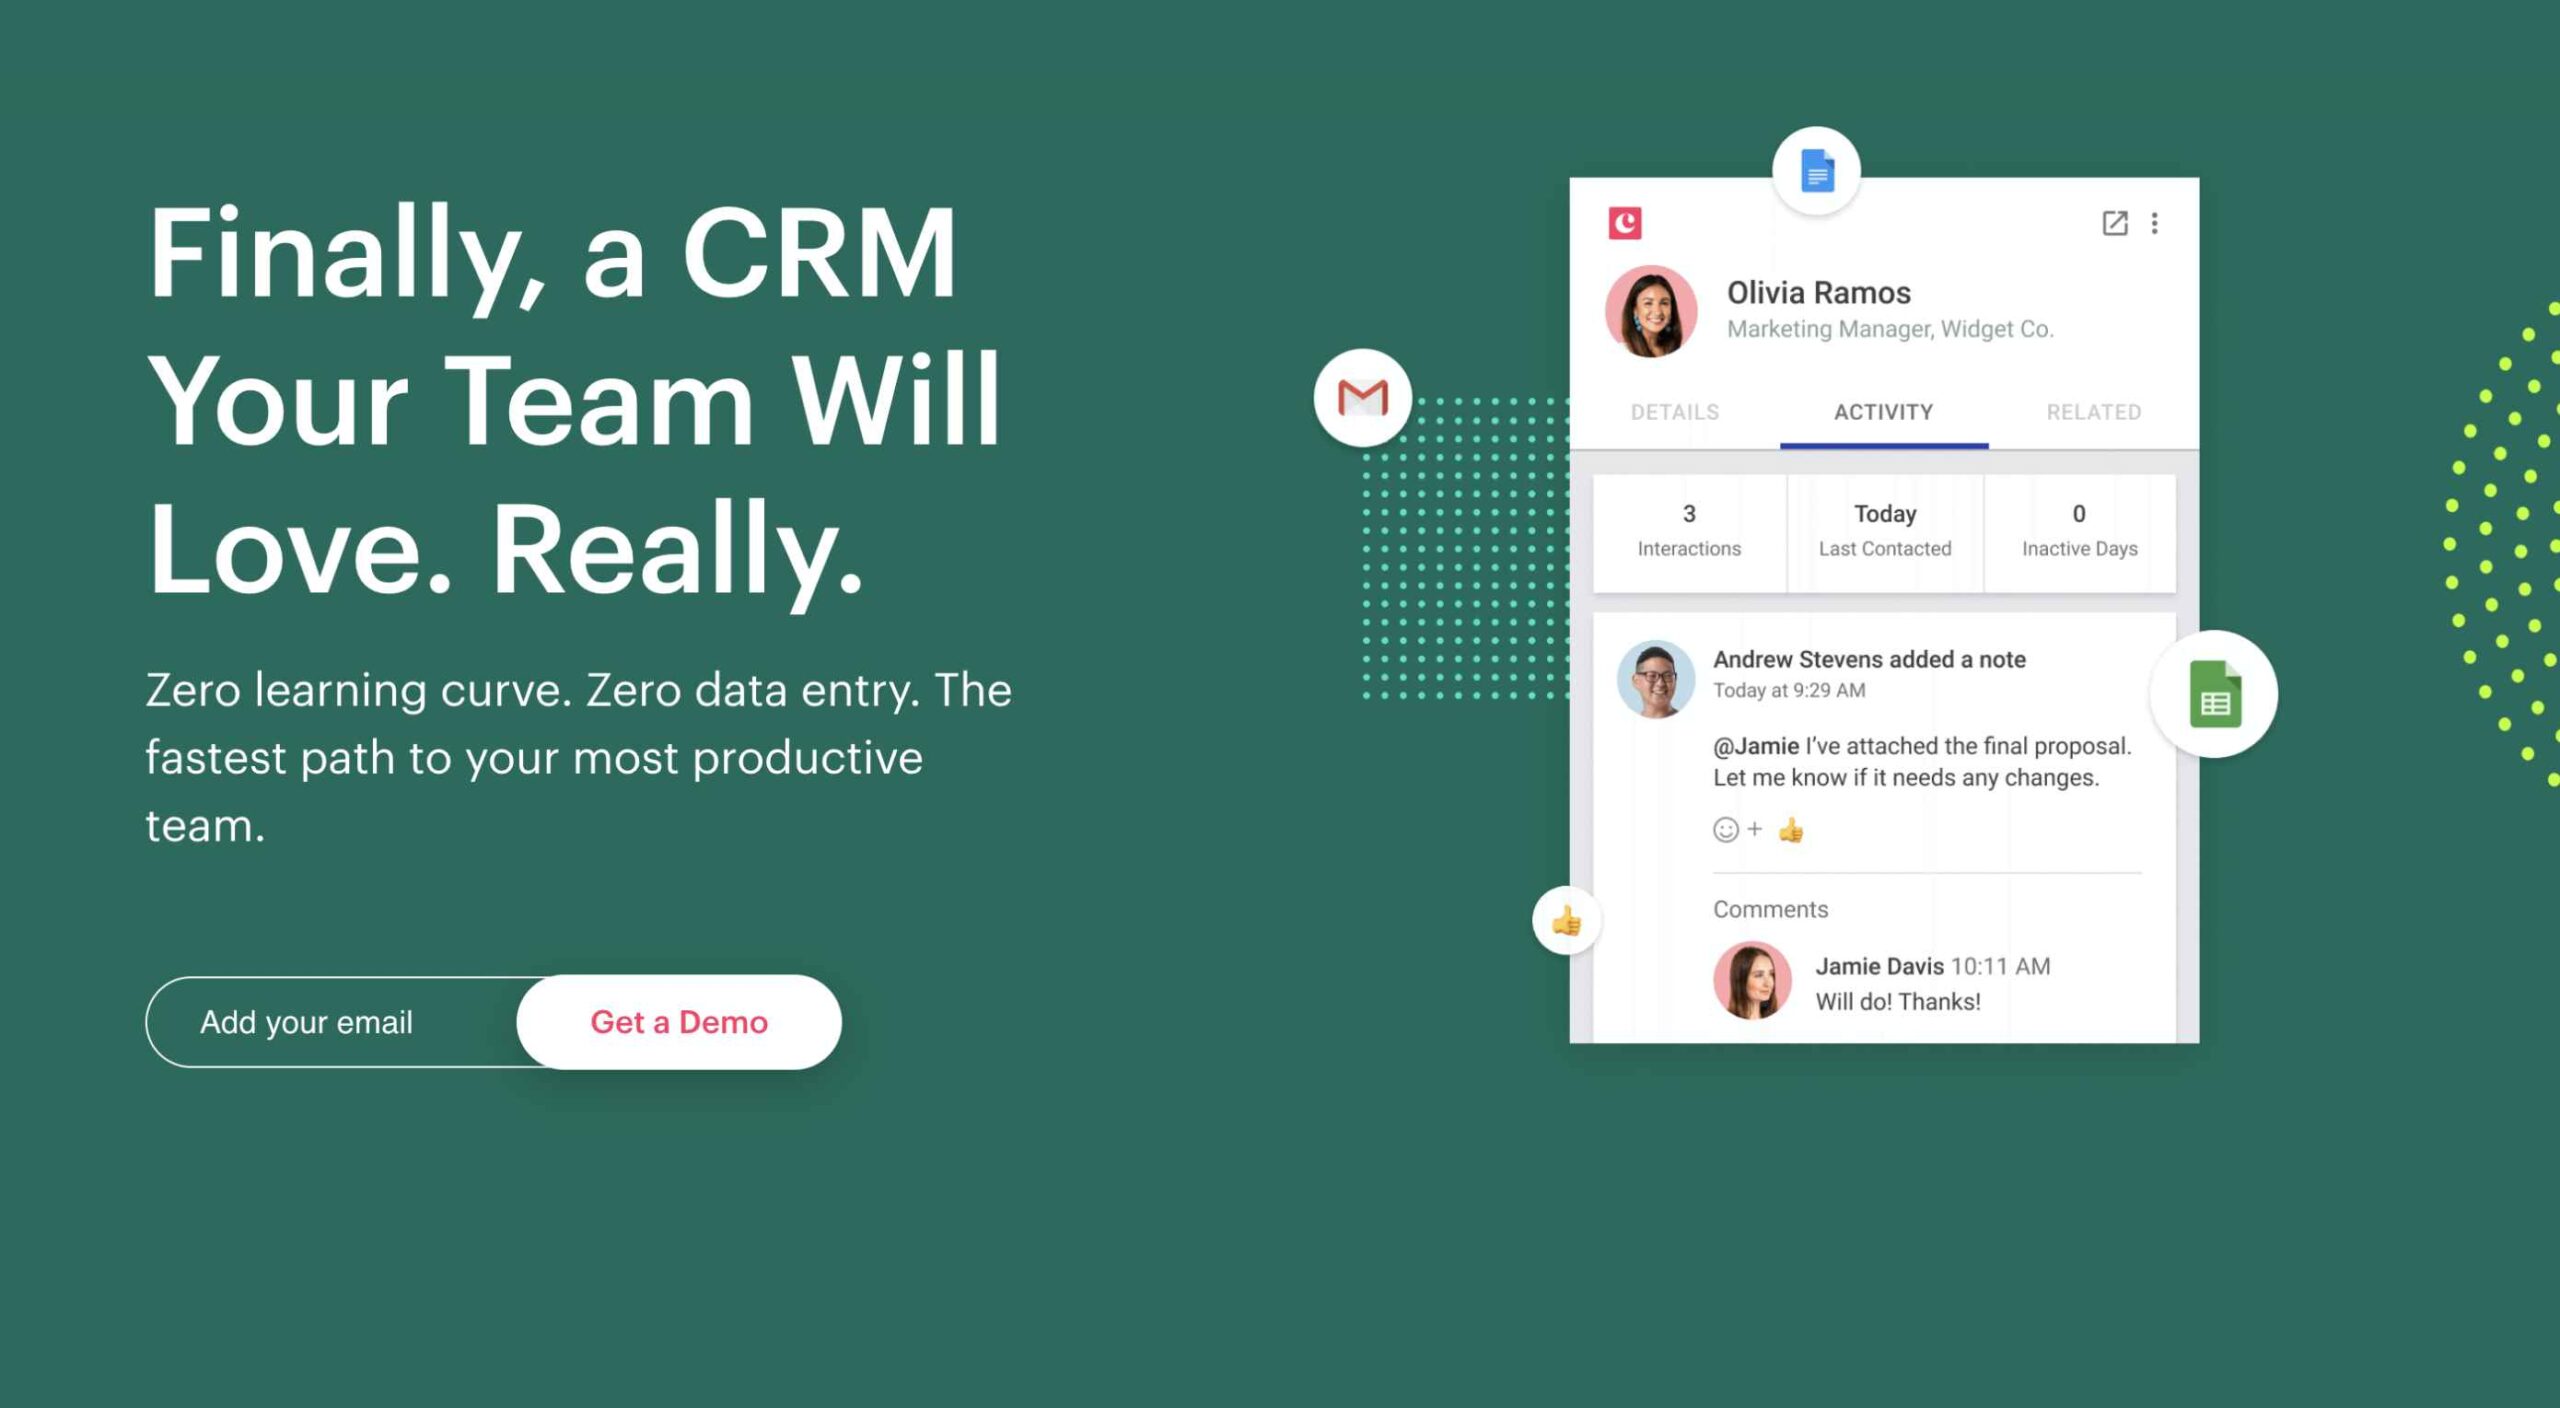
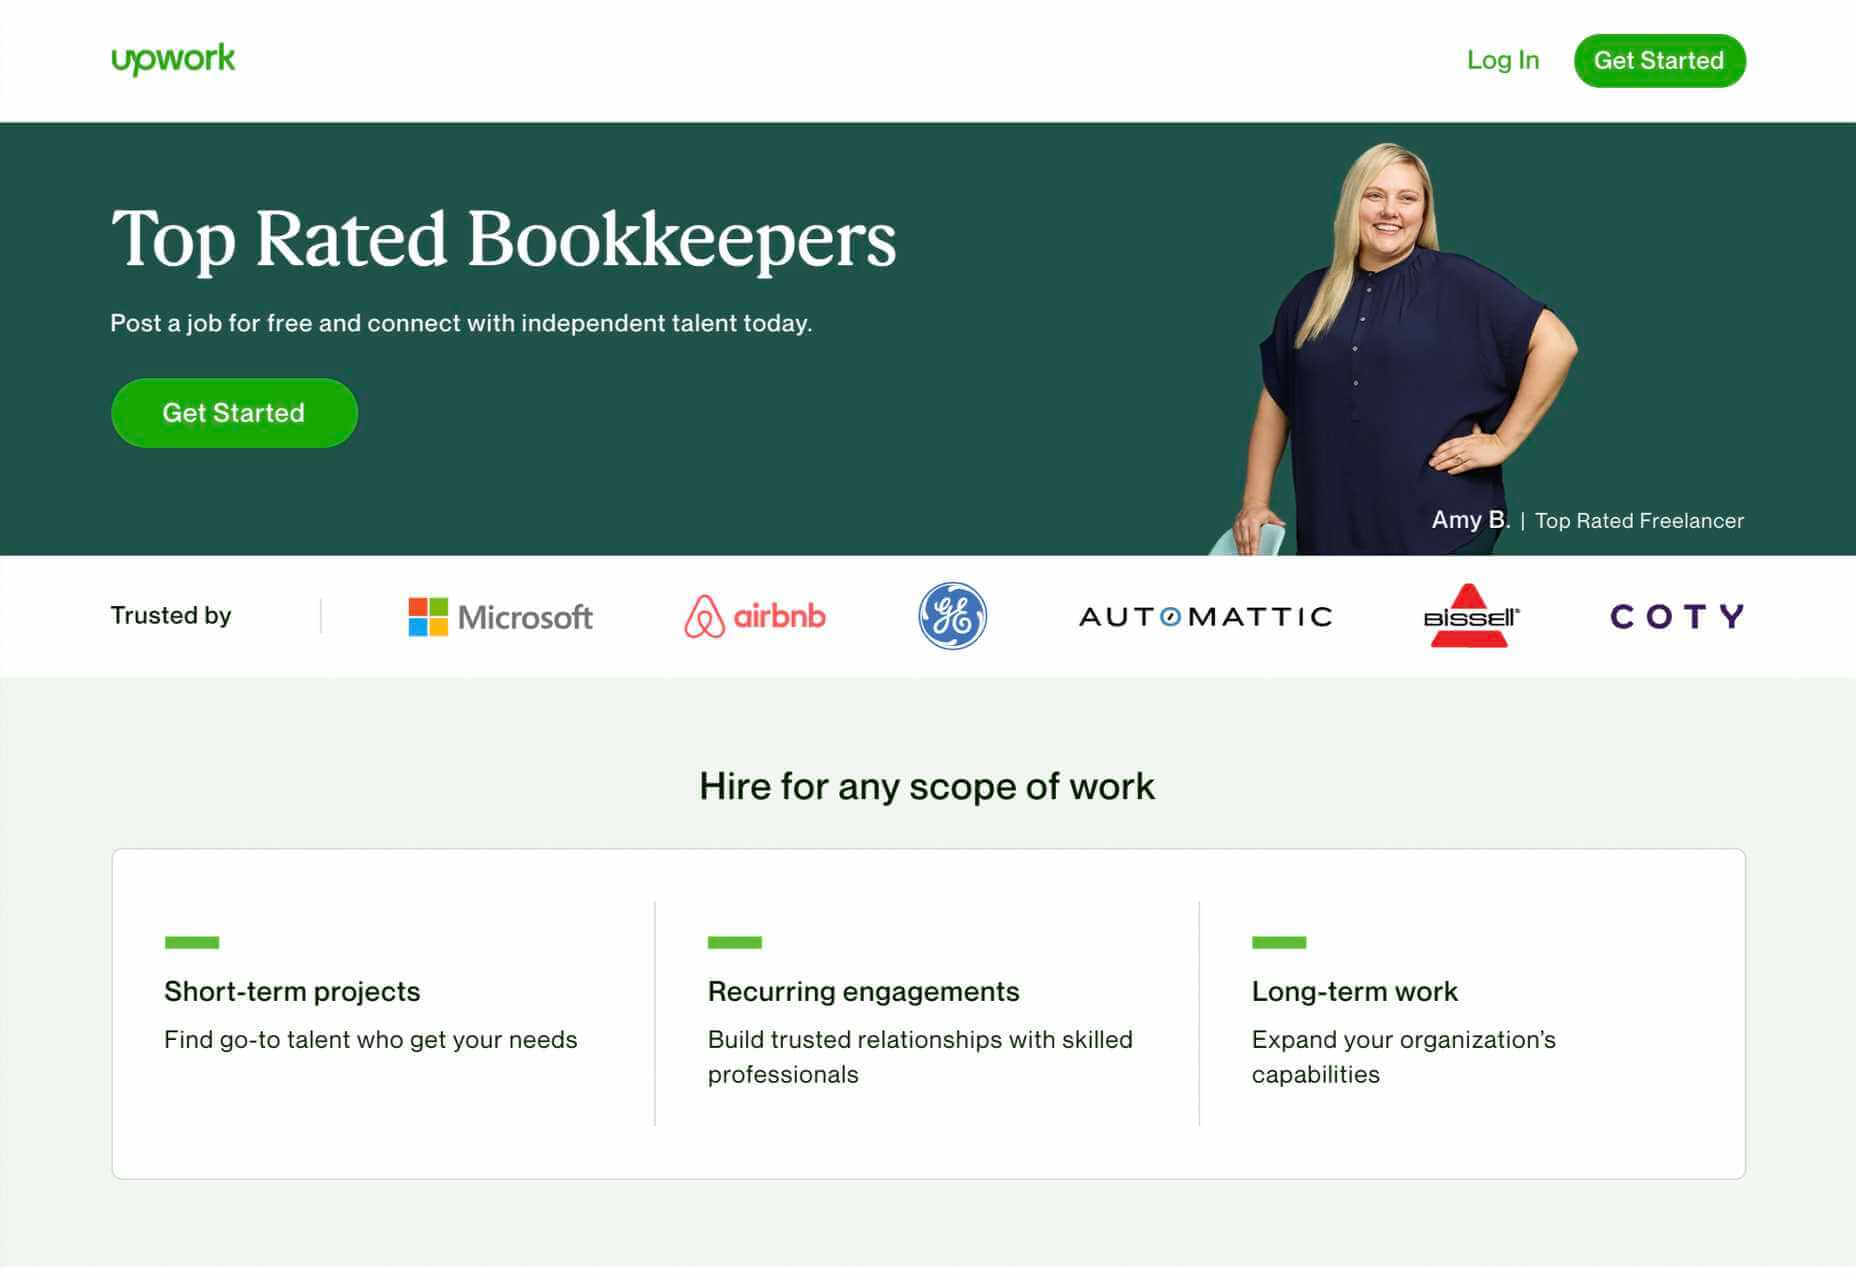
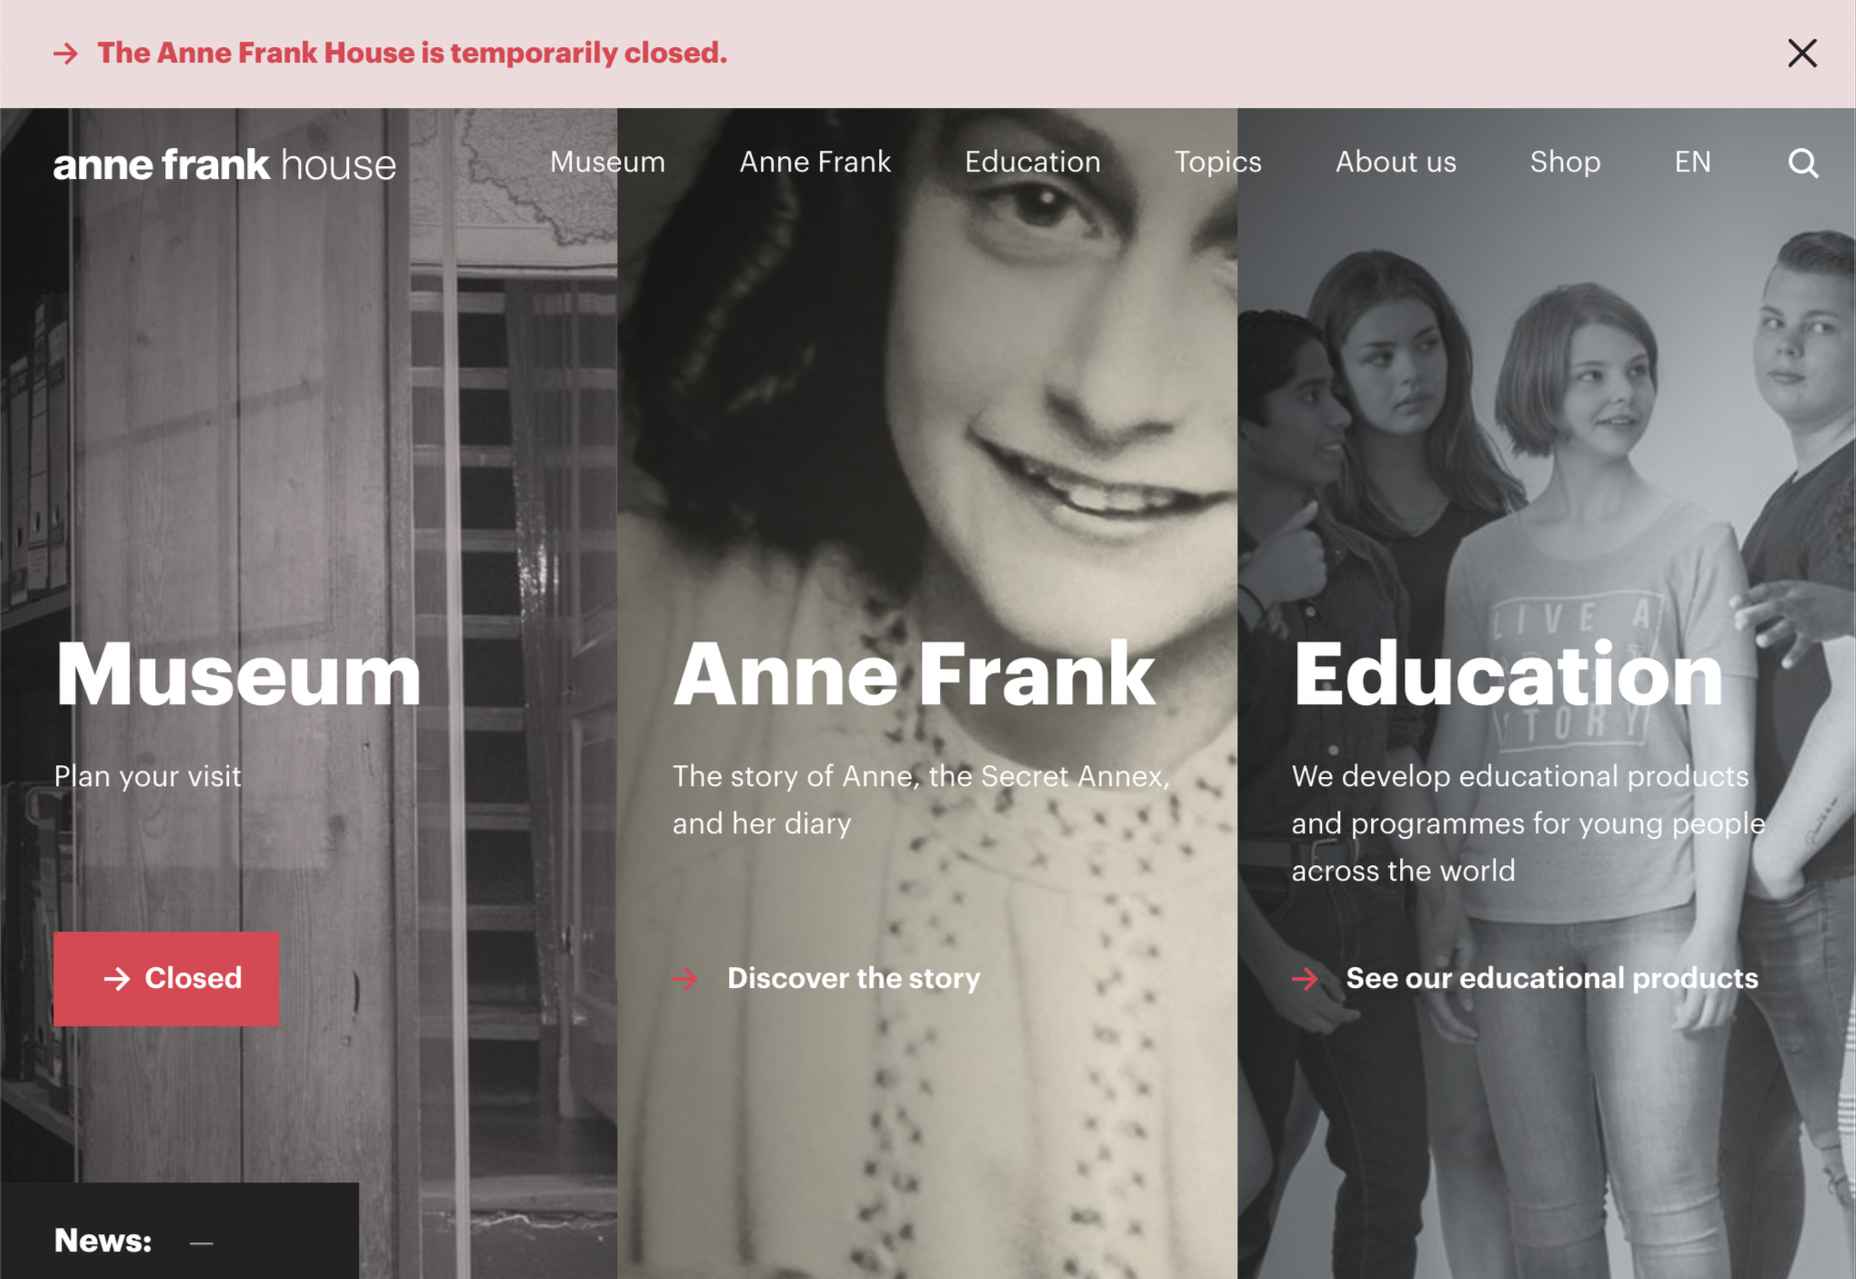
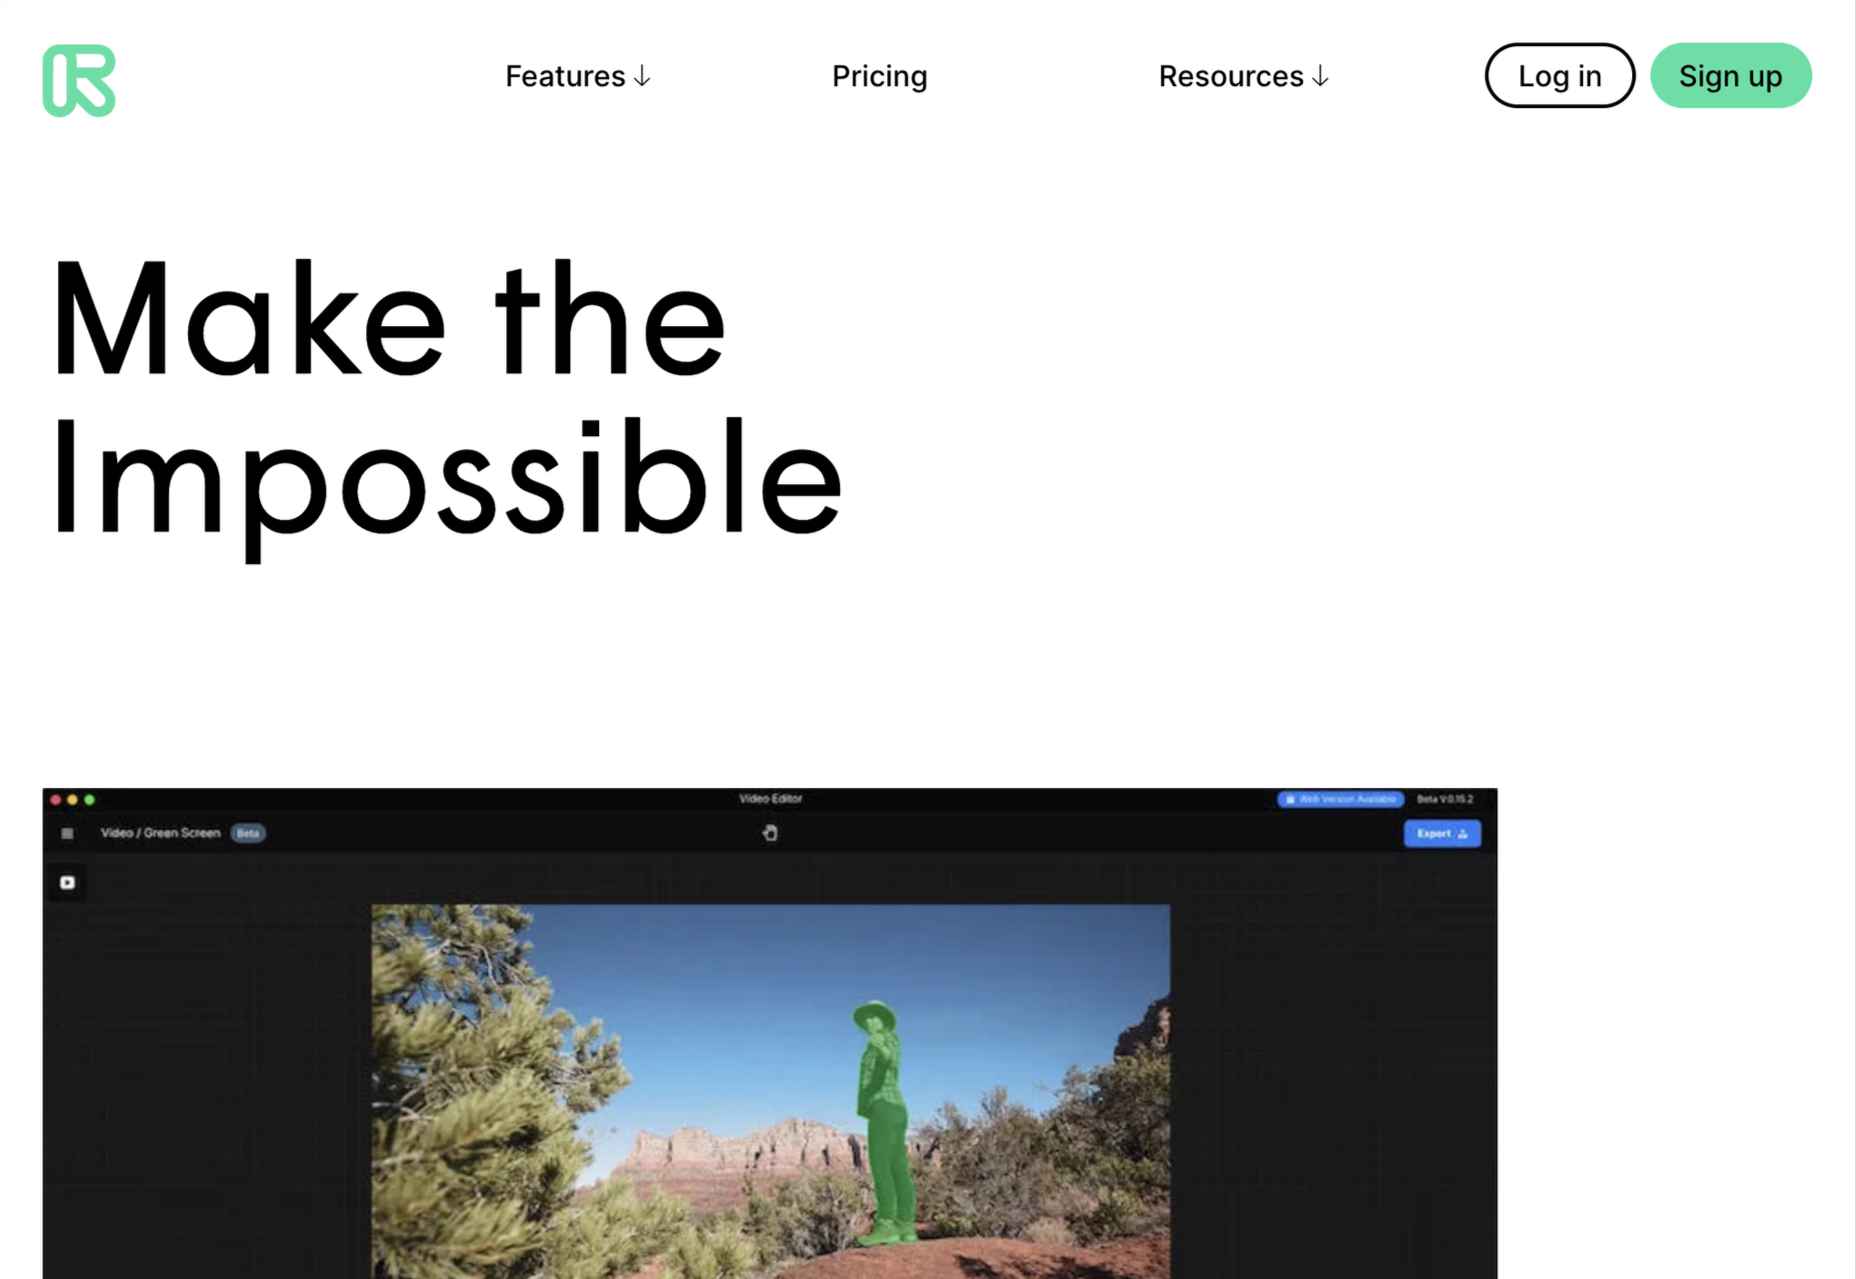
3. Make the Headline Punchy
The first thing your potential customer sees on your landing page is the headline, so make it count.
Half a dozen words are usually more than enough. Your goal is to keep it short enough that the potential customer has read the headline before they realize it.
Often, you’ll want to clarify the statement with more information. That’s fine as a sub-heading after you’ve grabbed their interest, but make sure you grab their attention first.
The headline “Coyote Anvils” is best followed by the sub-heading “You’ll be eating roadrunner for dinner!”
Your goal for your headline is to explain your product or service in 2–3 seconds.
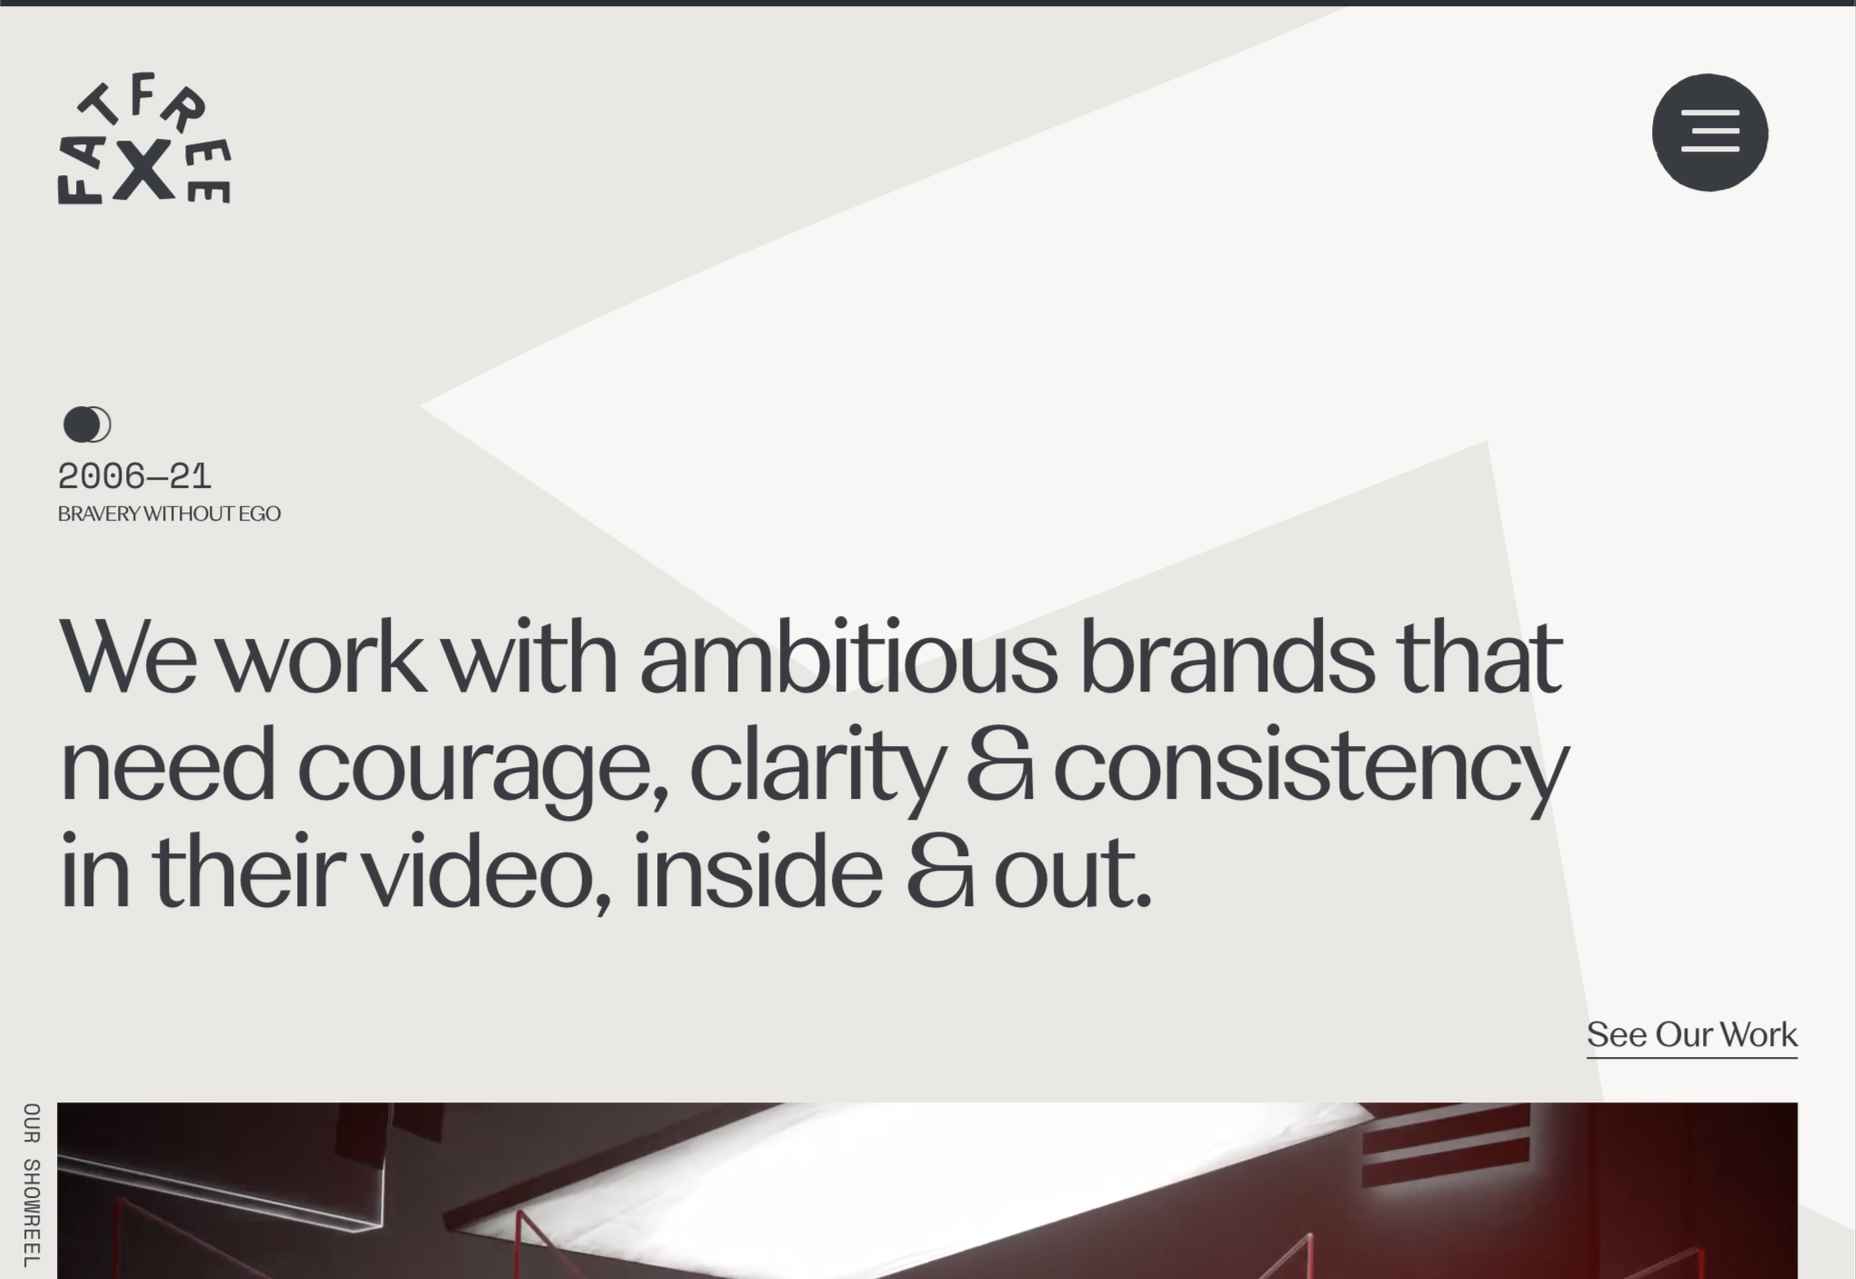
4. Center Your Content Around Your Value Proposition
What makes your product or service stand out? What makes it better than the competition? If you’re not sure, spend some time checking out companies in your space.
Creating a value proposition can be one of the toughest challenges a business faces because you need to put yourself in your potential customer’s shoes. But if you get this right, it will carry your marketing. You need to find the benefits within your product or service, not the features.
Value propositions are best when backed by facts. The “World’s Most Accurate Anvils” is best backed by proof: “9/10 coyotes said they were more likely to hit their target than themselves when using our patented AccuAnvil.”
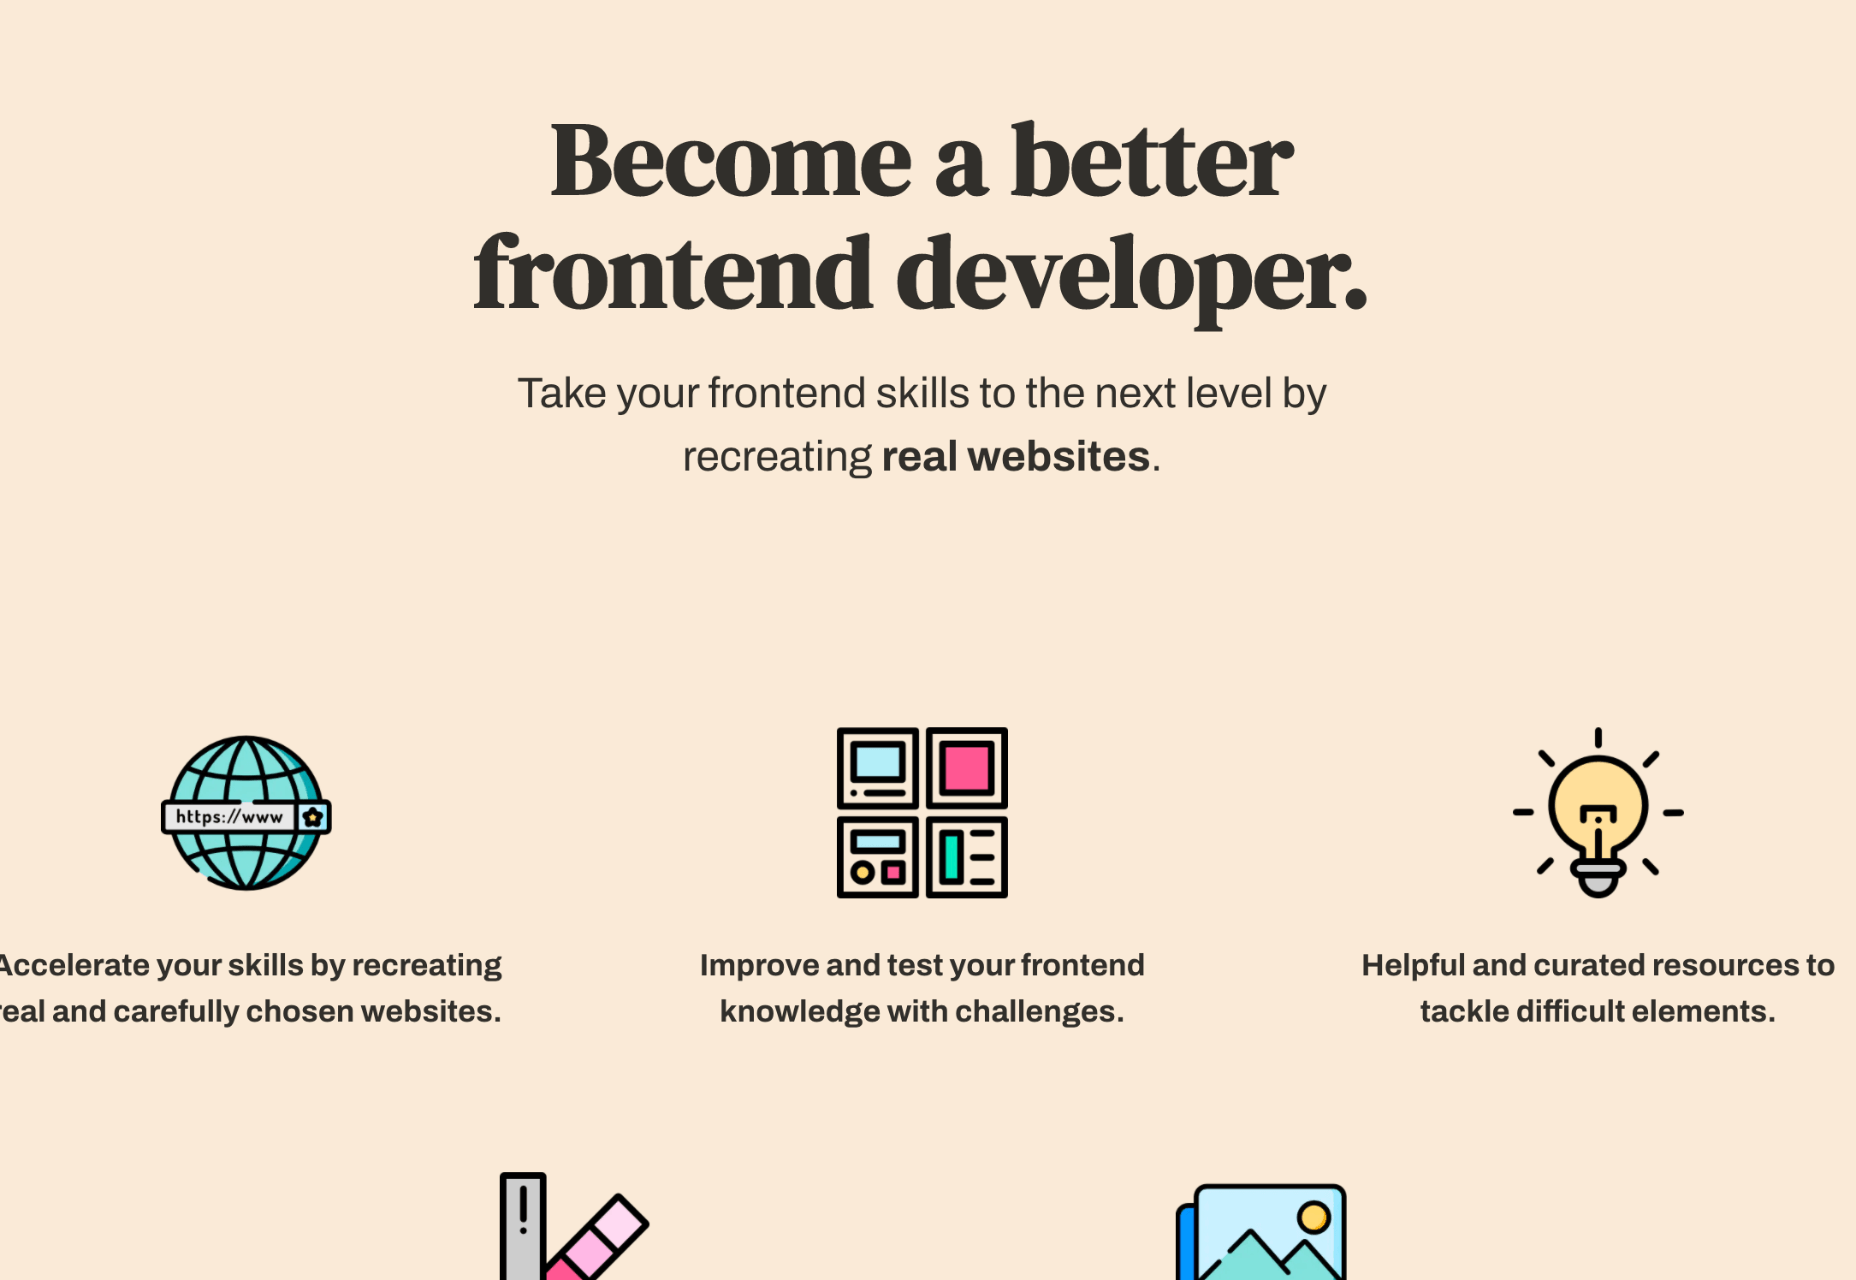
5. Lists, Lists, and More Lists
You’ve got seconds to engage your potential customer, perhaps even less. One way to grab them is with a great headline, but you have to keep them interested beyond the headline.
One great way is bullet lists with short entries. Short-item lists naturally pull our eyes down the page because our eyes take in the whole line in one glance; we don’t need to read to absorb the information.
The longer you can keep someone on the page, the greater the likelihood they’ll keep looking, so pulling them down the page with lists is a great tactic.
6. Exploit the Zeigarnik Effect
The Zeigarnik Effect says that people remember incomplete experiences better than they do completed ones. This is because when a task is seen as completed, it can be filed away as a memory, but if it’s incomplete, then it remains at the front of your mind.
This is a boon for designers creating landing pages because we can create a situation where the potential customer begins an onboarding process and is aware that it hasn’t been completed — they might need to verify their email address, for example.
The lack of completion keeps the landing page and the product or service fresh in the potential customer’s mind. So when they see that onboarding email, they’ll use it.
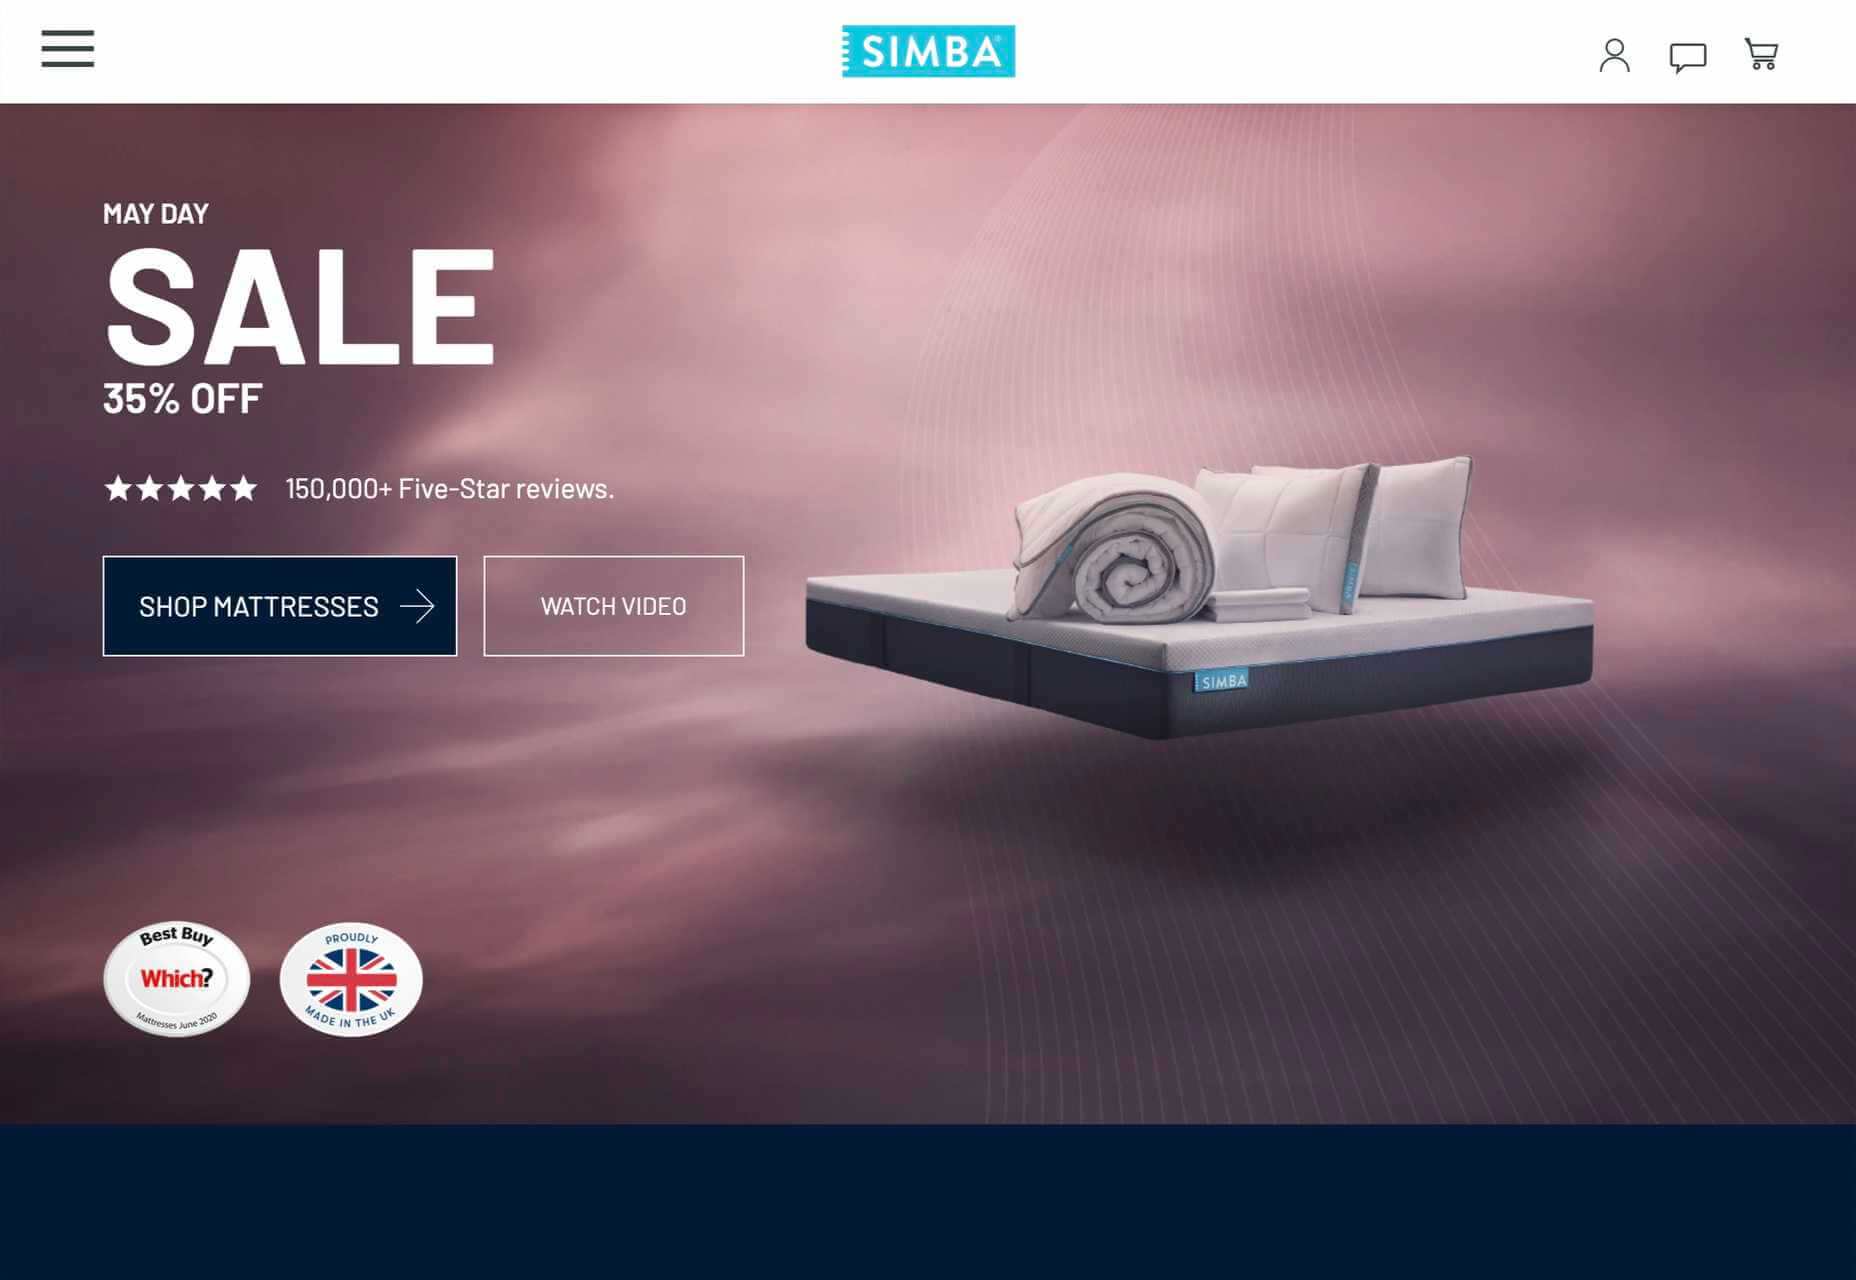
7. Proof
Anyone can put up a website. It’s easy. And as a result, potential customers don’t necessarily trust you.
One way you can combat this is with some form of proof. That may be in the form of official certifications, or featured testimonials, or just independent reviews.
It rarely occurs to potential customers that you’re cherry-picking the testimonials and reviews you’re choosing to display, so even if only some of your reviews are good, it’s worth including them.
But be careful not to sound too good. If you post nothing but 5* reviews, people will smell a rat; that 3* review may actually do you a favor by making the 5*s seem more genuine.
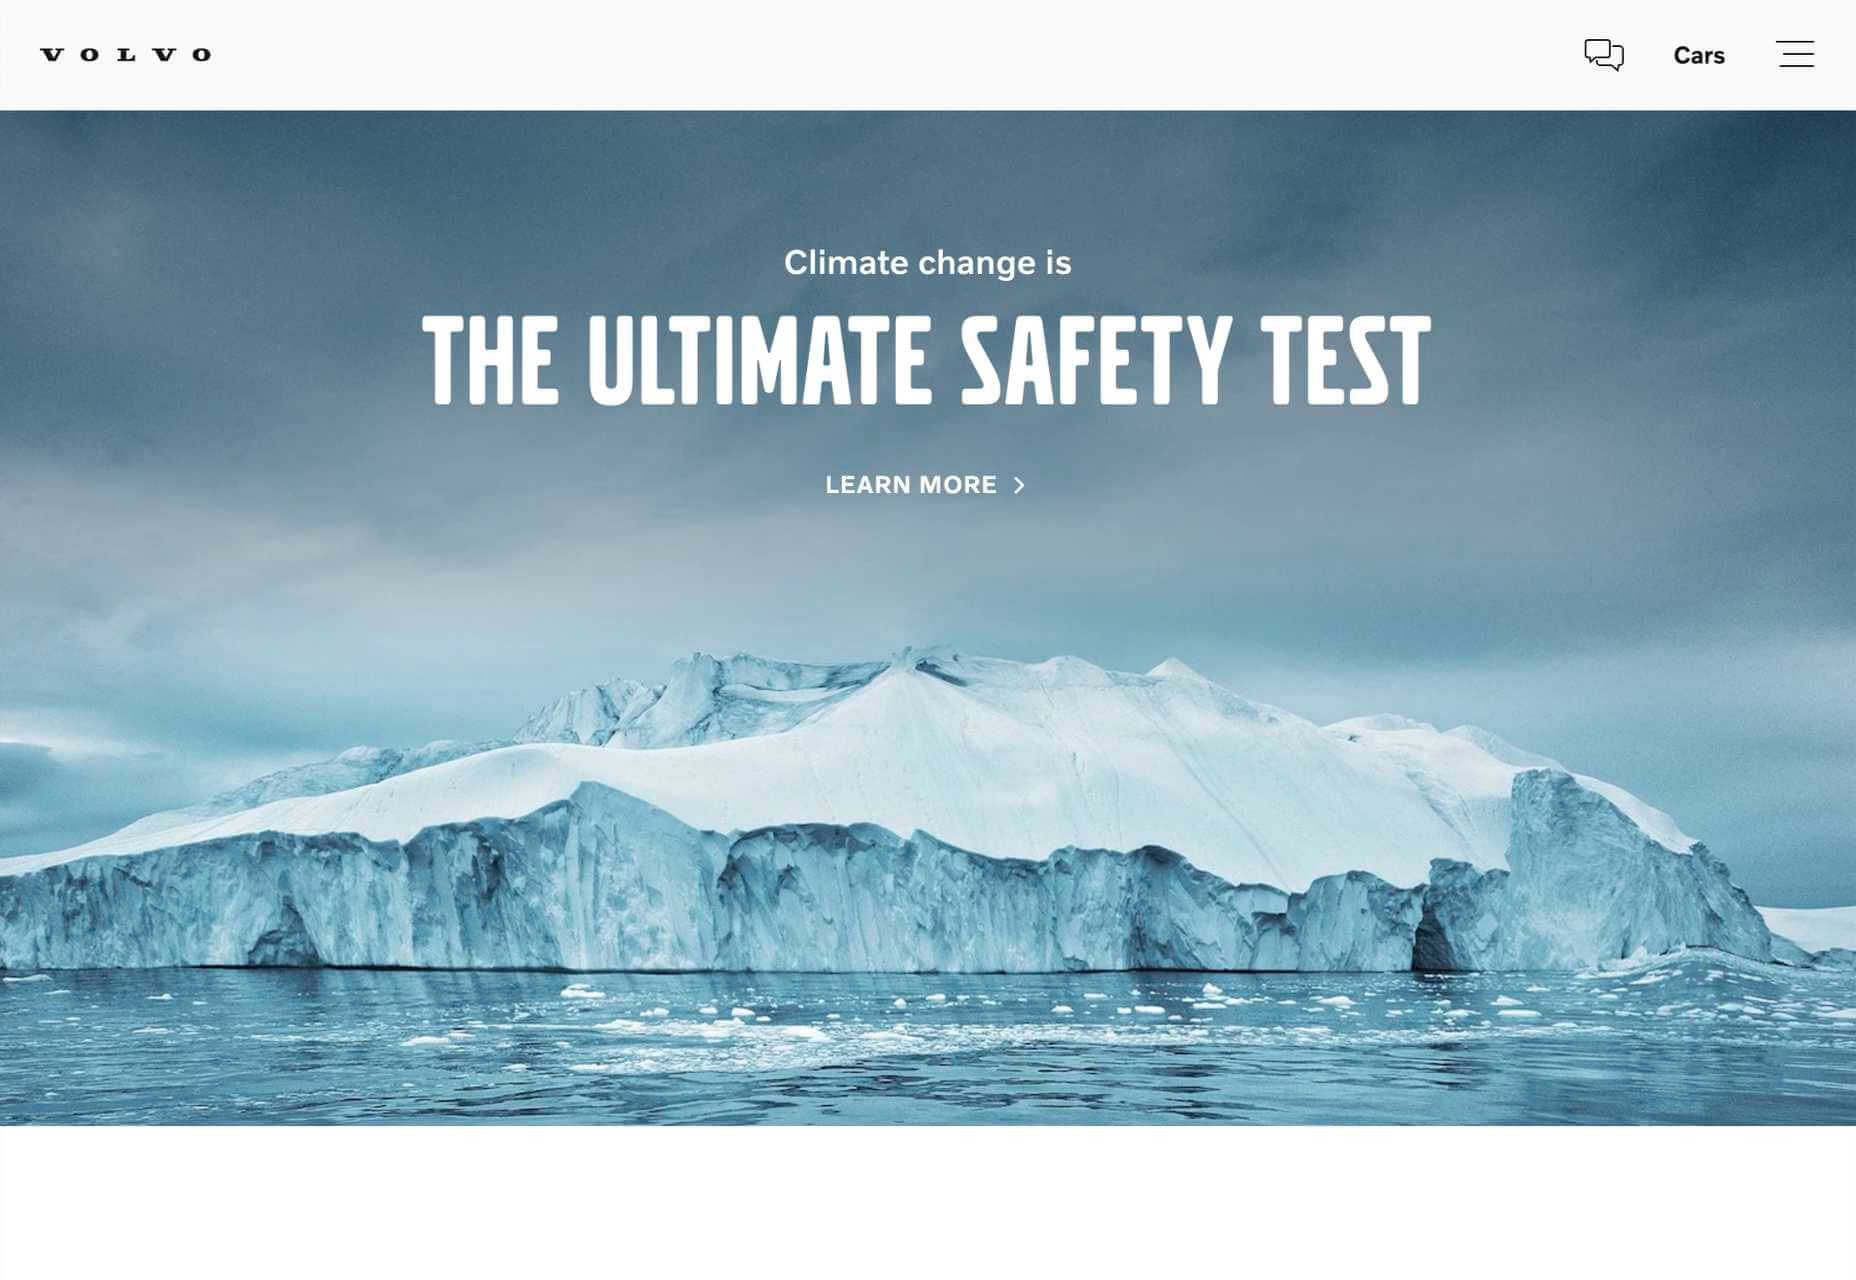
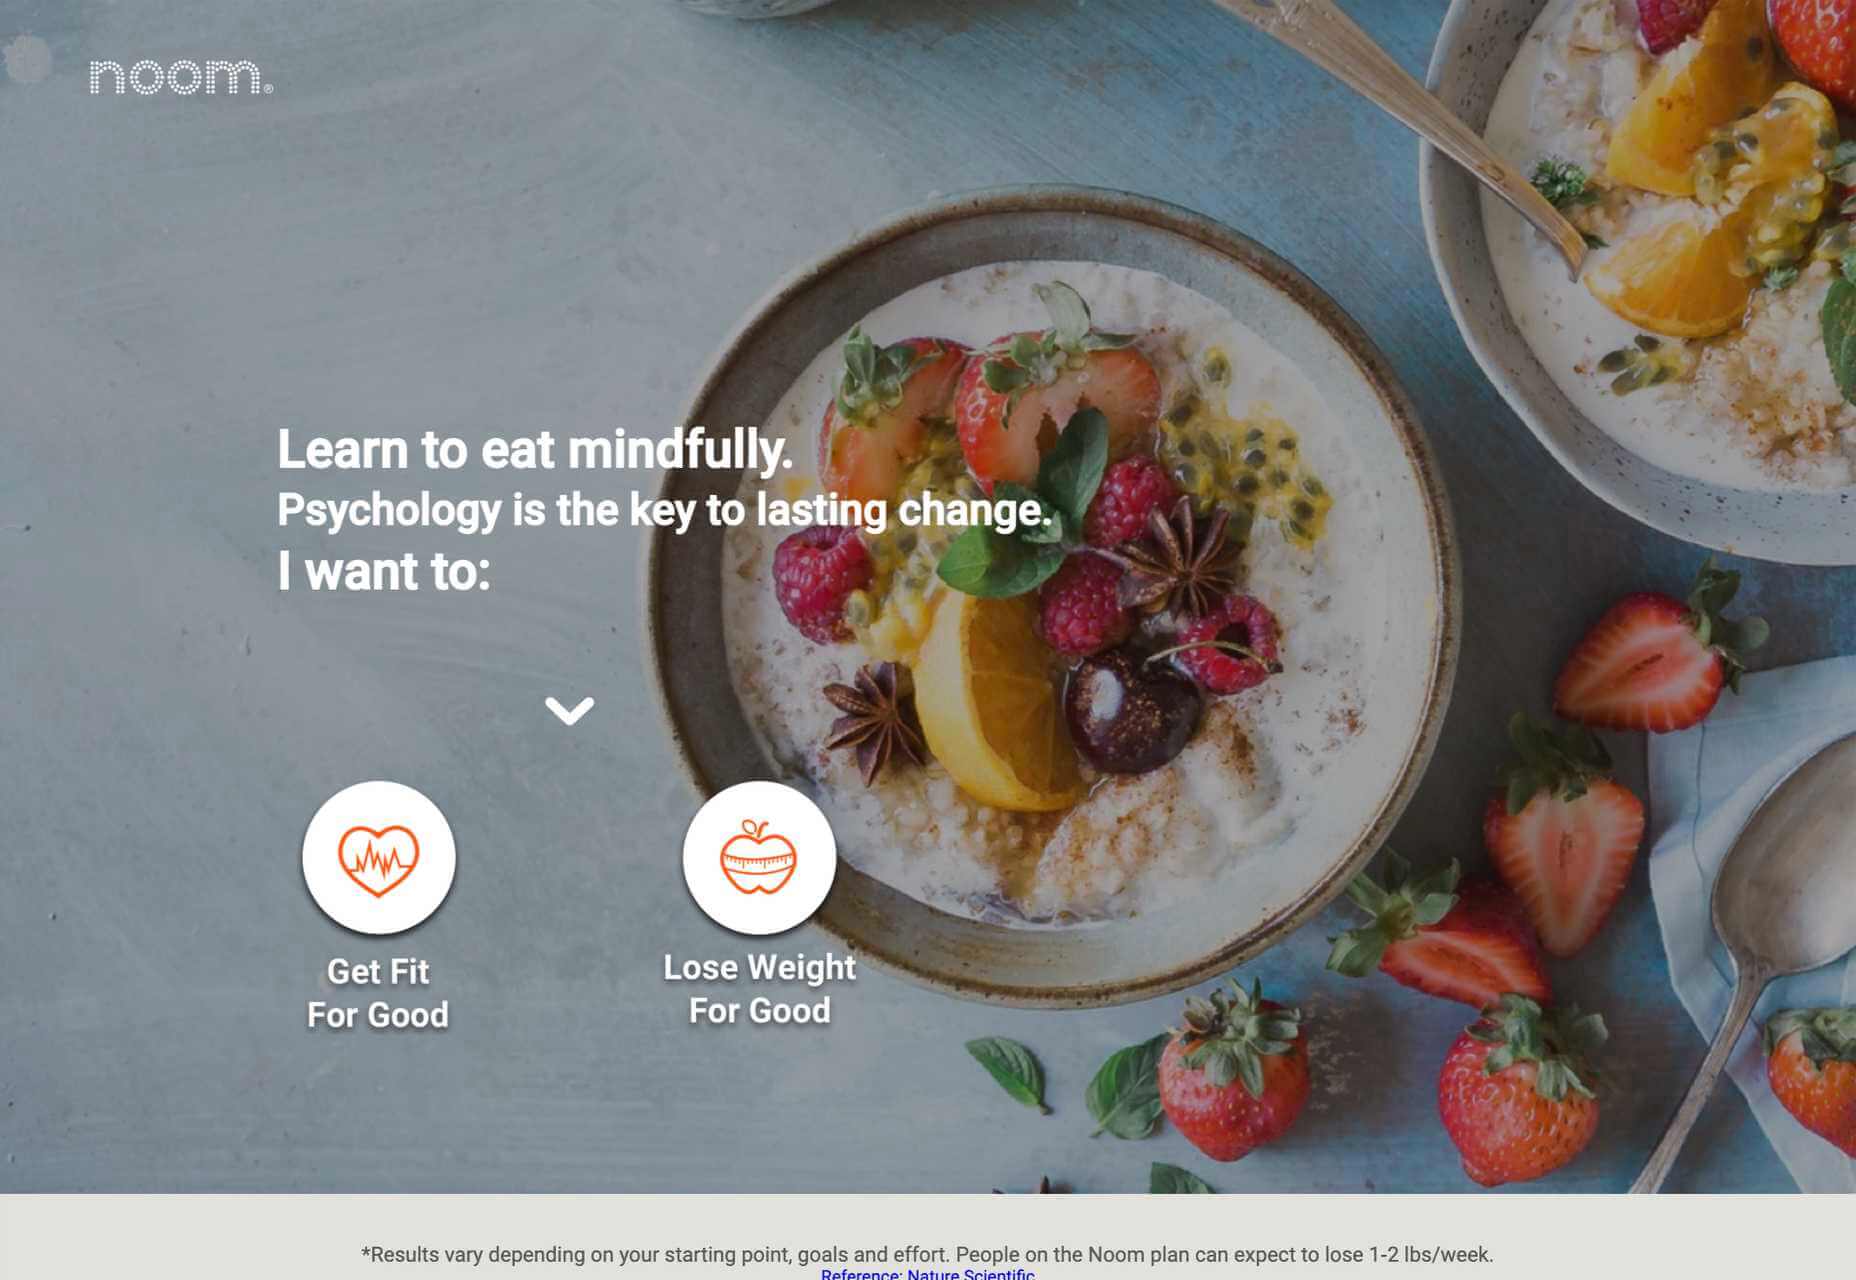
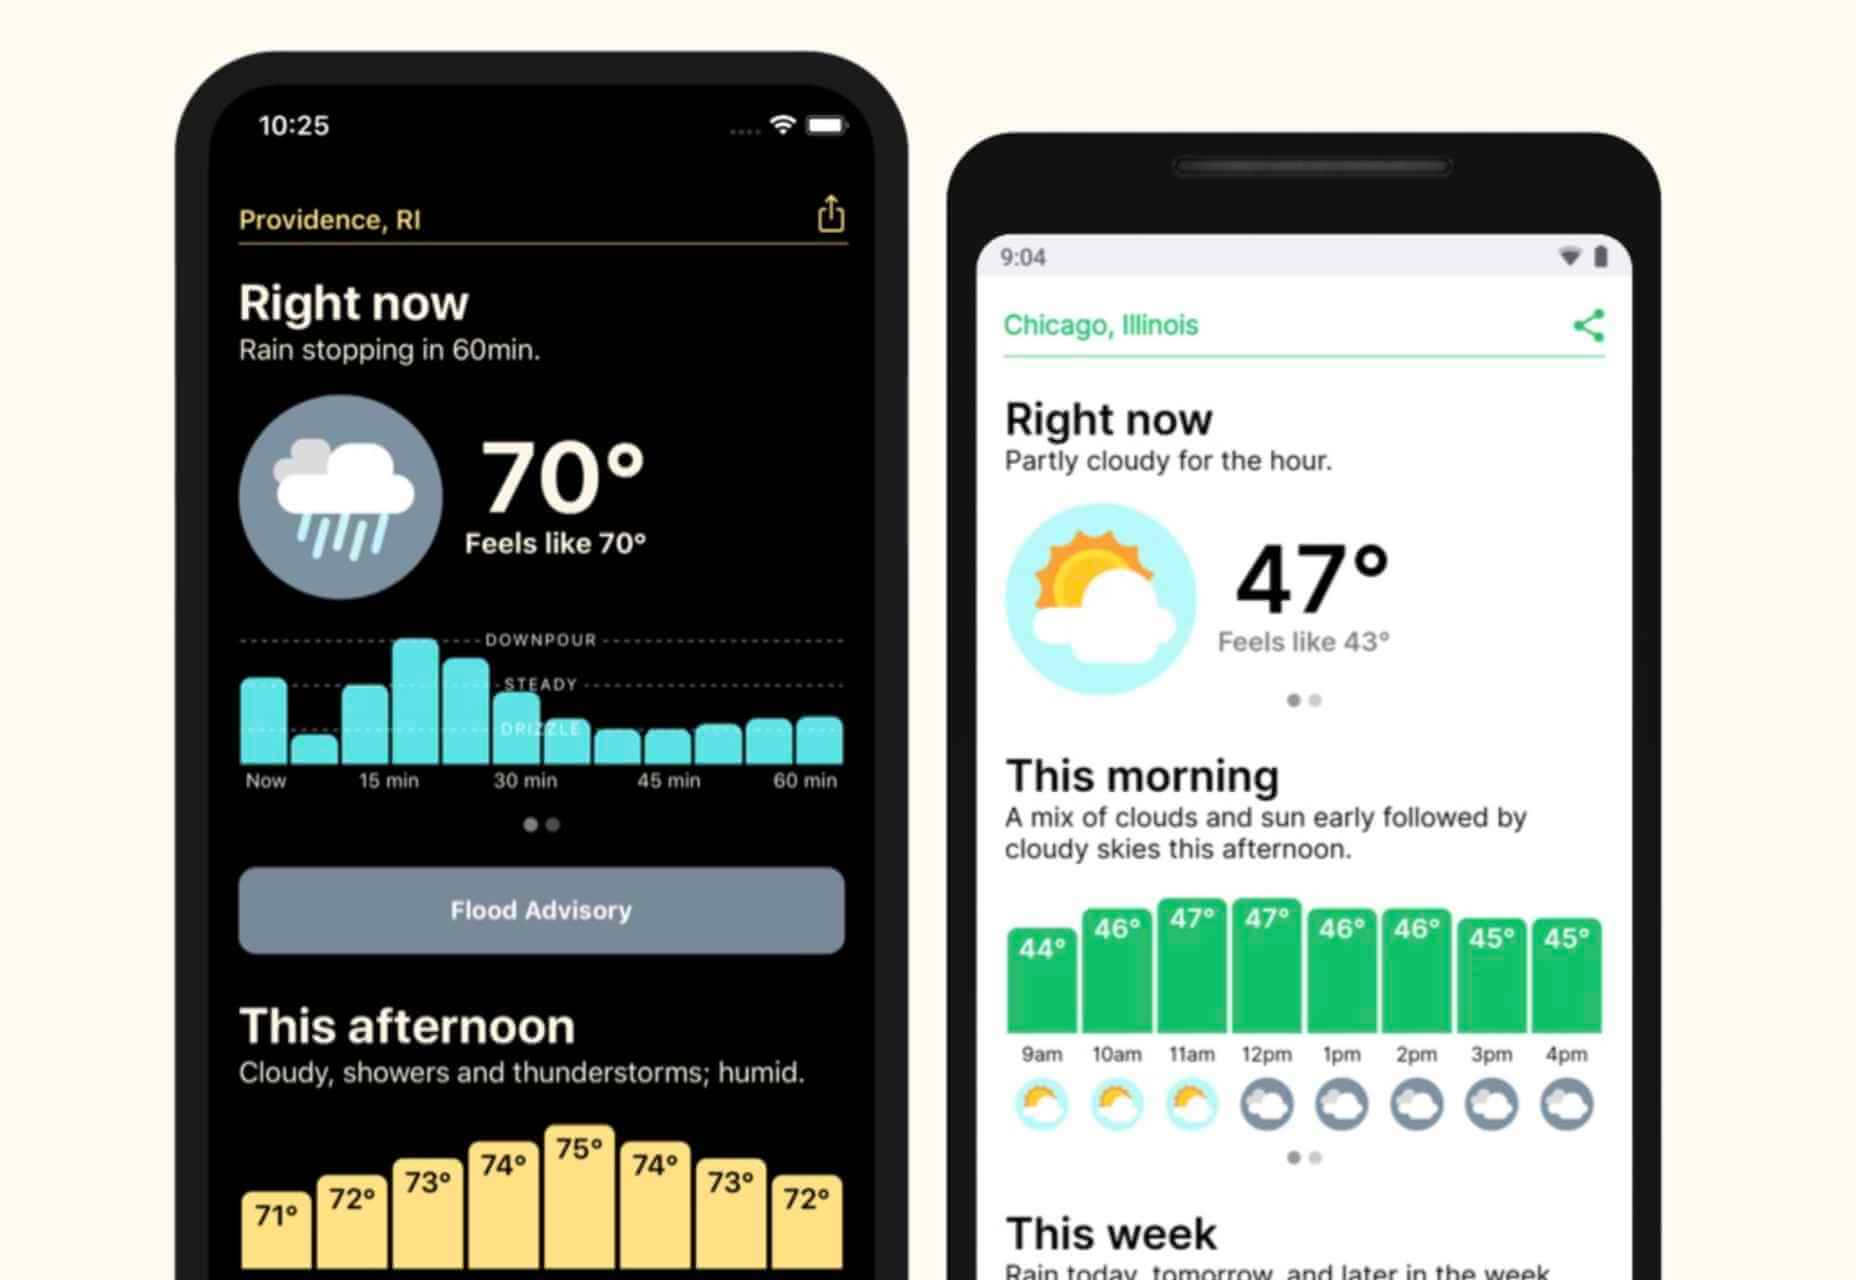
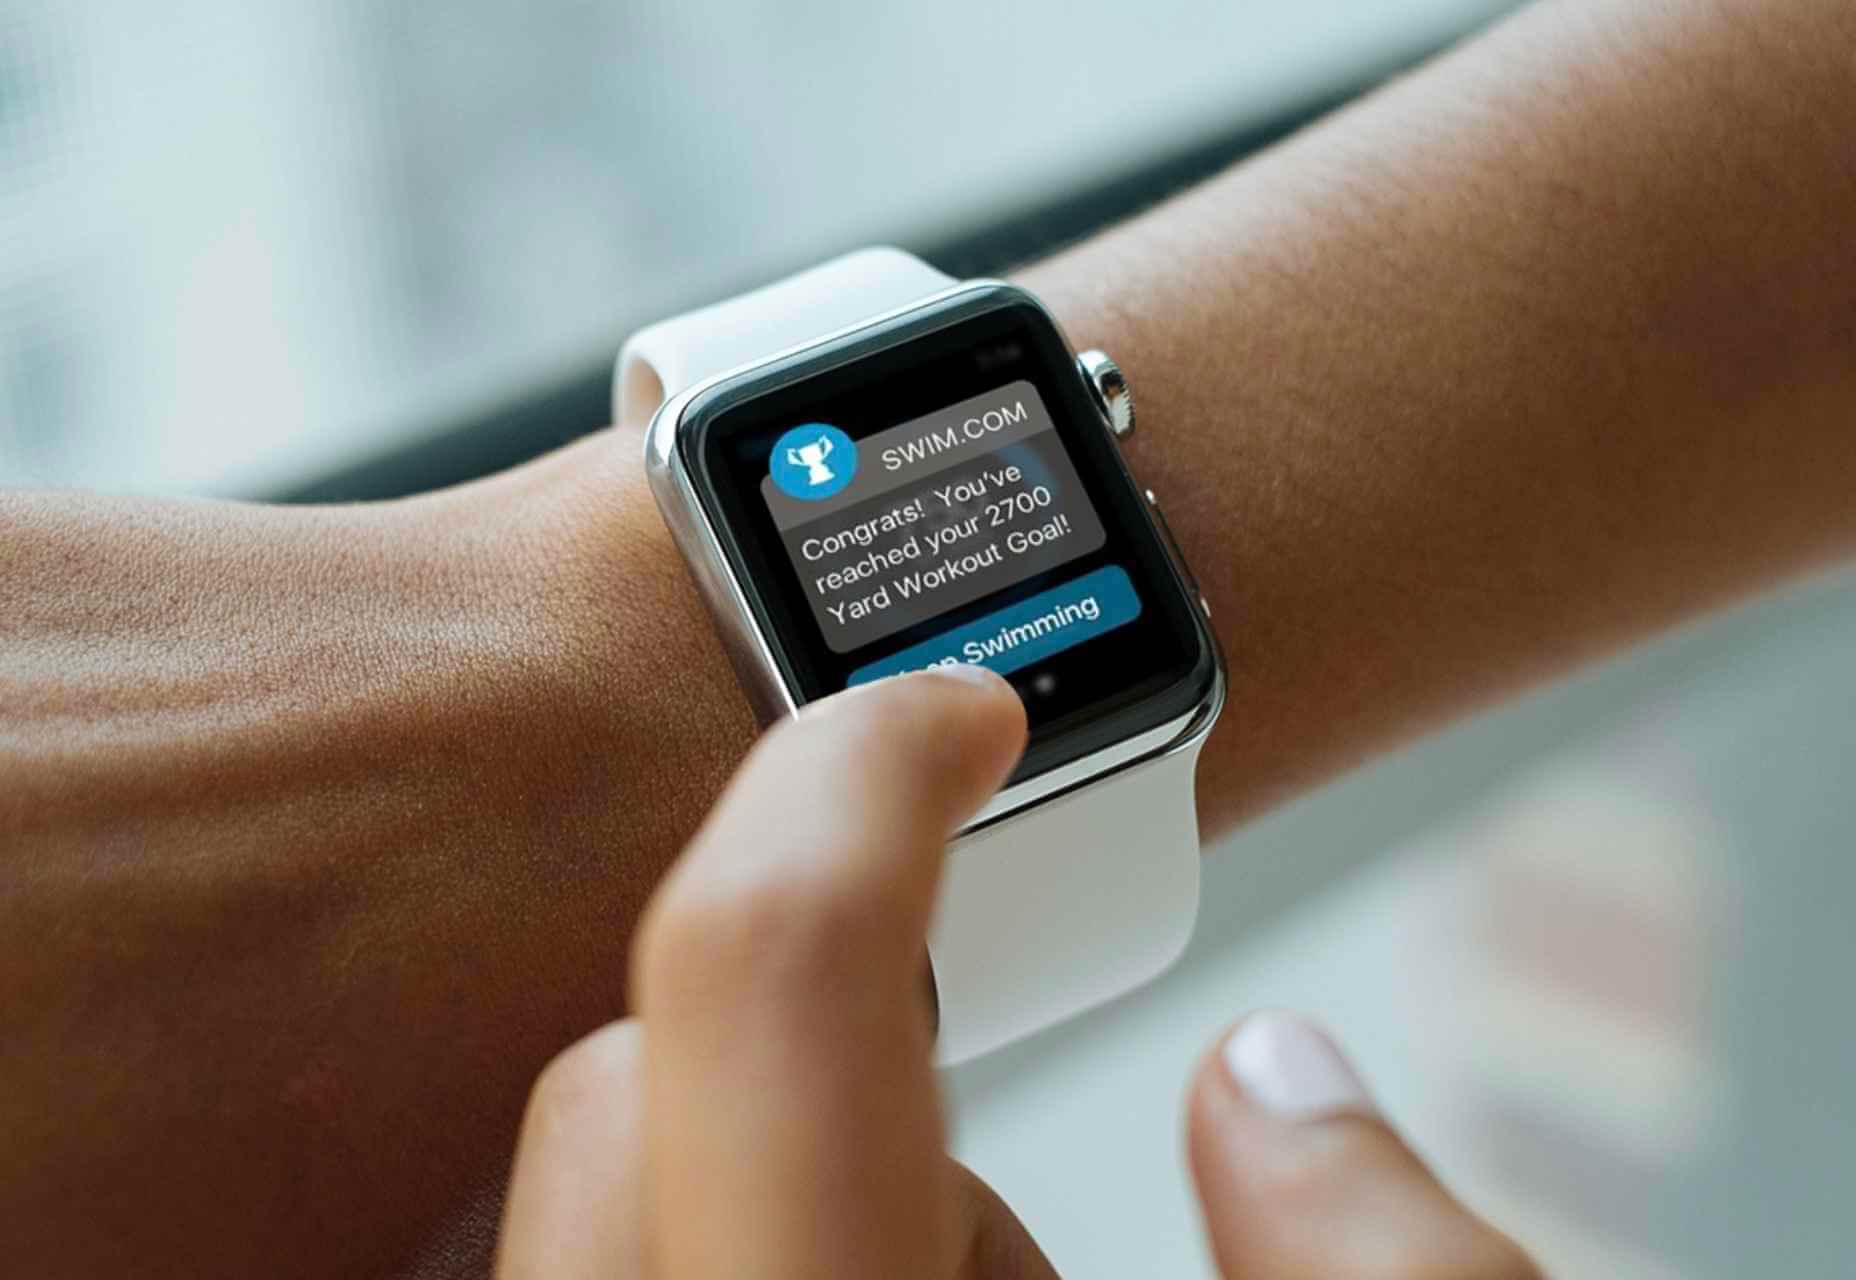
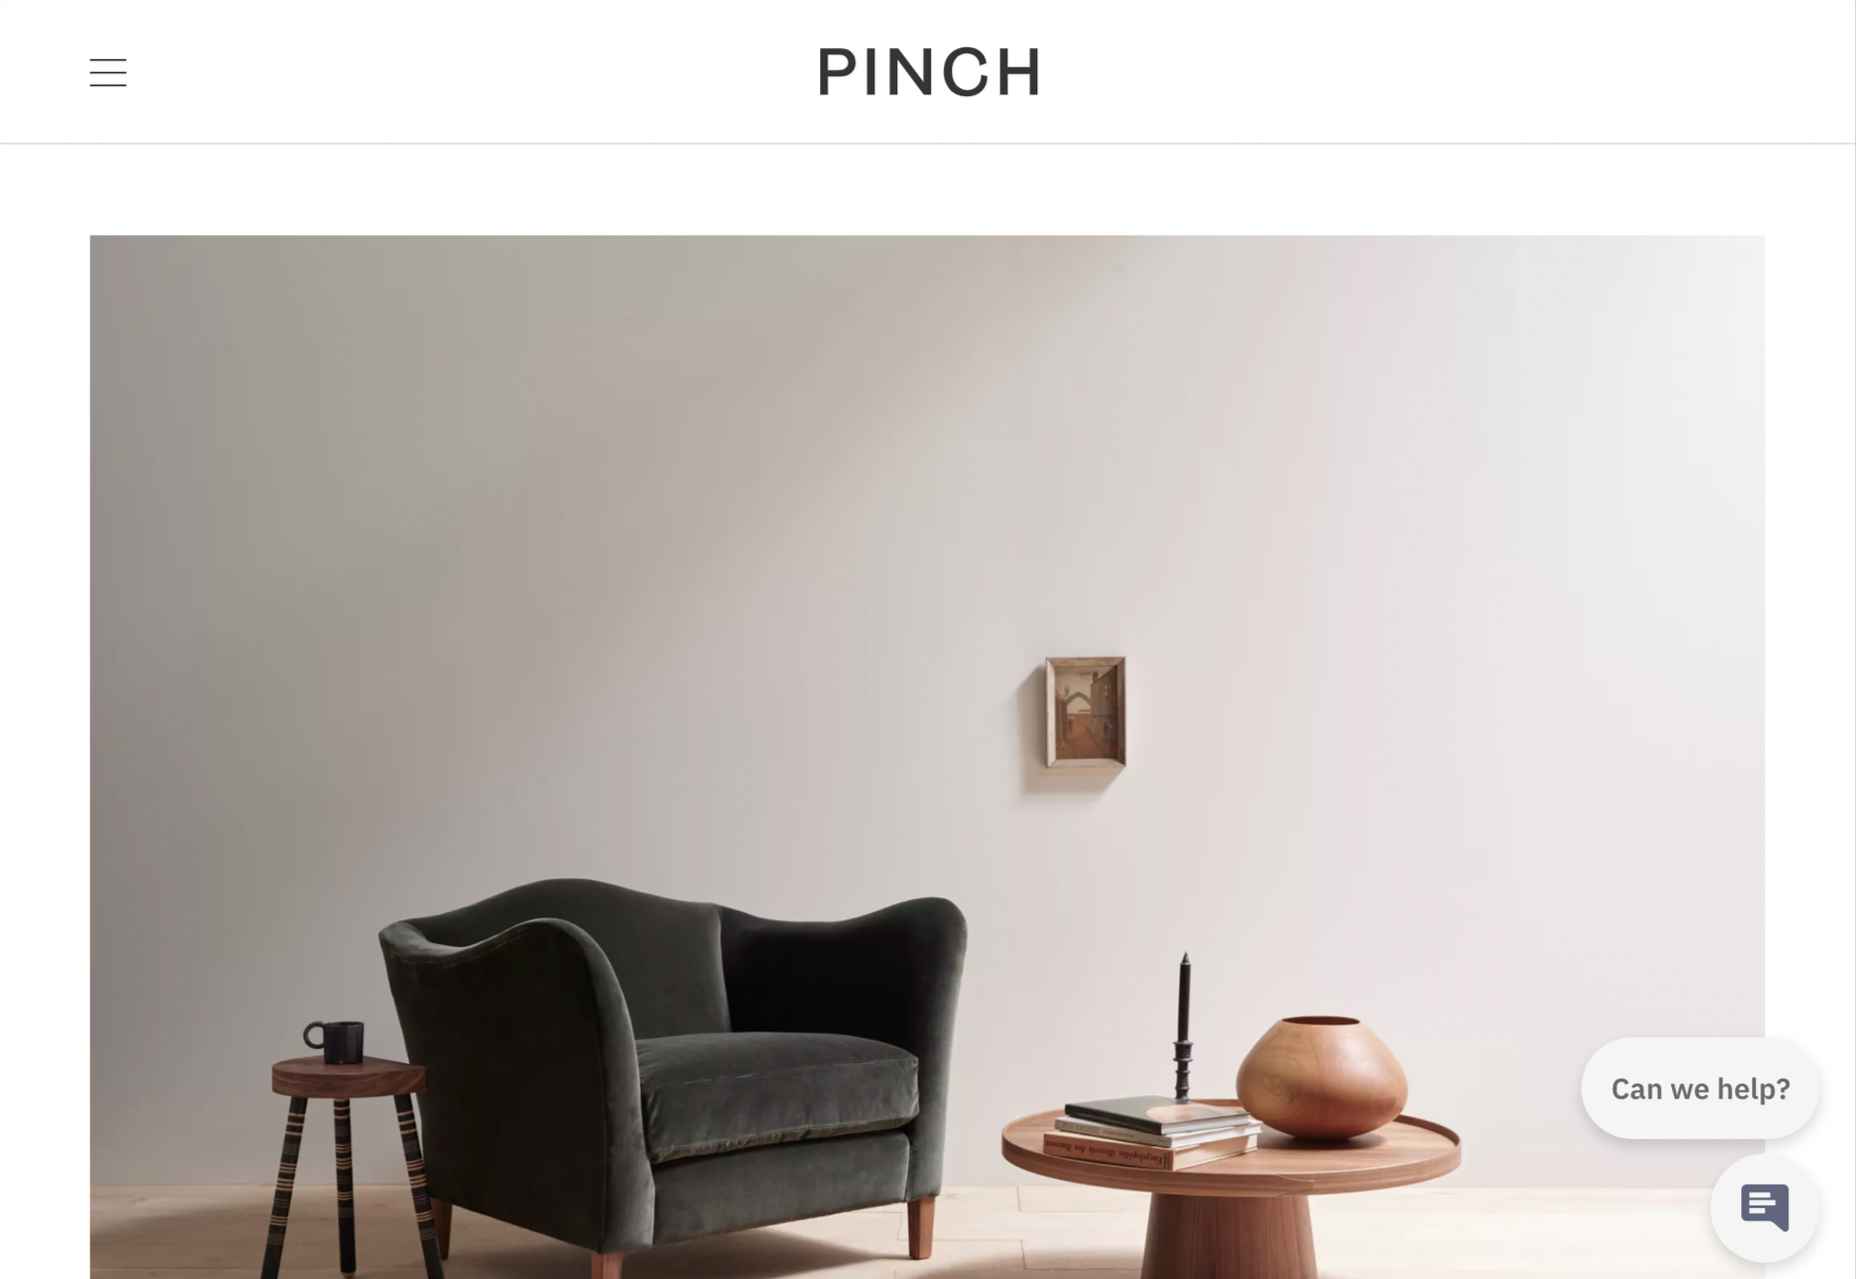
8. Predictive Images
Potential customers lack imagination, they don’t have all the facts, and unless your product or service is very basic, they may not fully understand what the product does for them.
Use images to quickly show them what life may be like using your product or service. Paint an appealing picture. If they can see themselves in the image, they’ll grant you a little more time to persuade them in the form of further content.

9. Continuity
How did the potential customer arrive at your landing page? Chances are it was via a PPC link, or if you were lucky an organic search link. However they arrived, they were in a certain frame of mind, with a certain problem they wanted to solve; they aren’t going to take kindly to being diverted onto a different train of thought.
Your landing page has to match the tone, style, and value proposition of your adverts. The potential customer’s experience of your organization begins with the advert, not the landing page, so make sure that you don’t break the spell. If your landing page doesn’t match your advert, you could lose the potential customer altogether — and increase your bounce rate while you’re at it.
Remember: the customer was attracted by something in your advert, so give them the same attractive qualities on your landing page.
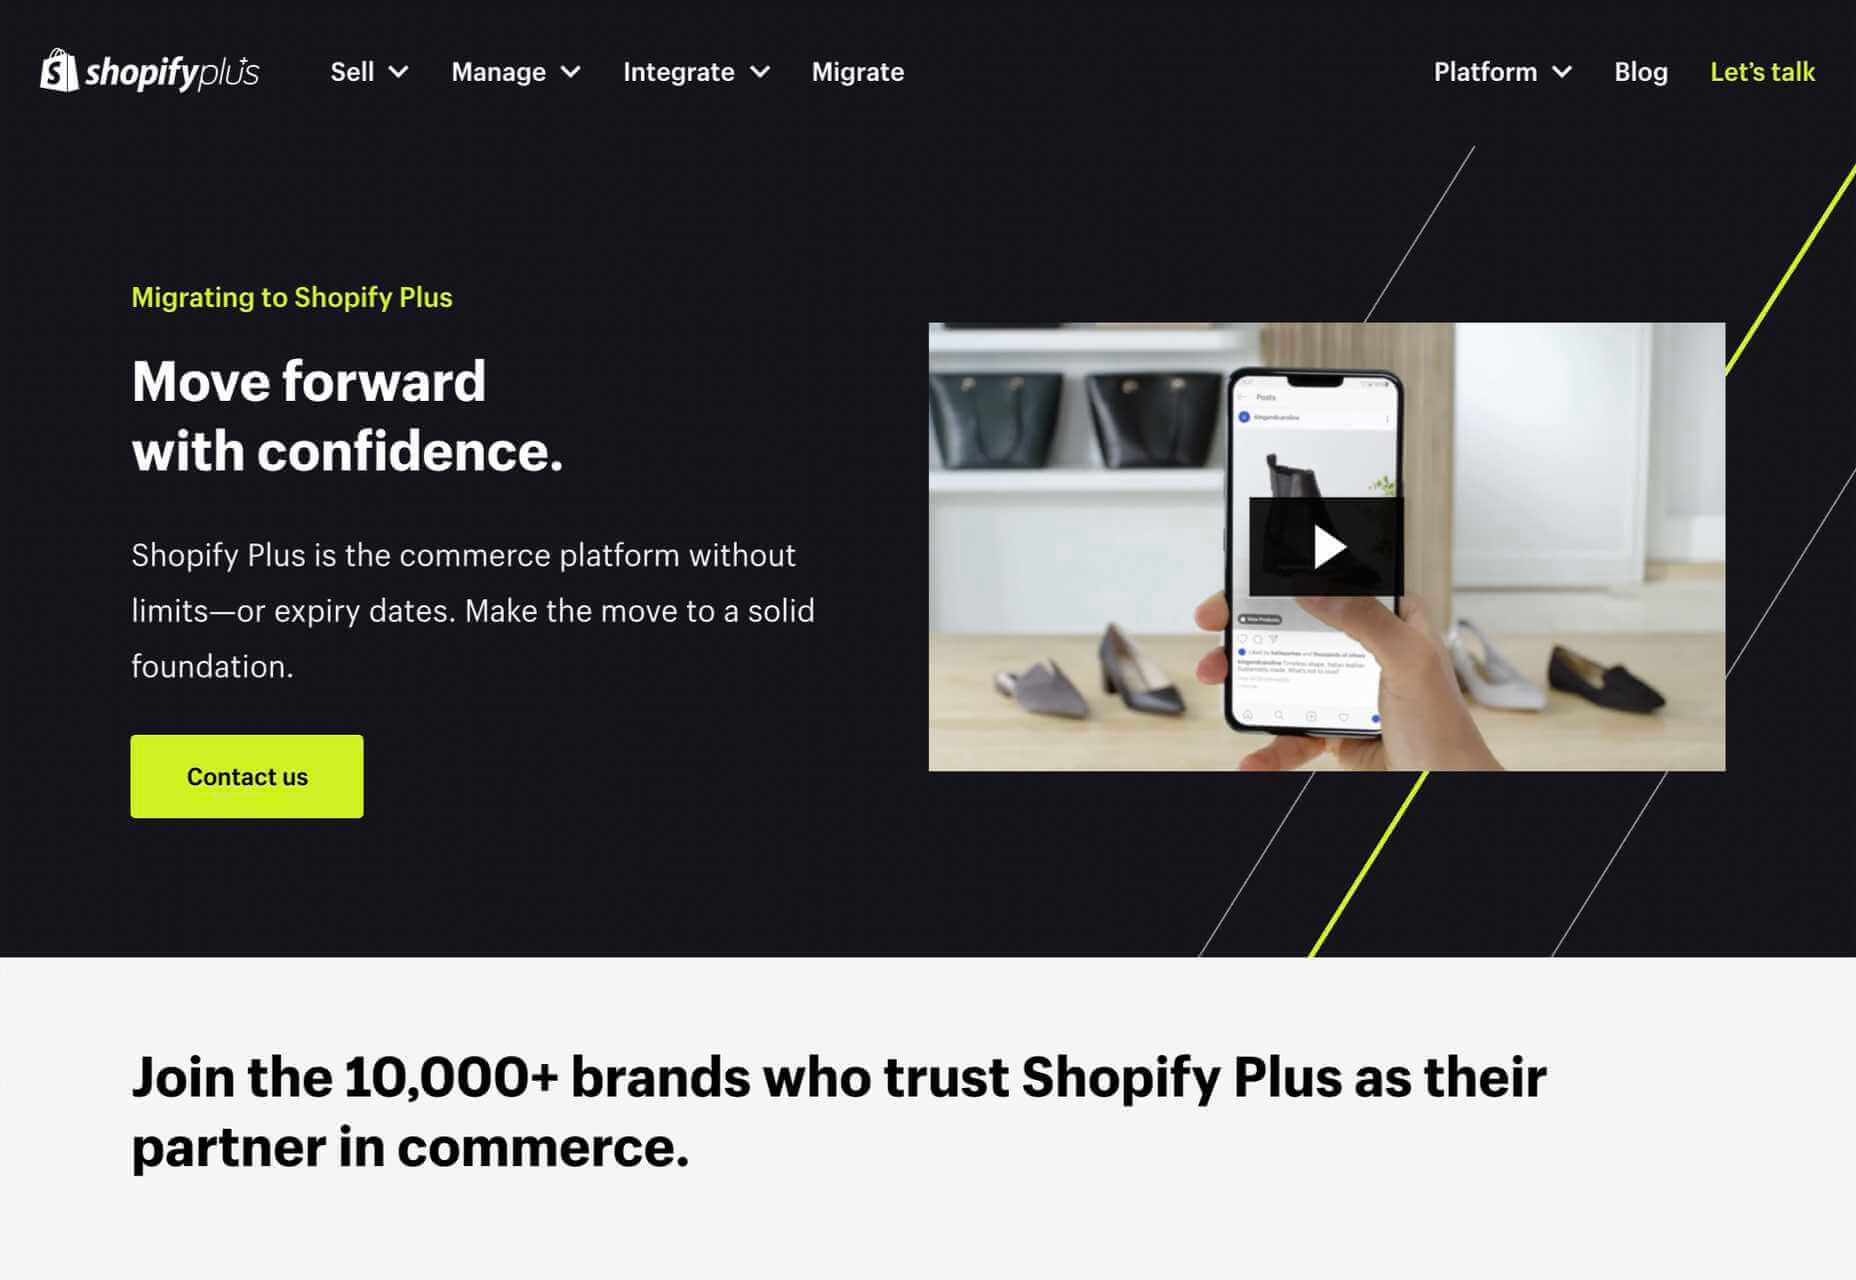
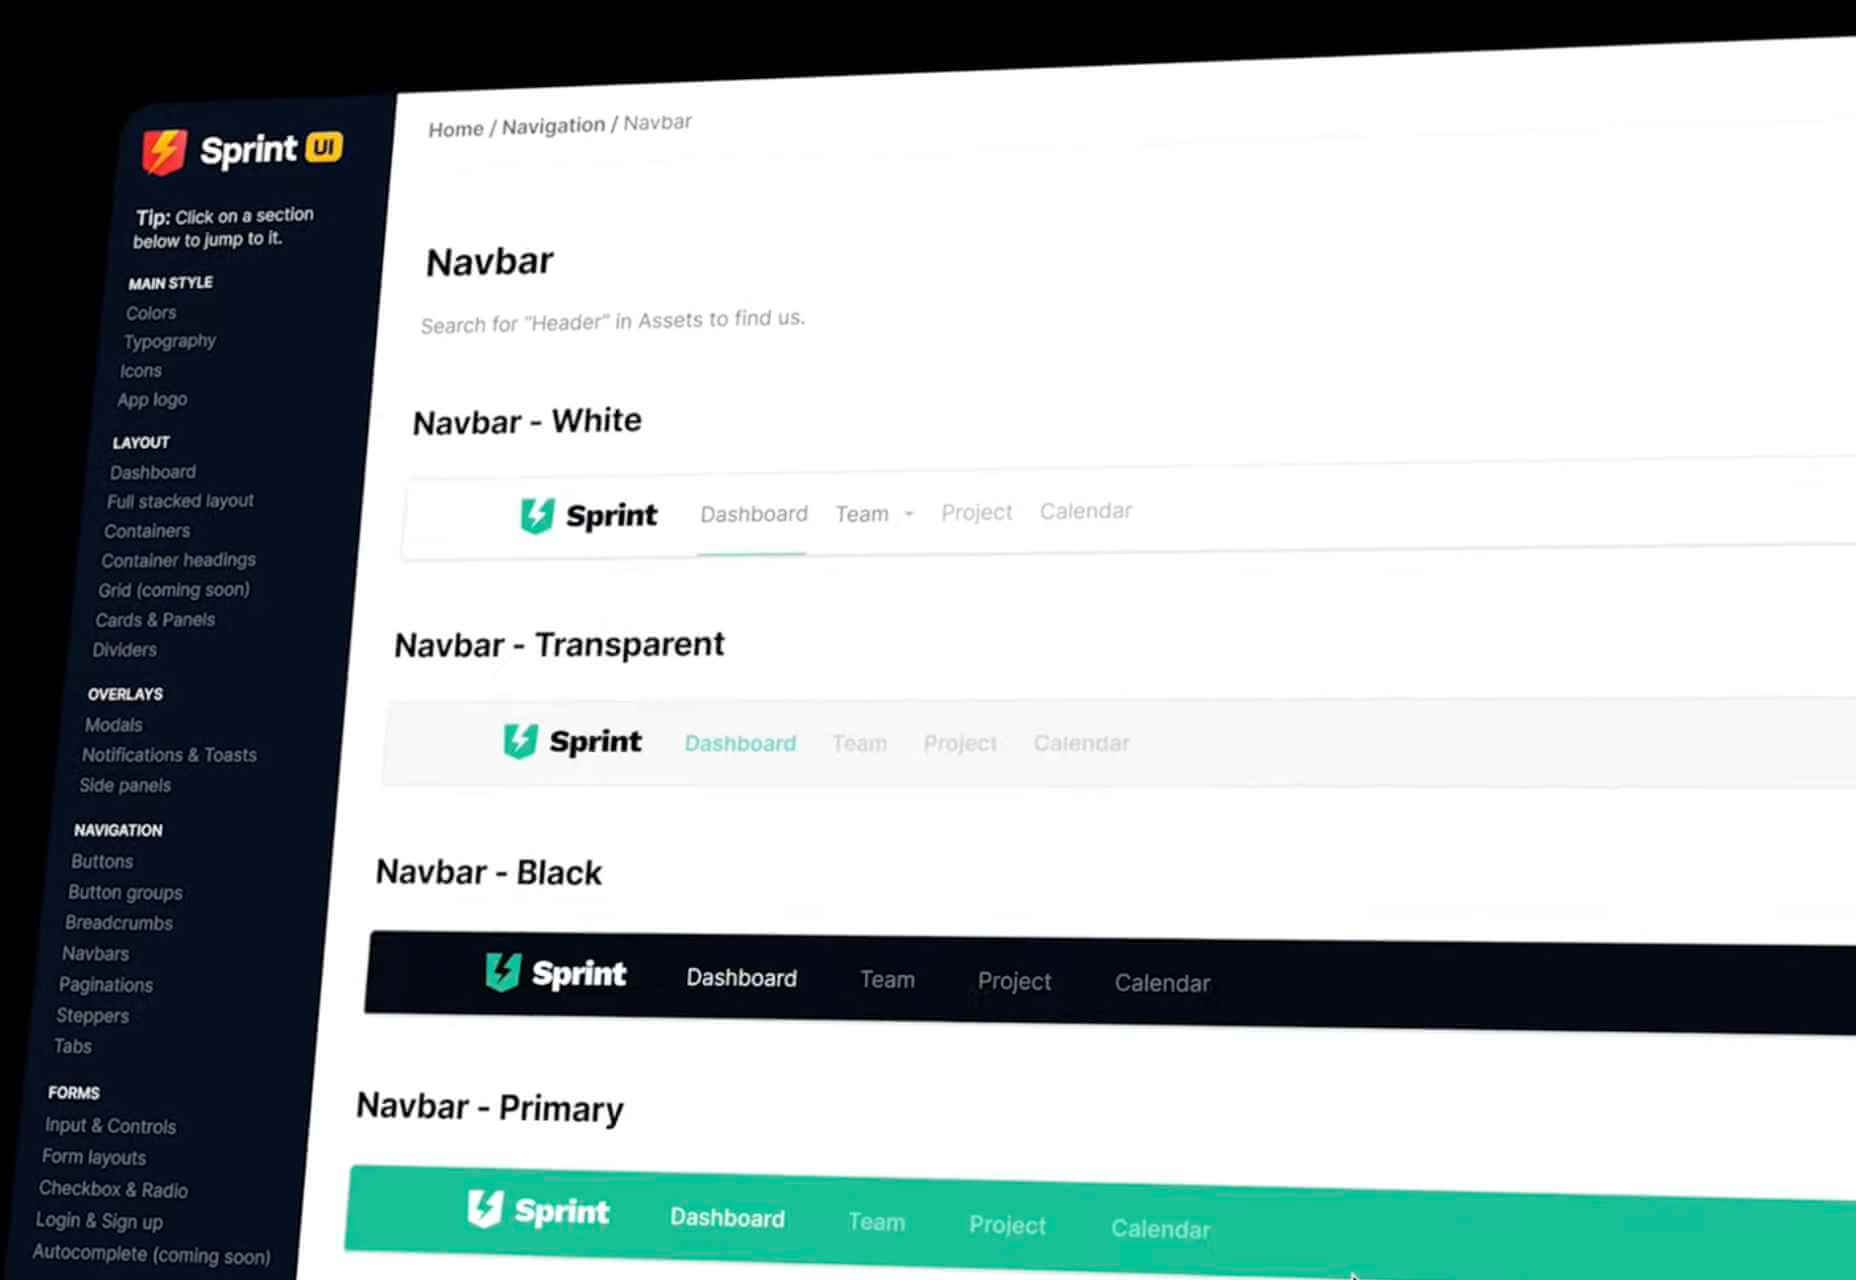
10. Drop the Nav
Most sites have a single main menu and a rich footer with links to customer service, contact pages, and so forth. These are detrimental on a landing page because you’ll leak traffic to other, less-focused parts of your site.
Your landing page is a streamlined selling machine. The only link you want on the page is your CTA.
It’s fine to keep legal text and even links to privacy policies — users rarely click those anyway. You can also link to your homepage using your logo. But don’t add any navigation that invites a click, or you’ll dilute all the work you’ve put in.
Source
The post 10 Elements of Landing Pages That Convert first appeared on Webdesigner Depot.

Source de l’article sur Webdesignerdepot

 Every day design fans submit incredible industry stories to our sister-site, Webdesigner News. Our colleagues sift through it, selecting the very best stories from the design, UX, tech, and development worlds and posting them live on the site.


 Sometimes you just don’t give a damn anymore. Possibly the only thing worse than designer’s block is designer’s apathy: that sinking feeling you get when you realize that you just don’t care about this particular piece of work anymore is disheartening.
 This week, in a move like something from a particularly eventful episode of The Office, popular project management app company Basecamp banned political and societal discussion in the company’s internal communications.

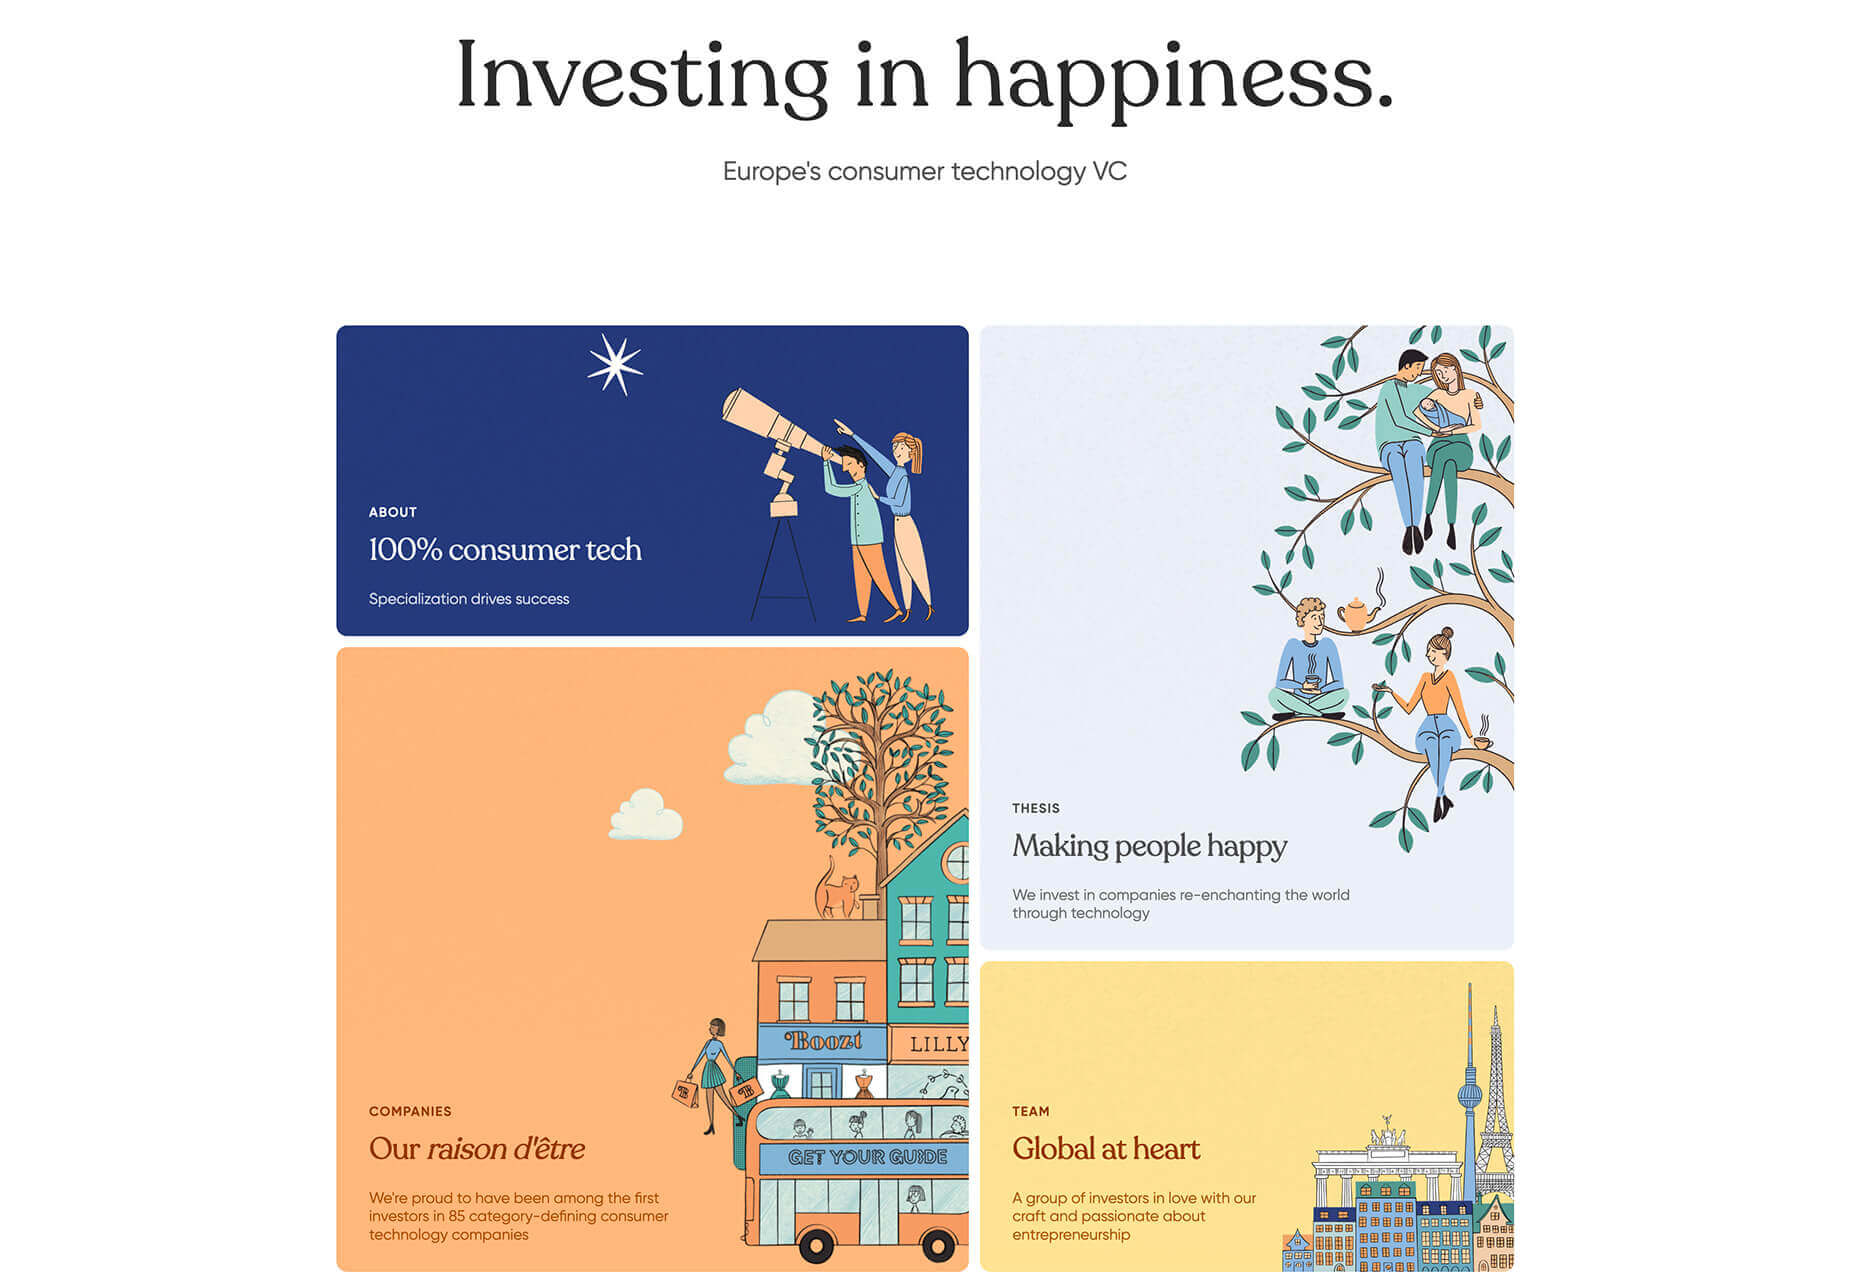
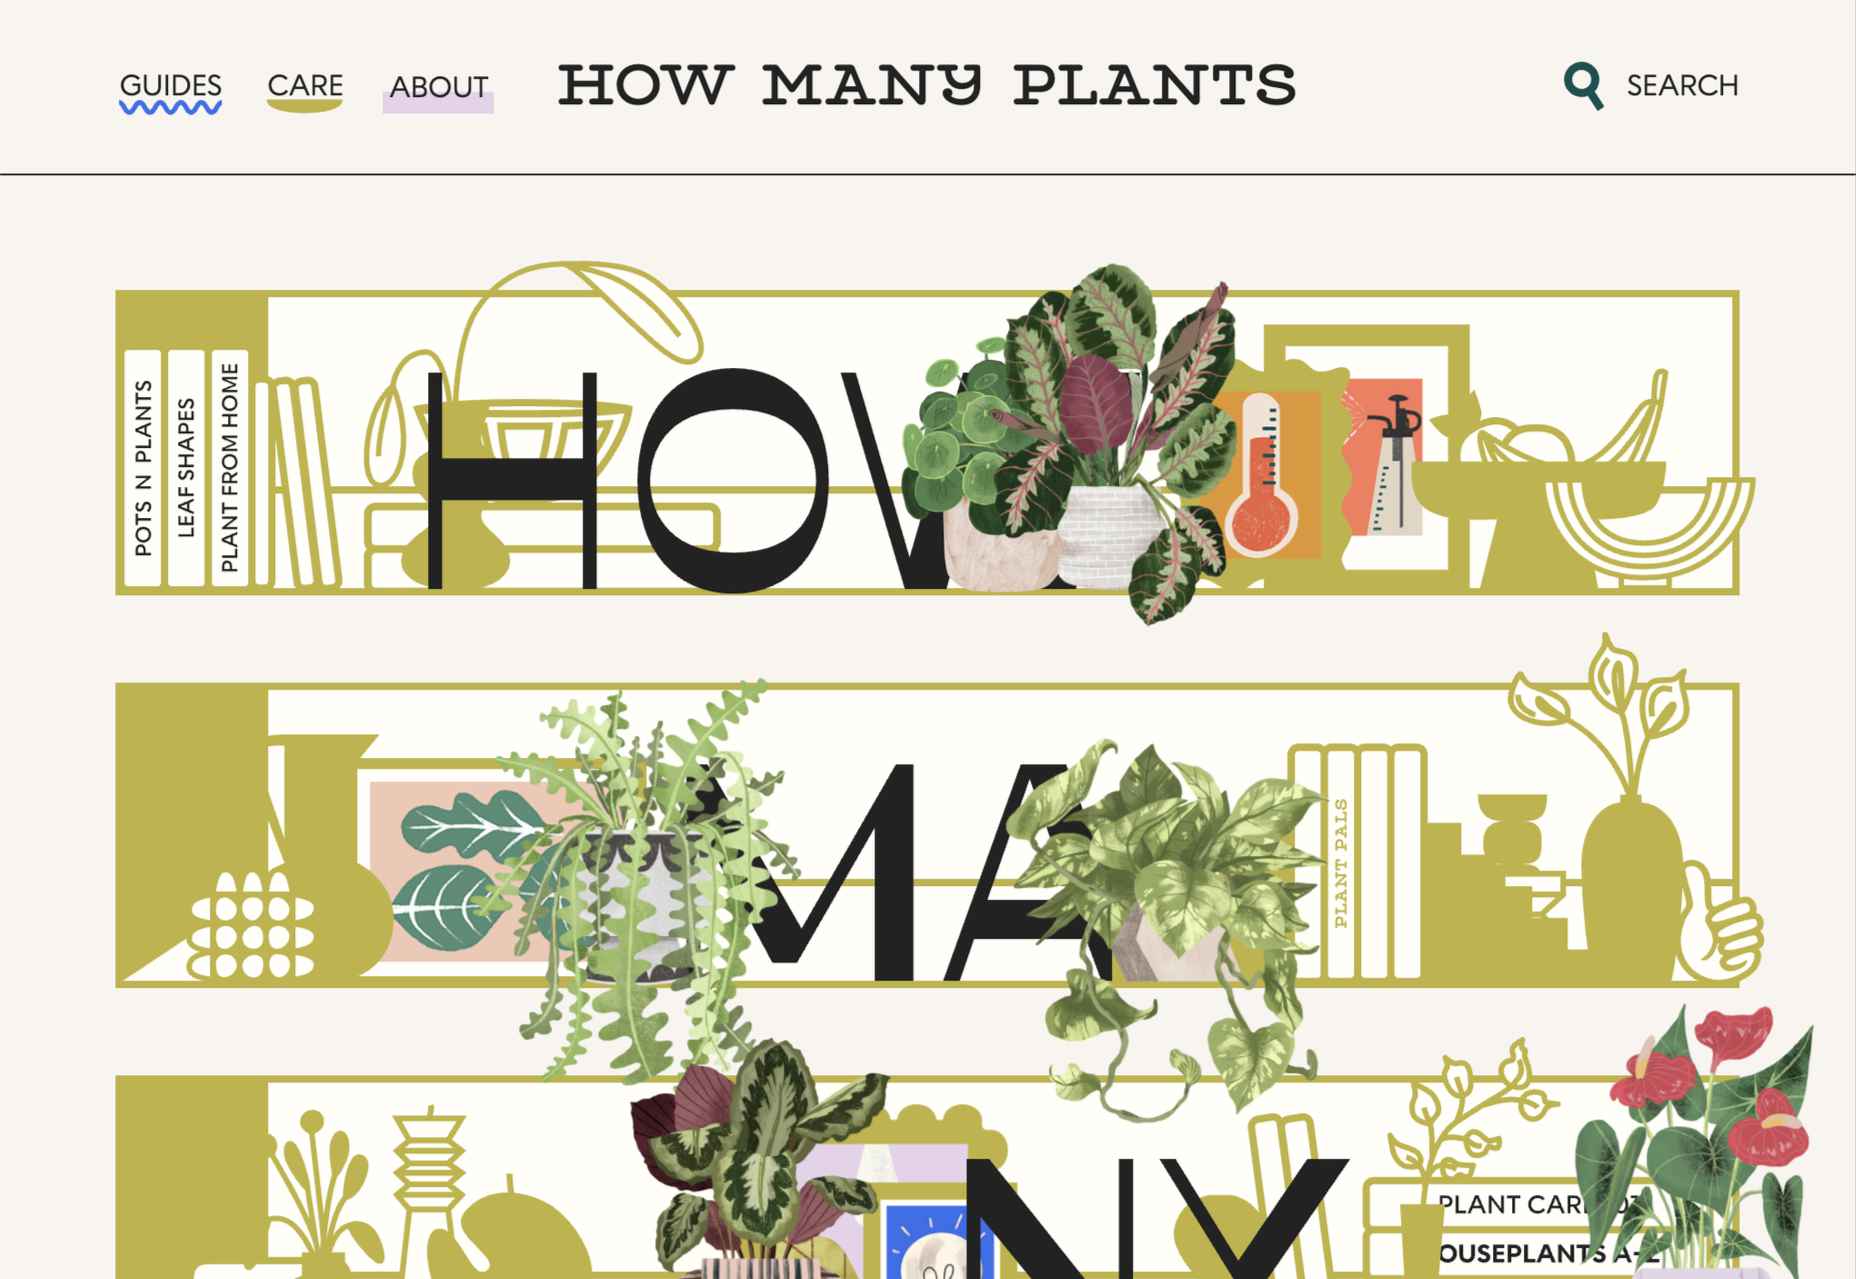
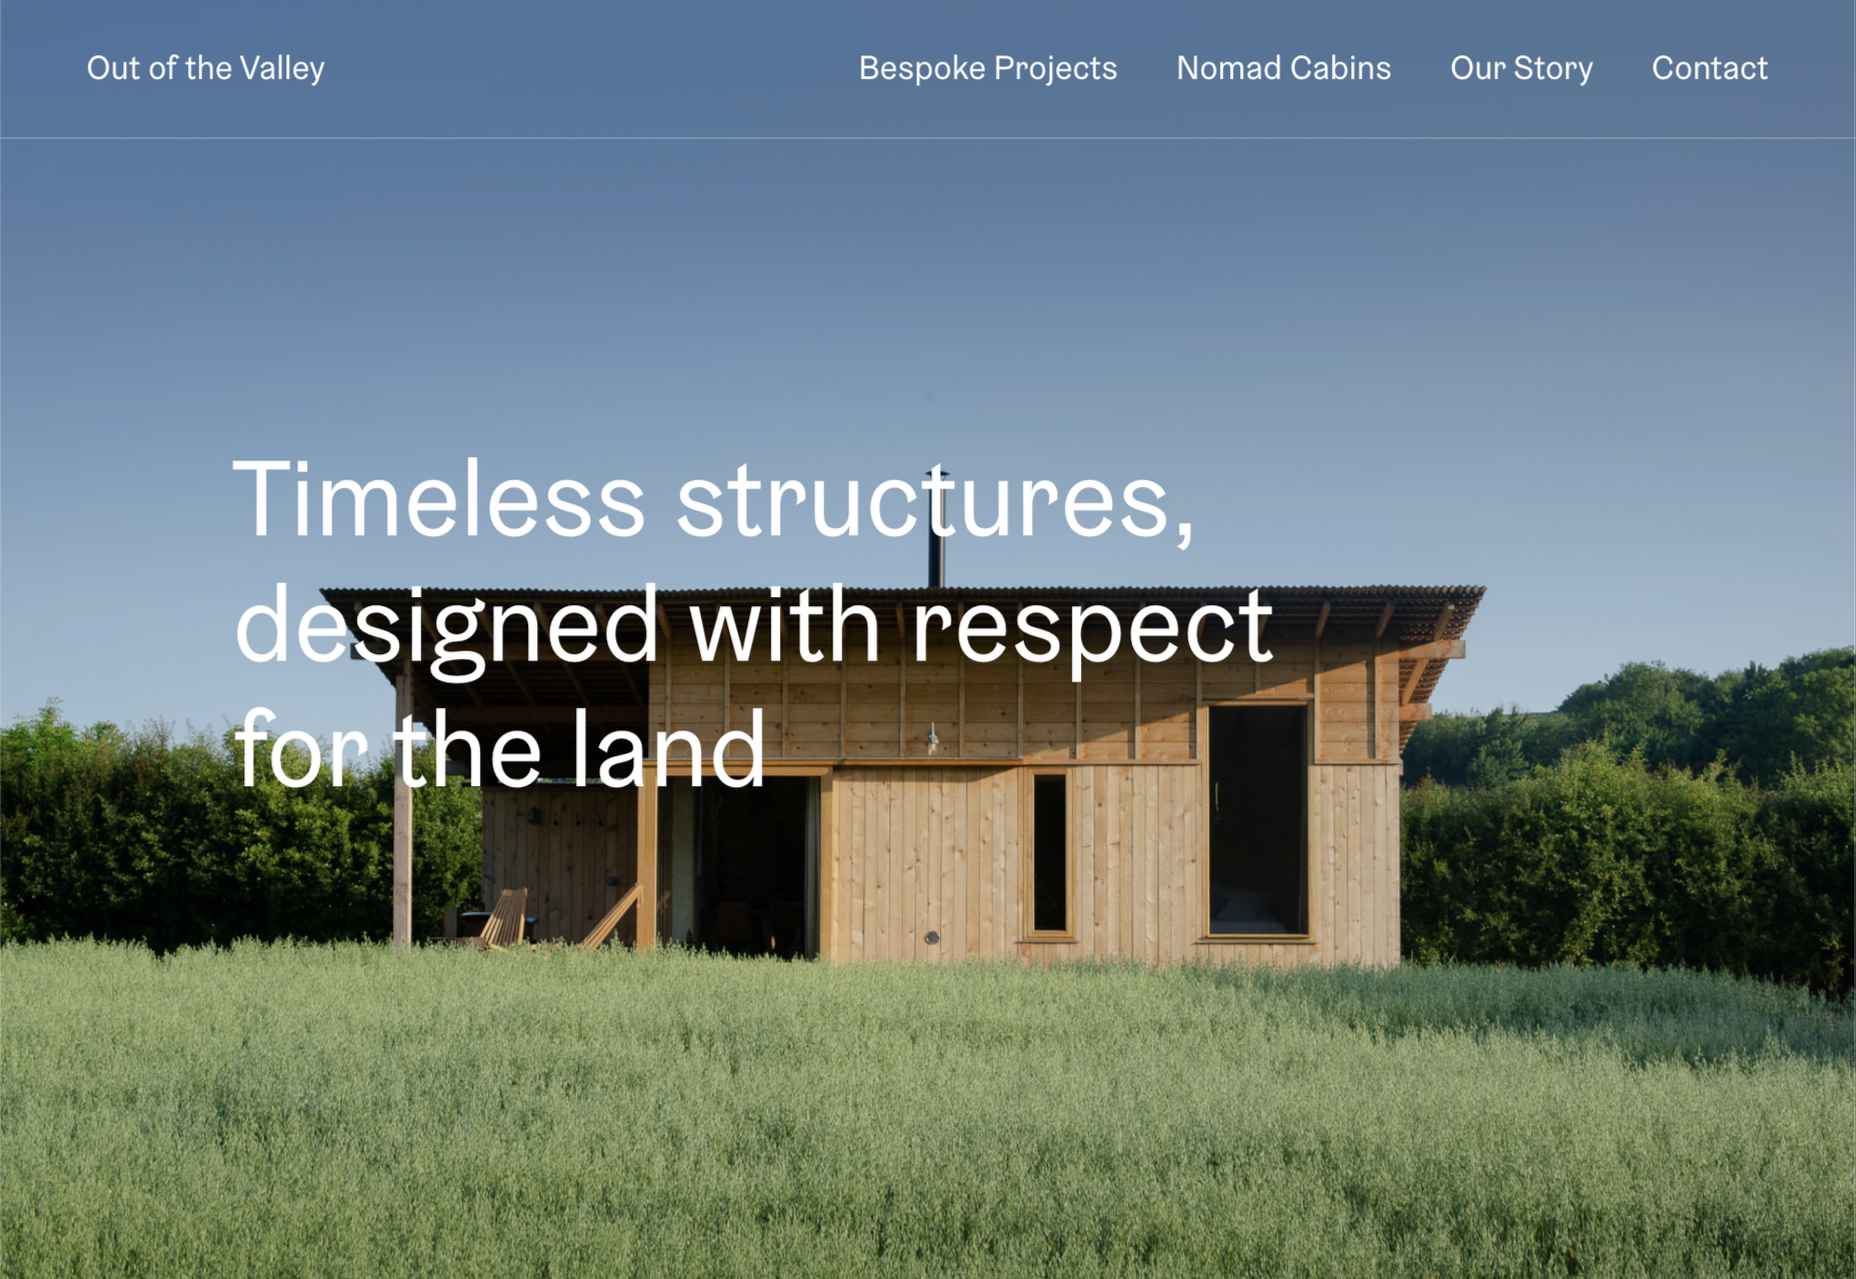
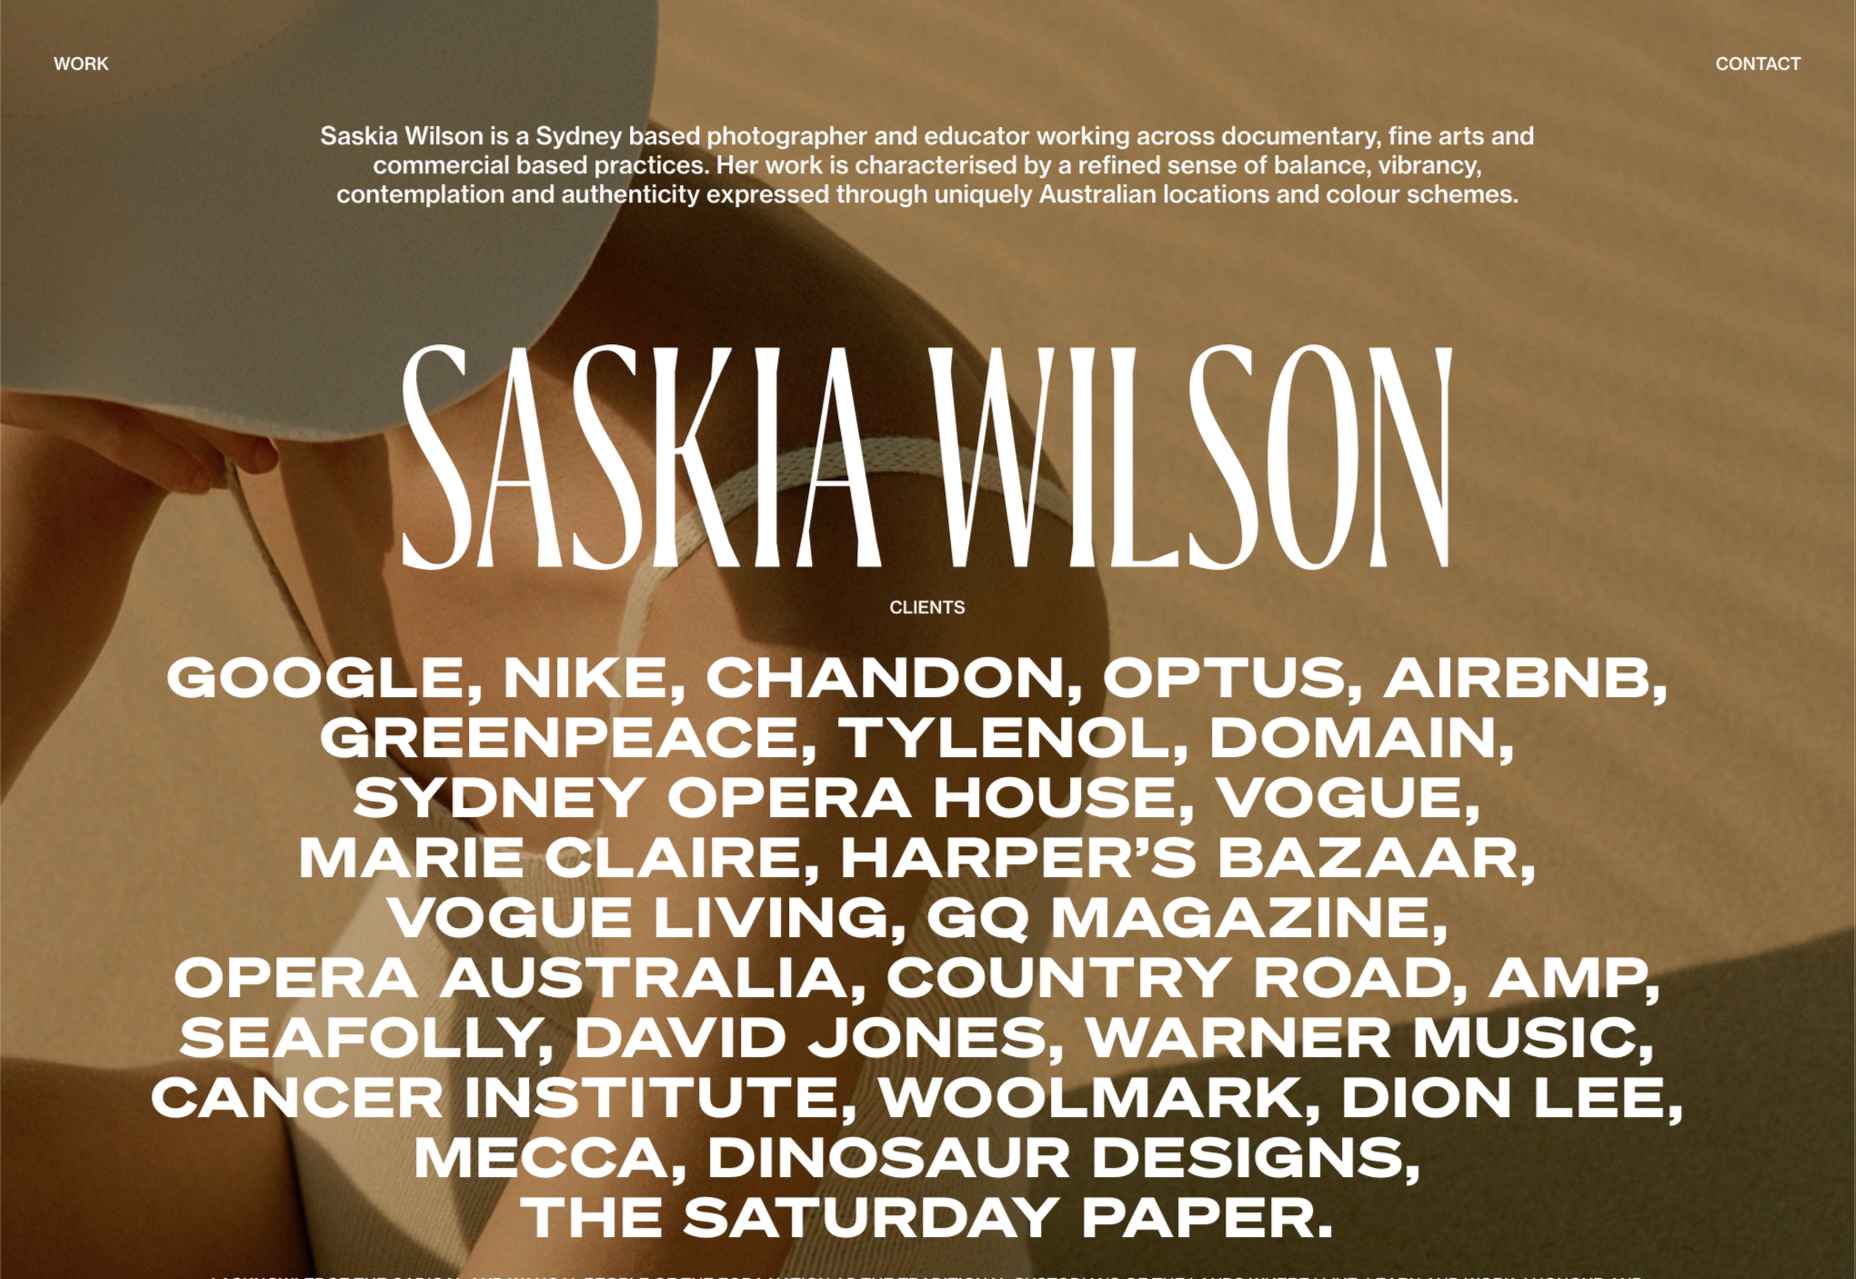
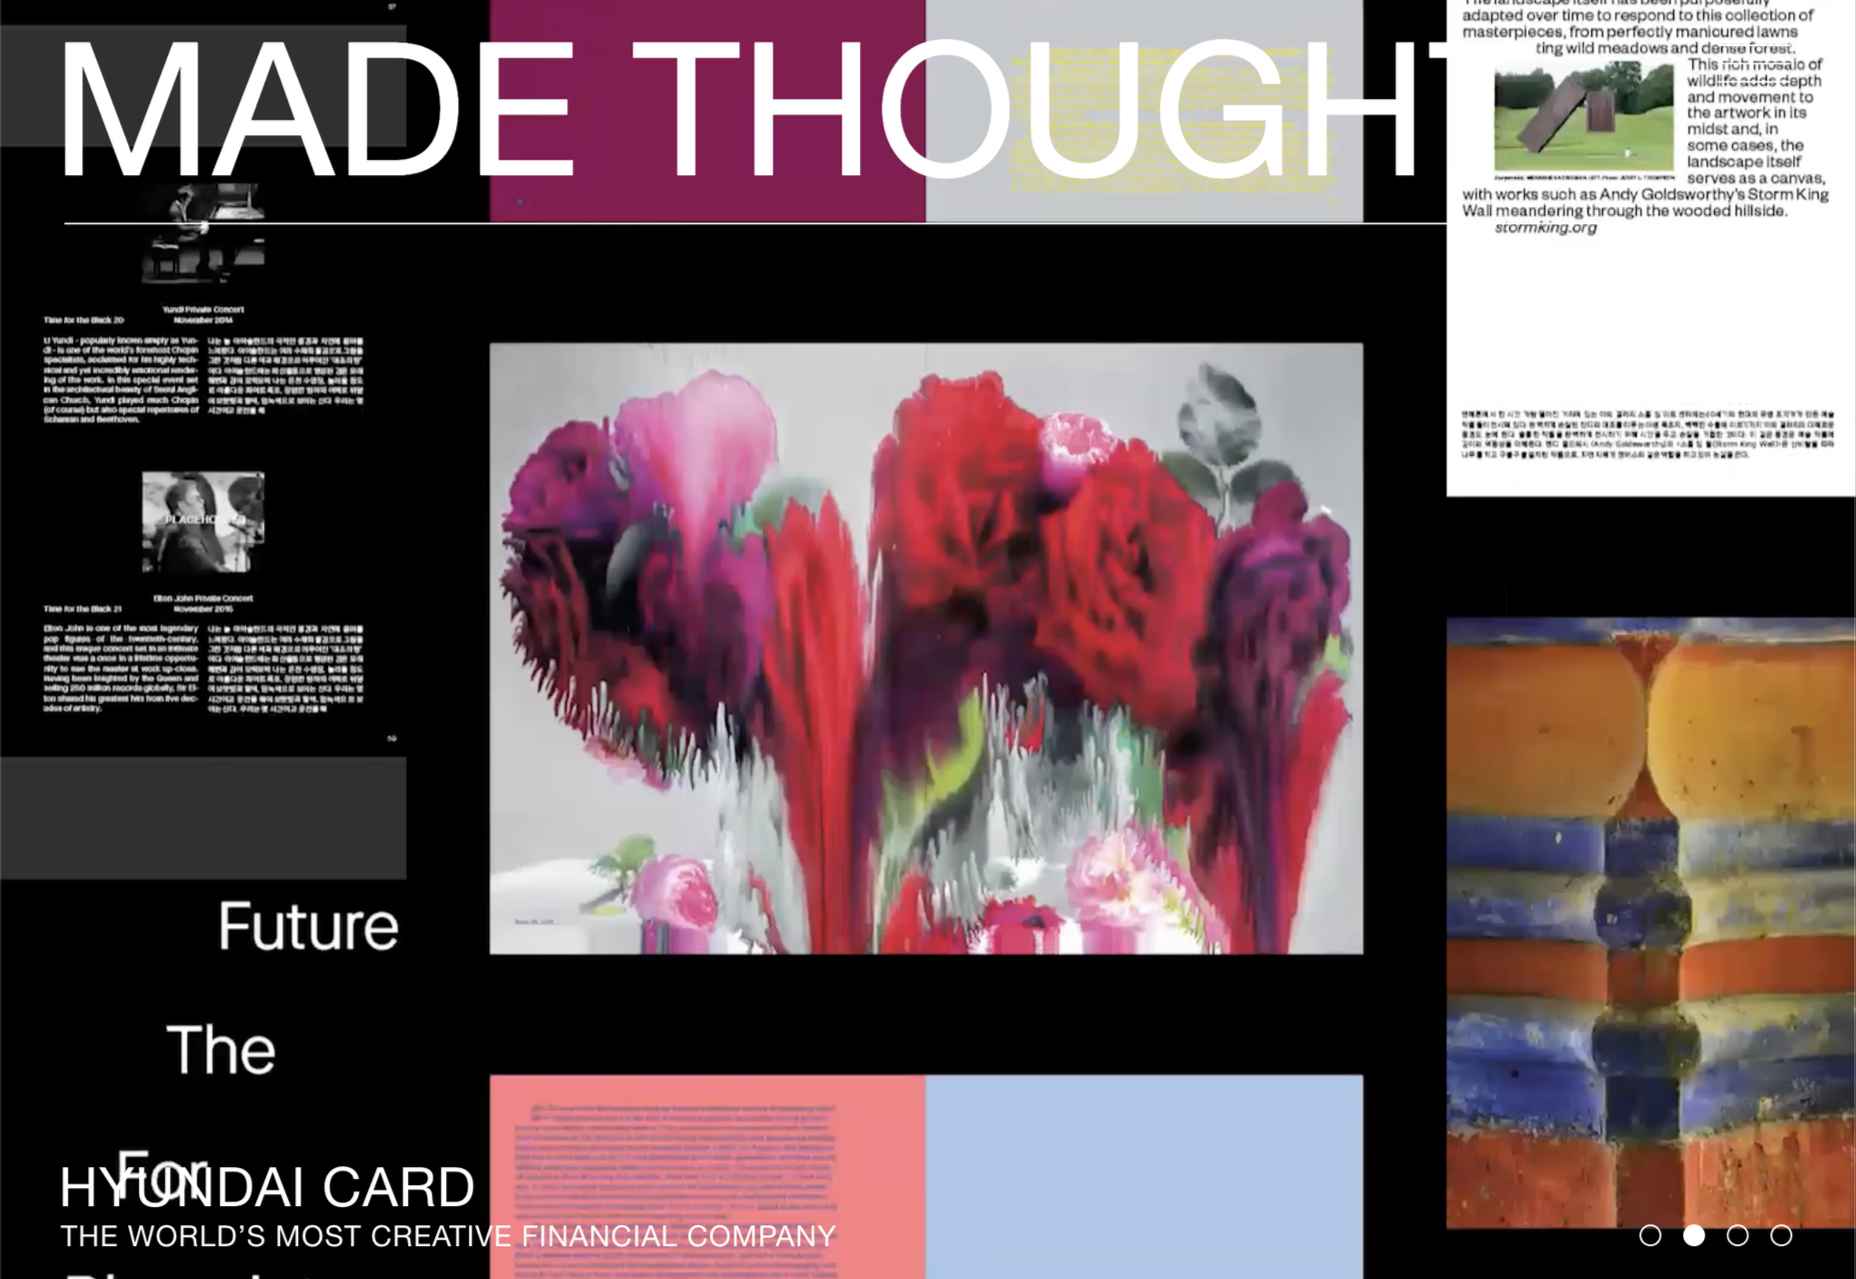
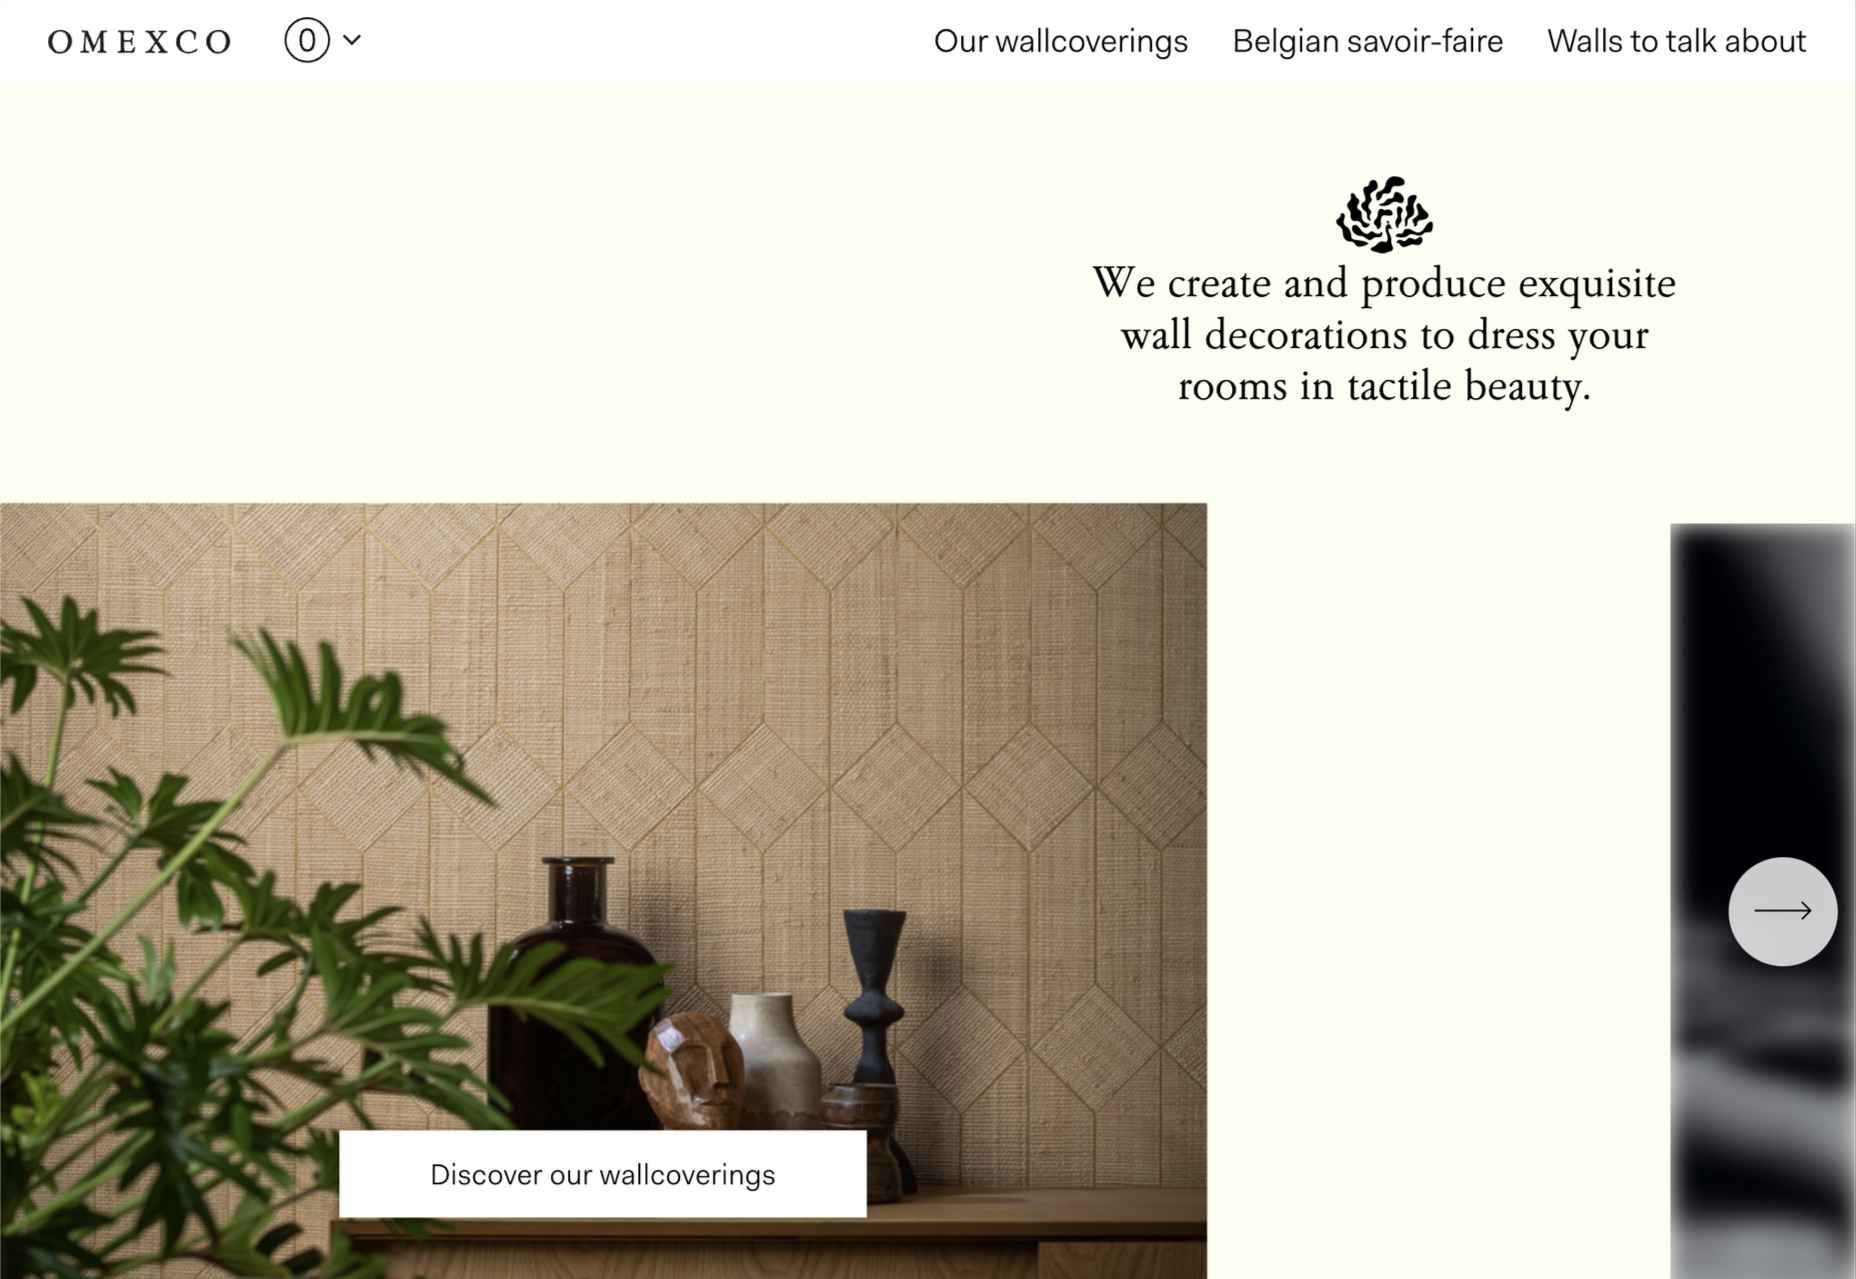
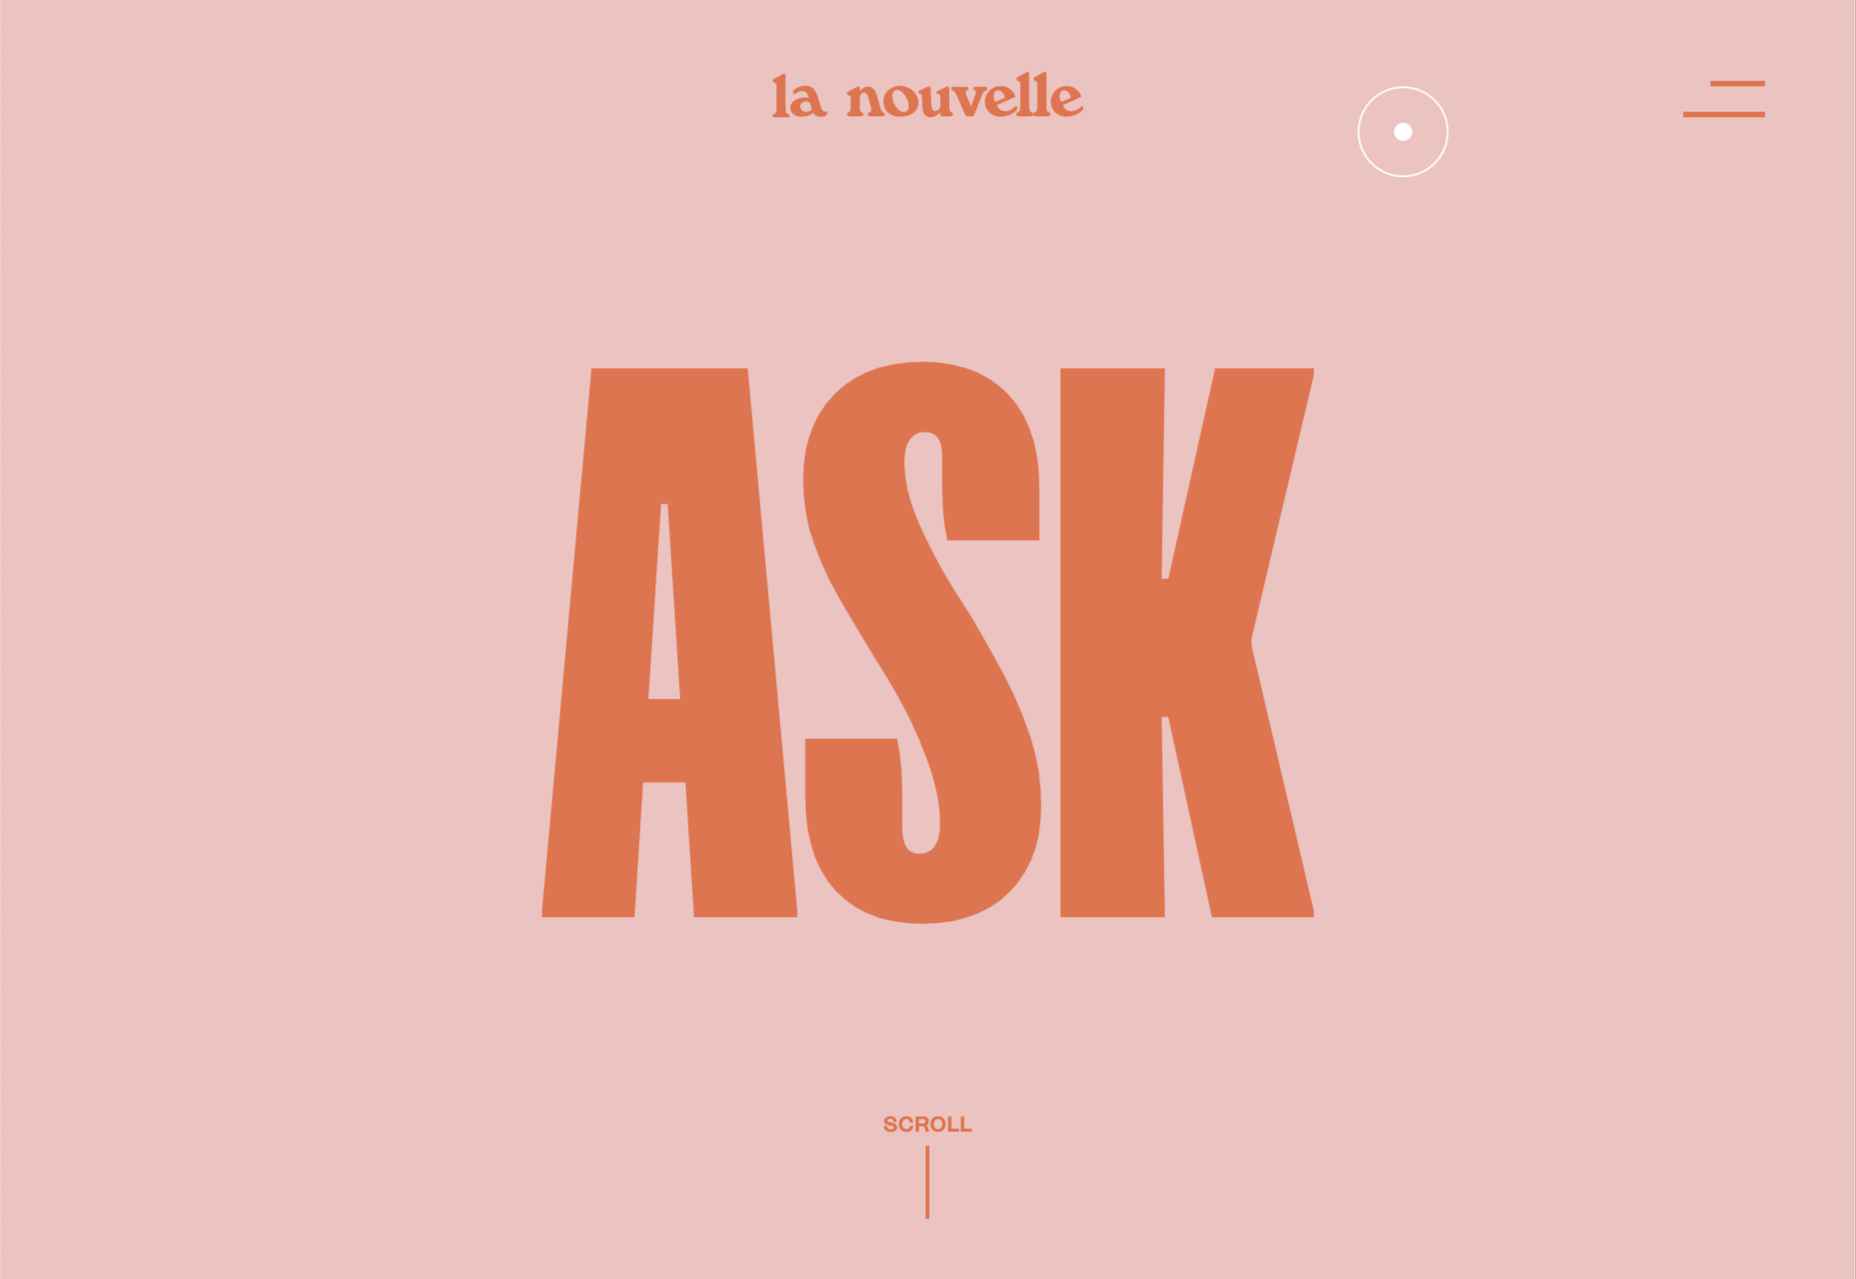
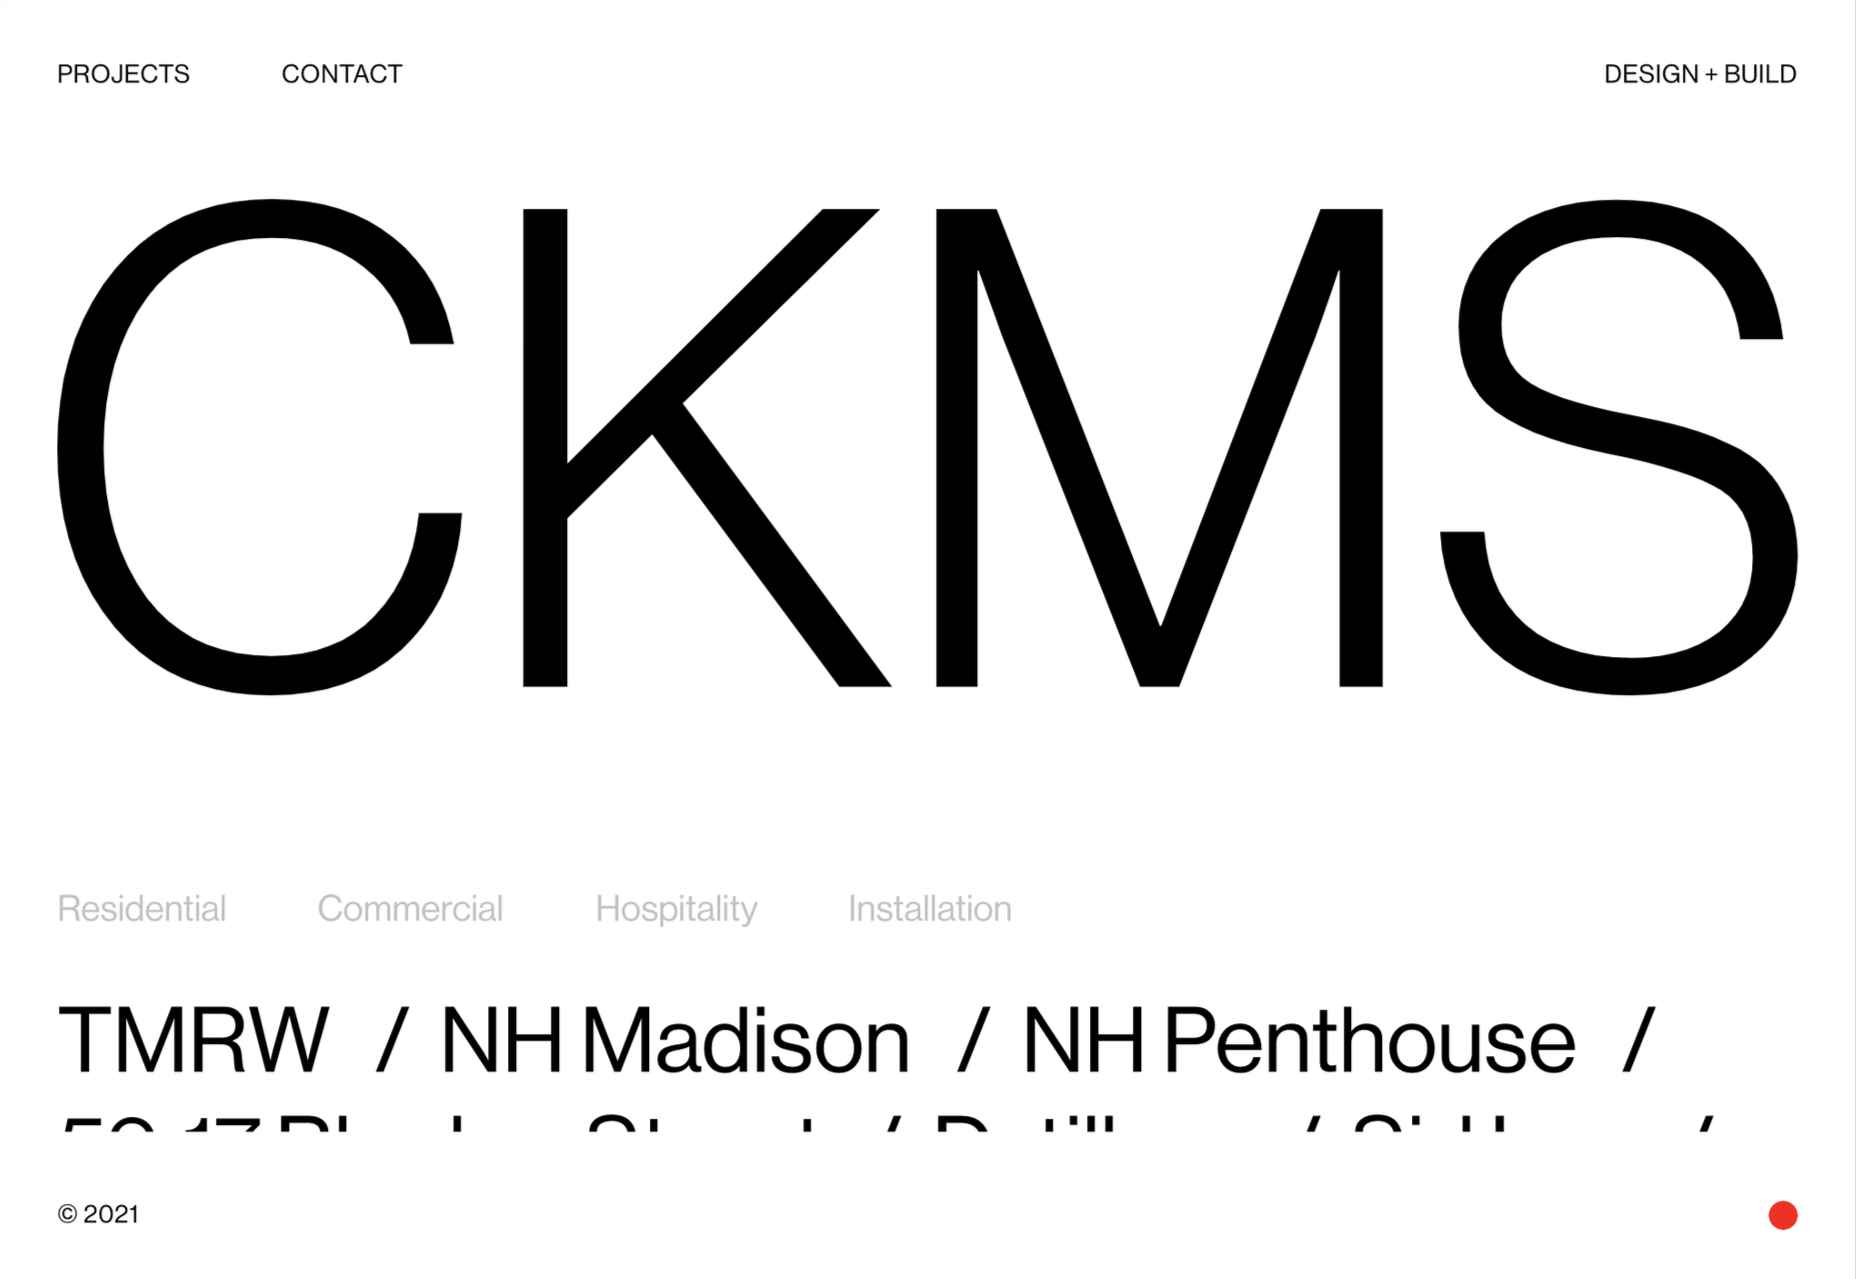
 This month’s collection contains a combination of big and bold, and clean and minimal. Although basic minimalism is still trendy, with lots of white space and greyscale type, we are seeing it softened with color. This is implemented differently, ranging from hints of off-whites in images to gentle pastels as section backgrounds.
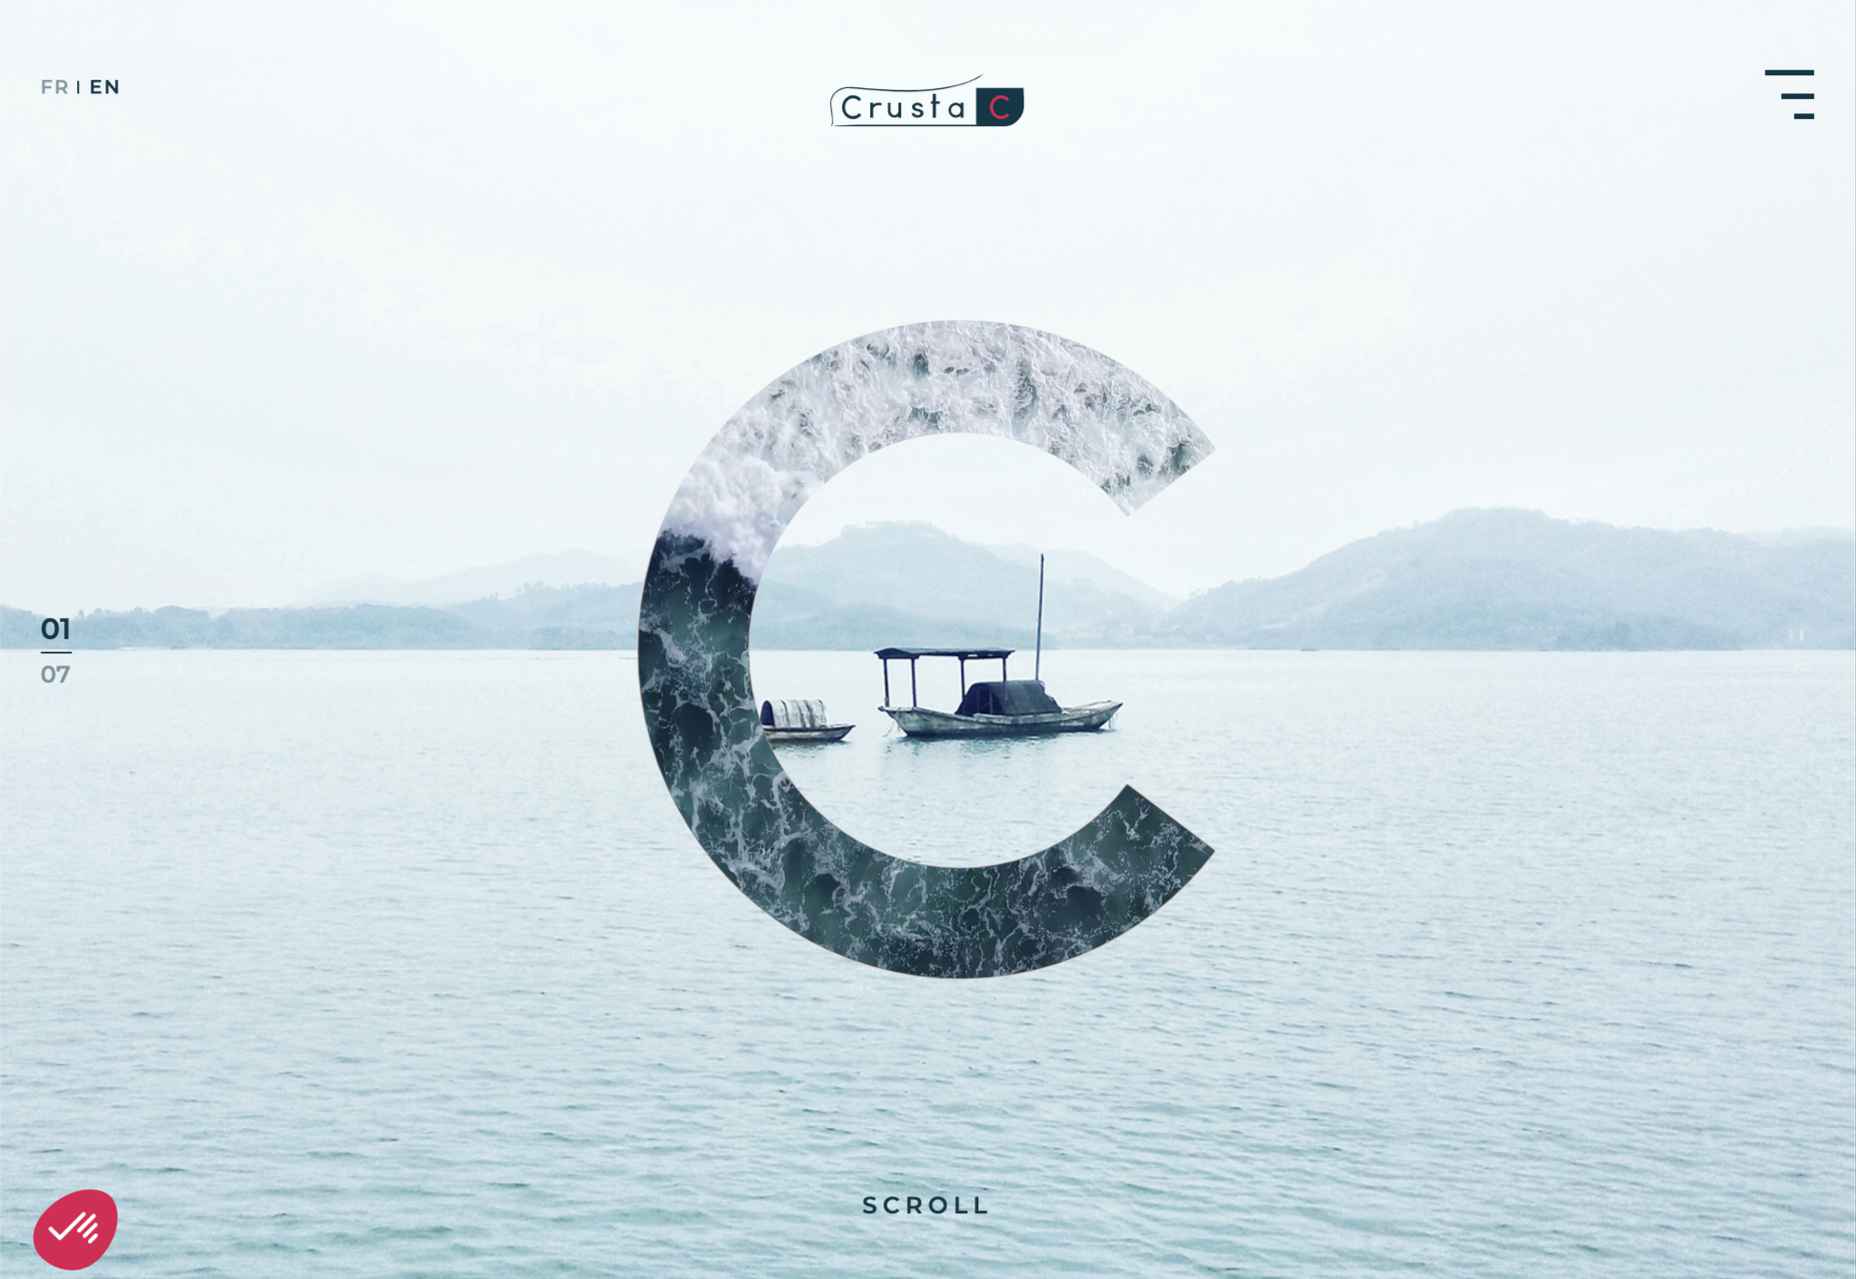


 Ten years ago, people began talking about the “Independent Web.” Although we don’t commonly use the term anymore, that doesn’t mean that it’s not still as vital a topic of discussion today as it was a decade ago.
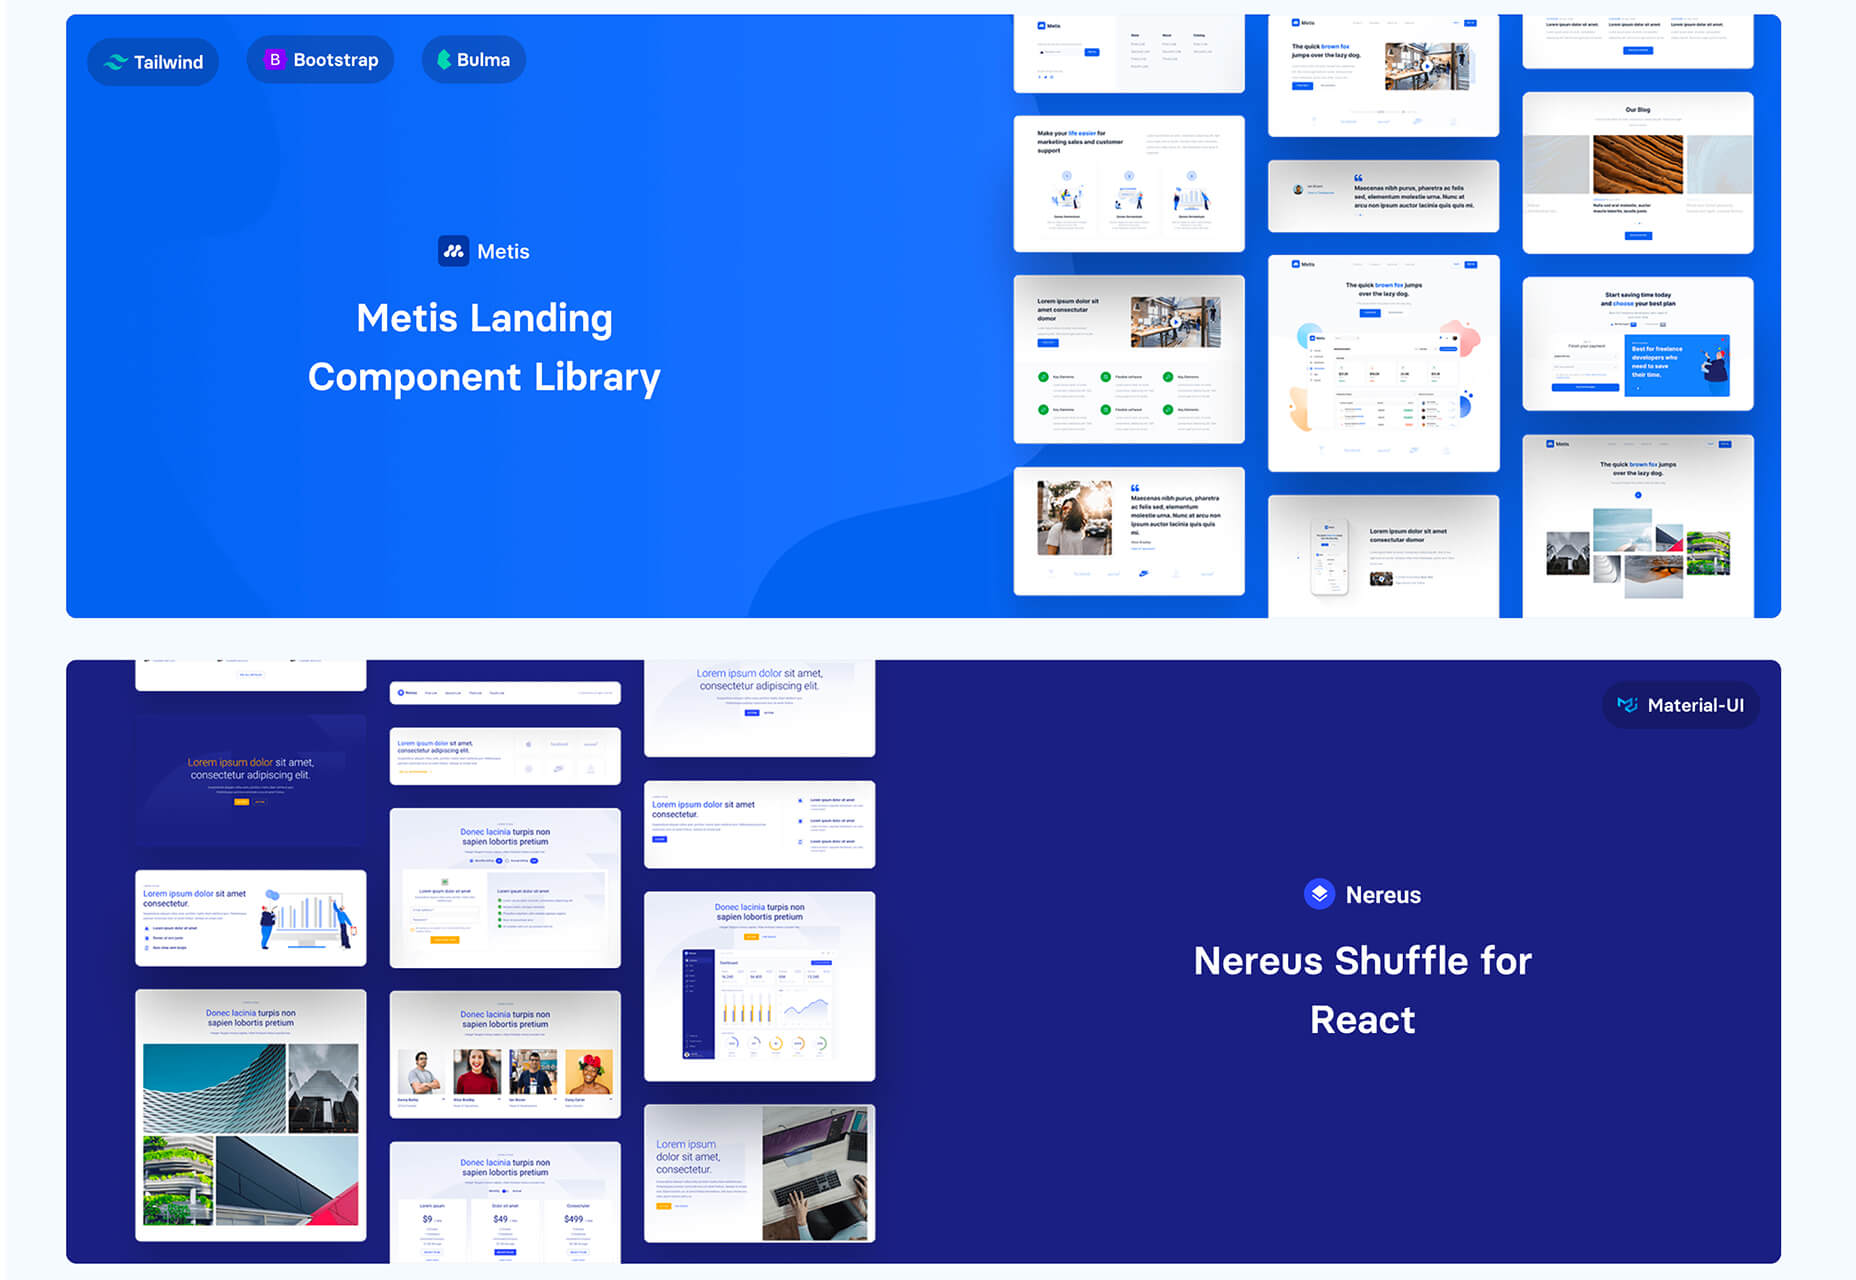
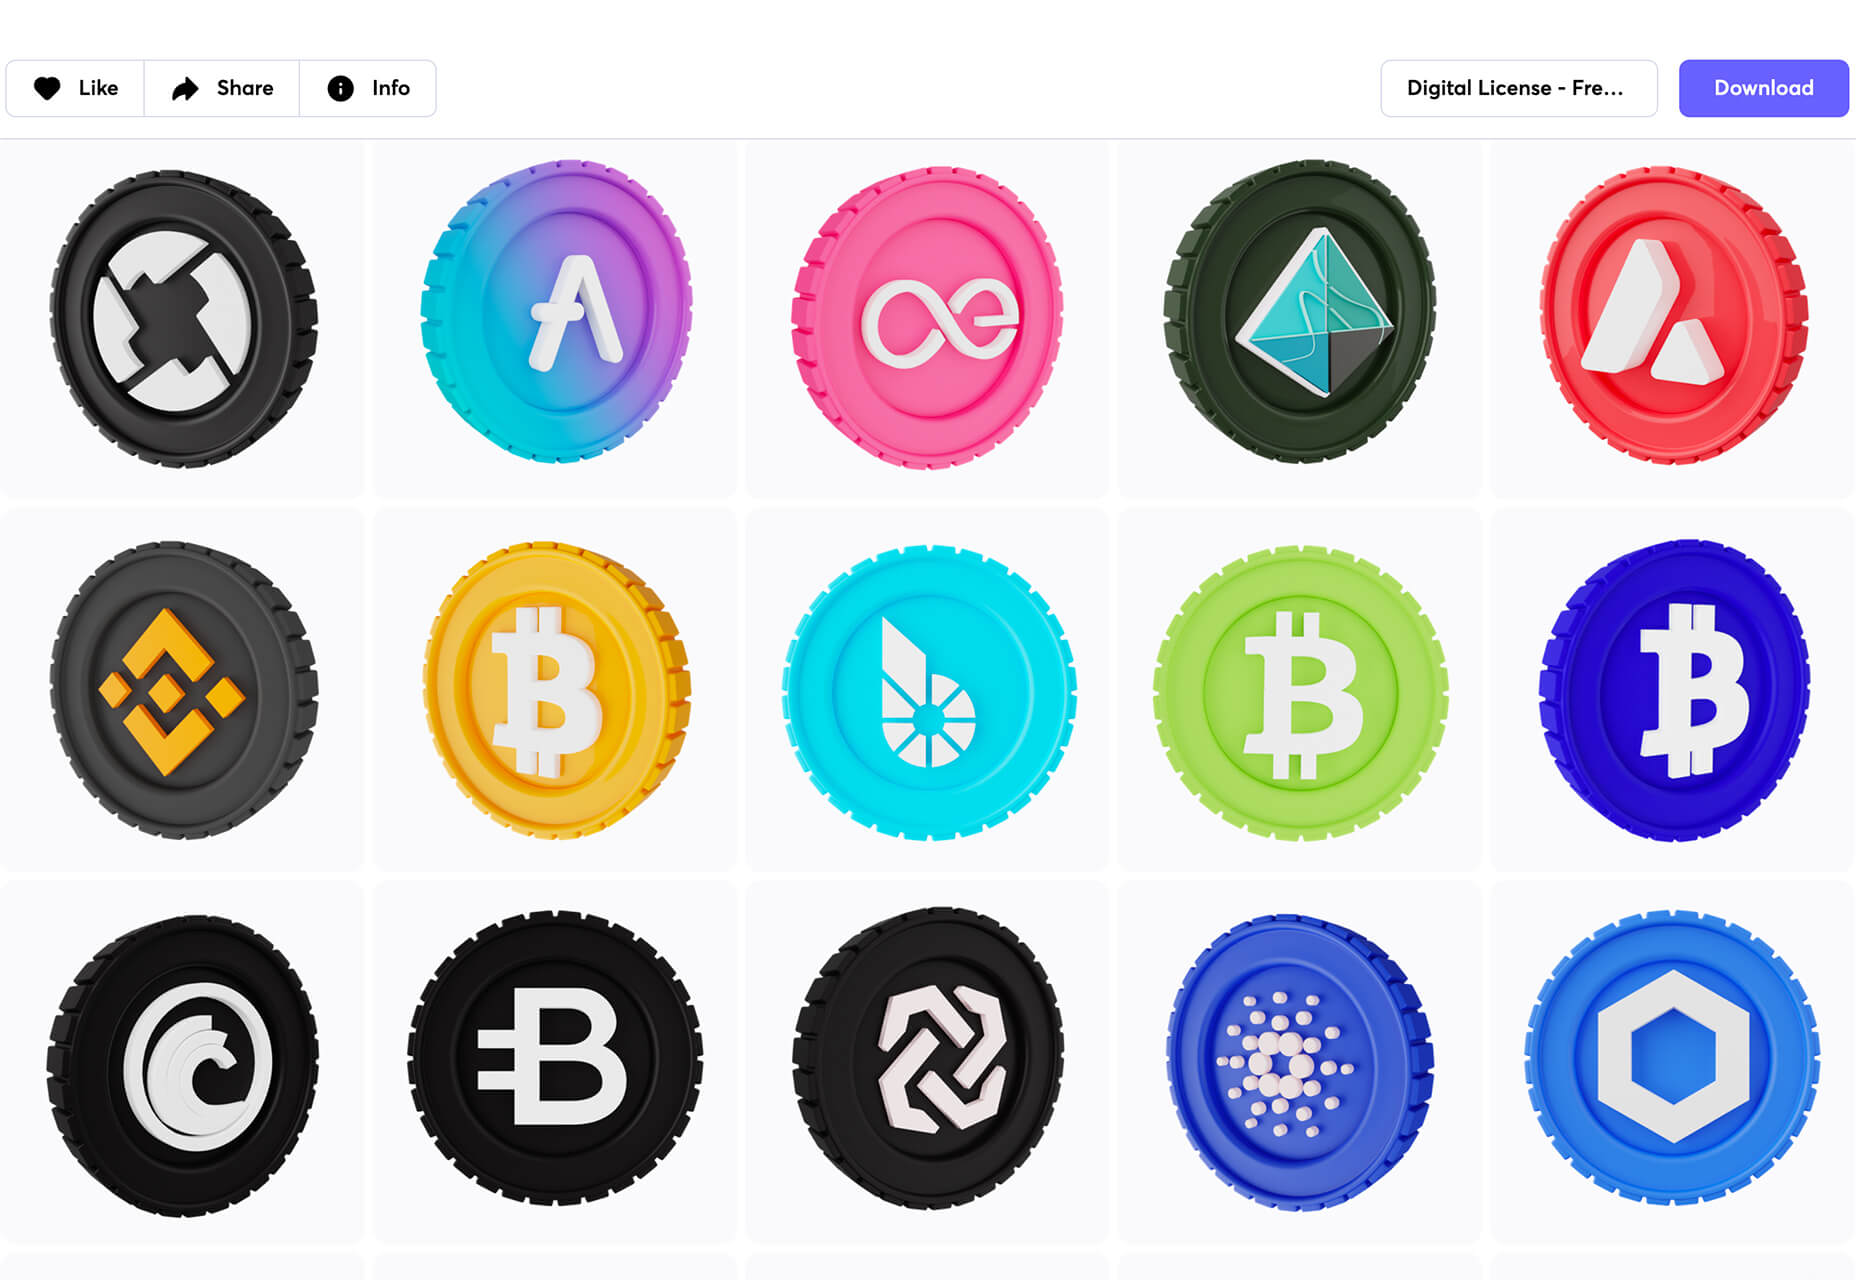
 Rather than spring cleaning, do some spring “shopping” for tools that will make your design life easier. Packed with free options this month, this list is crammed full of tools and elements that you can use in your work every day.